Bitcoin battles above 9k!Ichimoku Kinko Hyo
- Chikou Span (Green) - The lagging line has reversed into a bullish uptrend, but we have yet to see bullish up-cross we want for a buy signal.
- Tenkan Sen (Red) - Turning line has shifted into a horizontal direction. Indicating the market is within a ranging phase.
- Kijun Sen (Blue) - Our Standard line has dropped below the price, and it confirms the bullish uptrend we've seen over the past few hours. That is only a small uptrend within the overall bearish channel the price is moving through. It also confirms the formation of the double top.
- Senkou Span A & B - Senkou Span A and B are acting as resistance at 9,133 & 9,804 respectively. The Kumo (space between span A & B) is widening which indicates the volatility is further increasing.
MACD - We saw a big bullish divergence on 3/19 at 18:00, and BTC is headed into a phase of being overbought.
Stochastic RSI - We are very near the ceiling on the StochRSI at ~98 and signals some consolidation may be needed before we potentially continue the small rally we've had the past few hours.
Volume
Volume is bearish and shows some traders selling off while we are in that overbought area.
Chart Pattern
Previously an ascending triangle was in formation that may be turning into a bearish symmetrical triangle.
Candlesticks
We saw a hammer bottom 12 hours ago followed by 3 white soldiers rallying the price from 8600 to 9400. At that price point resistance was met and we saw a Shooting Star form.
Psychological Support + Resistance (Purple)
We saw Bitcoin bounce off the 8,400 psychological support. There was very little bullish momentum after the 9,200 resistance was broken, and we see a bearish candle forming on the chart with the price on top of this psychological support.
Fibonacci Retracement
During our bullish rally price moved from below the 0.5 level and turned it into support. With the price sitting on psychological support currently, we can see our next level of support is the .382 fibonacci level at ~9,088.
Conclusion
Over the next few hours I think the bears will be pulling us back for some consolidation after such a large rally. I expect the price to fall as low as 9k. Best case scenario our buying volume increases and we rally out of the downward channel we are currently in. This would happen at ~9.5k. Watch for the Chikou (Green) to cross the price, and Kijun (Blue) should stay below the price.
Our worst case bear scenario that I see playing out from this would be support breaking at the 9k mark. If this happened we could possibly fall to 8.3-8.5k. Where we know there are a lot of bulls waiting.
Macdivergence

MACD Reader BTC_MoriceauThe idea of my Thesis is to create an indicator whose is "reading" the MACD indicator and tell you when you can sell and buy. The most important in this indicator is the value of the MACD reader set with the back test of the Bitcoin and Gold.


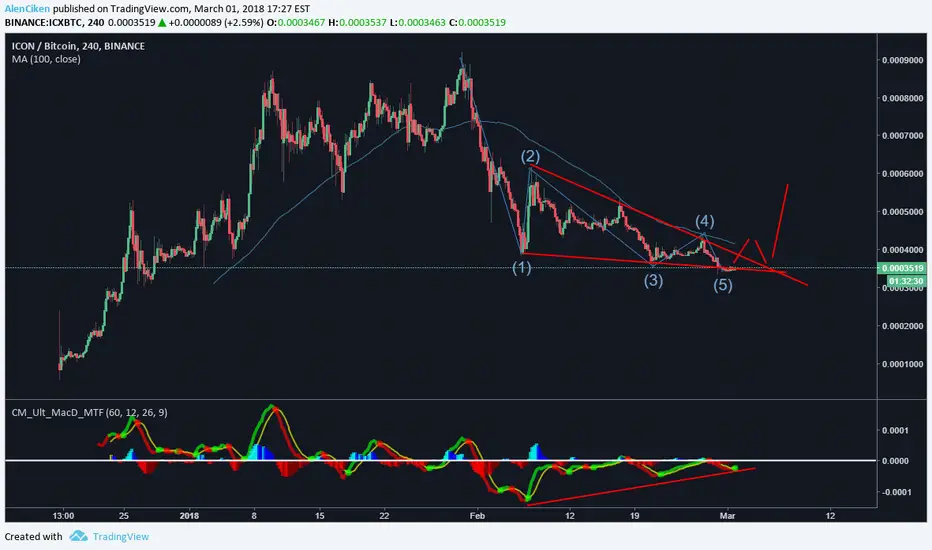
Forming triangle, bullish divergence MACD, Hard PUMP soonReasons for buy:
-Triangle forming-watch for breakout
-bullish divergence macd

Bitcoin Correction Likely Not Over Yet!****Note: I'm not sure why the main graph is not showing all pertinent information...please look at photos attached below for better idea!****
It seems certain that an Elliott ABC correction completed for BITFINEX:BTCUSD ; however I am not quite convinced a new impulsive wave have formed. Therefore, we are currently undergoing a "double three" correction.
It appears we have developed a 3 wave pattern (3-3-5) since completion of our ABC correction which may indicate this is an "X" wave of a larger WXY combination corrective wave in which "W" represents our initial ABC corrective wave, "X" represents our current position as a reactionary wave, and "Y" represents a continuation ABC correction that has yet to come.
1Day Chart:

EMC2/BTC looking goodEMC2 seems to have broken the trendline. The daily MACD has crossed which is a good sign. Looking ready to give %30 within next day or two.
Good Luck,
tipbox:
17BUPYGRFqknHUSKTQAmNRrDKsMyH29rvZ - BCH
GTeHWtQaQAGeeEkW5gtgSPaWnMZmyQrUdR - BTG -4.91% 1.34% 1.34% -4.72% 2.25%
XmXxWSgRqa4ZzzQUbWQnsAfxA1RGPScqZN - DASH
0xB62e34A9C3090Bb442a60C3f5d6Df72Db0341143 -ETH

BITCOIN - Expect Declines to $7200 Tonight - $6200 Still in ViewIf the Asian Bear comes out tonight, we will certainly see prices drop to $7,200 and pause slightly before dipping further.
BTC is due for a revival, but we cannot expect it to happen in a day. Play the ups and play the downs , or HODL if you wish.
1 hr MACD is showing downward momentum. 2 hr is dipping down.
Please give me a Like to show your support.
As always,
Happy Trading

BTC Done corrections? I think so.Bitcoin has been on a massive downtrend, and it feels like it never ends. However, there are some good signs that the bottom could be near. First, the RSI is sooooo oversold. Usually, when the price reaches this level, it just snaps right back. The RSI is also at a key support area that held multiple times in the past. Looking at the MACD, we see bullish divergence (aka convergence). The lows get lower, but the MACD fails to get lower. That means that the bears are actually losing momentum. The volume is also picking up, which means a lot of people (and money) are showing interest.
In addition, the ABC corrections seem to be complete. I count five waves (blue) in wave C and even five subwaves (light blue; see chart below) in the fifth subwave (black) of the extended fifth wave (blue).
The fifth subwave (black) is almost exactly a 1 to 1 Extension of subwave 1 (black). That is very common fifth wave ratio and could signal the end. If I break it down even further, we see five sub-sub-sub-waves! The fifth wave is an expanding ending diagonal. What rare pattern to seal the end!
Sometimes we need to look at the big picture. We should not panic and look at the price every 5 mins if we're not day trading. We have not completed the fifth cycle wave, and I don't think we are even close to the very top.
The question is am I right? The answer is probably not. What I'm doing here is called "catching a falling knife". No one can predict the exact bottom, and I could be far from correct. There are still bearish signs. For instance, Bitcoin just broke a key support level, which happens to be the bottom line of a falling wedge. That is an extremely bad sign. Usually, you want to buy on confirmation of a breakout. That would mean Bitcoin needs break 10k.
However, for the risky and daring traders like me, this presents an interesting setup where we try to buy to bottom and make massive profits (if we're right). According to my analysis, $6230 should be around the bottom (This is just an complete guess for giggles and the memes).
Aggressive Play:
Entry: $5000-$6500
Target: $30,000
Stop:$4500
Time: Less than 6 months
Conservative Play:
Entry: Buy when Bitcoin breaks $10,000 with volume.
Target: $30,000
Stop: $9000
Time: Less that 6 months.

Be careful with WTC - don't buy the ATHWTC has so many bearish signals right now I don't even know where to begin.
Volume divergence. WTC is rising on decreasing volume.
RSI divergence. WTC rising despite weakening RSI.
MACD divergence. WTC rising despite weakening RSI.
Then there's the elliot wave analysis, which pretty clearly shows a retrace must be imminent.
Even if you dont believe ANY of that, simple trendline analysis shows that a return to the lower trendline will occur at some point.
If you're buying this... stop.

SHORT IN EURAUDAfter broken the consolidation in 1D, the price formed an ABC Diagonal on 4H chart. We have divergence in MACD, so now I'm waiting for drop, with the target at the top of ABC.
----------------
Después de romper la consolidación en 1D, a formado en el gráfico de 4H un ABC Diagonal. Tenemos también divergencia en MACD, así que busco una caída, con un primer profit en el tope del ABC.


Ford F Positive DivergenceMinimal risk trade .5% stop loss slightly lower than the previous low at 11.88 and first target area at 12.57 with ideas of higher goals

xdn/btcpatience is the key to survival in cryptoworld. Good days are near. Need just a little more down before up. Great opportunity to buy cheap at this level.
Good Luck

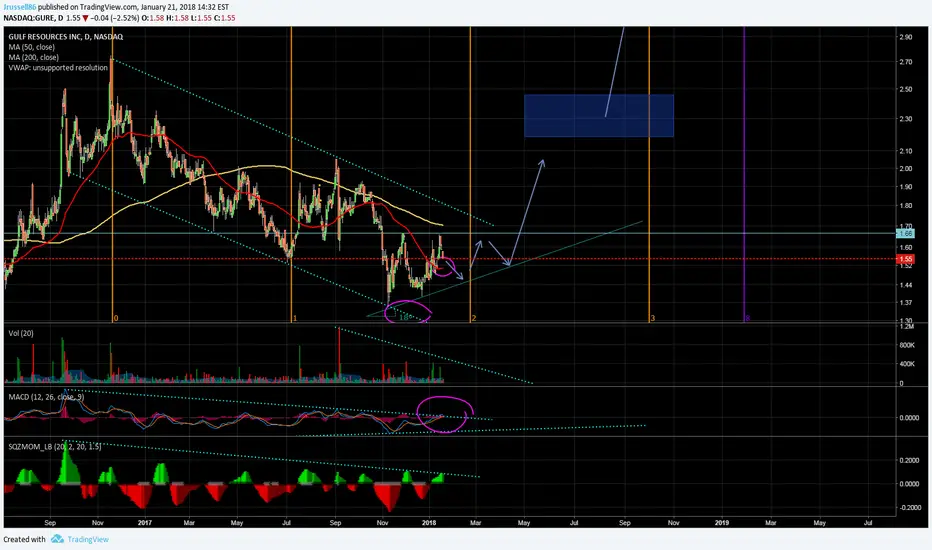
Ascending triangle forming Within *8 year Symmetrical triangle.
50Dma now tilted up. *>50% Undervalued.
DCF Models put fair value @ 7.06-19.88
D/E&DA <.01; *Current Ratio≈36*
Ascending triangle forming since November brings opportunities to accumulate at safer prices. This daily formed after bouncing off bottom downtrend boundary. Ascending triangles are bullish in nature as demand line rises towards supply line, but are not reliable upward breaking patterns however they do show that sentiment may be changing and that a reversal may be near.
This Ascending triangle is forming within and near the lower boundary of an 8 YEAR symmetrical triangle.
MACD crossing above 0 on daily signalling upward momentum.


Litecoin's down time is up. UPSIDE again!?Litecoin has been down trending for some time now.
Downside is about to end, as the charts suggest.
$197 looks quite a bargain price to bounce off which is the next support level.
The next support after $197 stands at around $169 which is major and bounce of this level will be quick.
MACD has been tangled for some time bouncing back and forth the orange line and the the tangle has deepened.
RSI is converging clearly settling at around 40 from 2 oversold scenarios recently which is again a bullish sign.
Also, as the Holidays are almost up which'll also be the factor to end downtrend as the New Year begins.
Happy new year.
Let's welcome 2018 with a big bang in Crypto.
Thank you.
Happy Trading.

All cryptocurrencies due for price correctionHere is a bitcoin example.
Price has entered a falling channel which normally breaks out upward. Also, both MACD and RSI are showing divergence. Both of these added together call for a future jump up in price. As of now, price should fall to the lower supports of the channel, or that orange line in the middle.


₿itcoin Cool Down and Bull TrendSeeing some small divergences on the OBV, MACD, and RSI the last push on the Bitstamp BITSTAMP:BTCUSD and Bitfinex BITFINEX:BTCUSD 15 minute. TD count shows a exhaustion cycle coming to an end soon on the 15 minute but exhaustion cycles have been unreliable on ₿TC lately. Hourly and and higher time frames don't show the divergence but do show that a cool down is needed to at least the two local support levels shown on the 15 minute PINK support lines. Volume is your friend to find which one we bounce on so stay glued to it when we approach them.
Bitfinex 15 minute indicators
Bitfinex Hourly
Bitfinex 4 hour
I am expecting a cool down and then a continuance upward. One thing to note is the volume levels have remained on par with the rally as far as the CMF is concerned. We are seeing heavy buying pressure still but do show a minor weakness in strength. I never under estimate ₿itcoin though. 27k by Near Years

AUDUSD TO BREAK RESISTANCEAUDUSD has reached both of this weeks targets while still holding a fair amount of momentum.Once again we have reached our familiar reversal zone that showed SUPPORT in early November then Resistance in late November and Early December. According to our MACD indicators we can expect a bullish divergence allowing the price to break through our targeted resistance level and rally up towards our new at around 0.76400.
