LTHM Falling Wedge Breakout to $30!Hey Traders,'
As you can see on the 1D chart of LTHM, we have experienced lower lows and higher lows, symptoms of a falling wedge. The target out of this falling wedge would be $30-31. However, I would keep a close eye on the golden pocket level and potentially start taking profits at $28. The weekly MACD is also showing signs of reversal to the green area. We additionally have a Bullish Divergence to top this off, the price is descending while the momentum oscillator (RSI) is ascending! In the very rare case we breakdown the target would be $13-15.
Safe trading,
-Pulkanator
Macdivergence

API3 Will Break Any Day Now!Hello traders,
As you can see on the daily chart of API3, the price performance has been in a downtrend recently however the Momentum Oscillator (RSI) is showing a bullish divergence by presenting us with lower lows! The weekly MACD is also revealing a possible divergence to the green, I see a very low likely hood of it continuing to be red mainly due to the fact MACD's come in swings of 3, which we have already experienced.
Safe trading,
-Pulkanator

Bearish Pennant forming on Shiba, time to enter a short!Hey Traders,
As you can see on the 4HR Chart of SHIBUSDT, the price action has formed a nice symmetrical triangle/ bearish pennant. I strongly believe that this will break down to the downside mainly because of the MACD. In the rare case Shiba breaks out the price target is 0.000027 (+27%). My price target however for the breakdown is 0.000017 (-18%). Anyways, this coin is shit also because I have to memorize how many zeros there are.
Safe trading,
-Pulkanator

Short $NIO $29.30Short $NIO $29.30. Falling channel. Downtrend will continue in my opinion. Price was rejected at 200 SMA early December 2021. Made lower lows since then. Recently Tried to break above $34 area but failed to maintain the momentum. Soon will test $27 area for support. Any further sell off in this name, going to push the price down my short target of $22 area.

SAND, PREDICTED CORRECTION !
Look at the Bitcoin please:
------
Due to the resistance that the both bitcoin & sand have, my prediction may come true...
------
*Futures setup*
-Safer entry point (for short): after breaking the bullish trend.
-Target: (3.46) - (3.27) - (2.92) - (2.86)
-Stop limit: 4H candle confirmation over the highlighted red resistance.
------
*Note: Trading in the current situation, carries a high range of risk!
Take care >_-

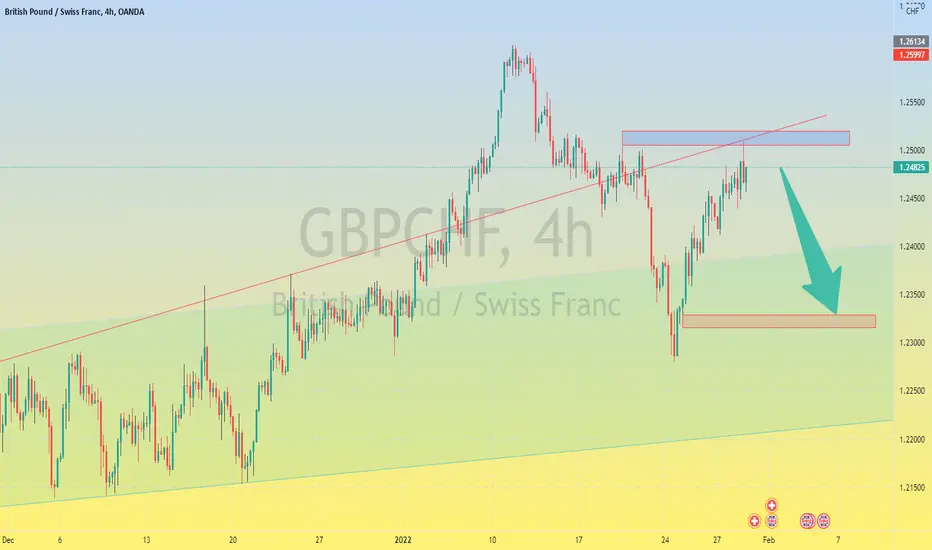
GBPCHF WAITING FOR DOWNTREND CONFIRMATION✅Price has bounced off 61.8 retracement level and ascending trendline. RSI & MACD bearish divergence suggests a bearish move towards the highlighted support.
Breaking the support and holding below it will shift the trend to bearish and the price could rally down to break the ascending lower trendline.
A break above the resistance will resume the uptrend towards 1.260 initially.
An introduction to the MACD indicatorHere is my quick and dirty introduction/explanation of what the Moving Average Convergence Divergence (MACD) indicator………… indicates.
The Moving Average Convergence Divergence (MACD) is a trend following momentum indicator that follows the intimate relationship between a 12-Period EMA and a 26-Period EMA on a price chart in whatever timeframe you are in.
The MACD indicator is made up of 6 parts, the MACD Line, the Signal Line, the Histogram, the 0.00 Base Line, the Positive Zone and the Negative Zone.
As default, the MACD Line is calculated by subtracting the value of a 26-Period EMA from the value of a 12-Period EMA on your chart to give you your MACD Line value. The MACD indicator will give a MACD Line value in whatever timeframe you are in.
The Signal Line is a 9-Period EMA of the MACD Line and is used with the MACD Line to generate/trigger Buy and Sell Signals. If the MACD Line crosses ABOVE the Signal Line, that is considered a Buy Signal. If the MACD Line crosses BELOW the Signal Line, that is considered a Sell Signal. Note that Buy and Sell Signals can be generated in both the Positive and Negative Zones
The Histogram is a graphical representation of the distance between the MACD Line and the Signal Line (9-Period EMA).
Green Histograms will appear above the 0.00 Base Line when the MACD Line crosses ABOVE the Signal Line. The Green Histograms will Increase in size the further the MACD Line moves upwards & away from its Signal Line. The Green Histogram will also lighten in colour if the MACD Line fails to move higher to create a higher Green Histogram Bar.
Red Histograms will appear below the 0.00 Base Line when the MACD Line crosses below the Signal Line. The Red Histograms will increase in size the further the MACD Line moves downwards & away from its Signal Line. The Red Histogram will also lighten in colour if the MACD Line fails to move lower to create a lower Red Histogram Bar.
The Positive Zone is the area ABOVE the 0.00 Base Line. If the MACD Line crosses above the 0.00 Base Line, this means that a 12-Period EMA is ABOVE a 26-Period EMA on your price chart in whatever timeframe you are in. So to reiterate, the MACD Line will be ABOVE the 0.00 Base Line when a 12-Period EMA is ABOVE a 26-Period EMA on your price chart.
The Negative Zone is the area BELOW the 0.00 Base Line. If the MACD Line crosses below the 0.00 Base Line, this means that a 12-Period EMA is BELOW a 26-Period EMA on your price chart in whatever timeframe you are in. So to reiterate, the MACD Line will be BELOW the 0.00 Base Line when a 12-Period EMA is BELOW a 26-Period EMA on your price chart.
Note that the MACD indicator has no upper limit in the Positive Zone and no lower limit in the Negative Zone.
The MACD indicator can also be used to show Divergence between the Price and the MACD Line. In a Bullish scenario, if the Price is making Lower Lows and the MACD Line is making Higher Lows then this is potentially Bullish.
For a Bearish scenario, if the Price is making Higher Highs and the MACD Line is making Lower Highs then this is potentially Bearish.
The MACD indicator can also be used to show Hidden Divergence between the Price and the Histogram. In a Bullish scenario, if the Price is making Higher Lows but the Histogram is making Lower Lows then this is potentially Bullish. For a Bearish scenario, if the Price is making Lower Highs but the Histogram is making Higher Highs then this is potentially Bearish.
The MACD can sometimes produce false positive as can be seen here where we have Bullish Divergence with the Price Converging with the MACD Line but no real breakout happened.
Note that the MACD Line and Signal Line will be in line with the current Candle Wick in whatever timeframe you are in.
The MACD indicator is a lagging indicator but it also has the power to be predictive especially with potential upcoming Buy and Sell signals, divergence and when used with other indicators like Volume, the Ichimoku Cloud, Bollinger Bands, MAs or EMAs, RSI, ADX DI to name but a few as these can help complement the MACD signals to help get a much clearer picture as to what is going on and what may happen on your chart in whatever timeframe you are in, because there is a lot of BS, FUD, FOMO and utter crap out there so a little clarity is always helpful ;-)
For me the MACD is a very useful indicator with my trading, so I hope you have found this quick and dirty MACD educational post helpful. Happy trading.
Notes:
MACD Line = 26-Period EMA Value - 12-Period EMA Value = MACD Line Value
Signal Line = 9-Period EMA of the MACD Line. Used with the MACD Line to trigger Buy and Sell Signals
Histogram = Distance between the MACD Line and the Signal Line
0.00 Base Line = Crossover point to the Positive Zone and/or Negative Zone
Positive Zone = a 12-Period EMA is ABOVE a 26-Period EMA on your price chart
Negative Zone = a 12-Period EMA is BELOW a 26-Period EMA on your price chart
EMA = Exponential Moving Average.

Short ROKU CMP $180.41Short ROKU CMP $180.41. Price continue to fall for $ROKU. After my recent short target $205 area achieved, I think stock has more room to go down and is heading towards $160 area where it started it's major run. MACD turned negative and it's trading below all the major moving averages. Short target of $160 area in coming days. Various support and resistance are marked in cyan color lines. Setup is invalid if it trades above 20 SMA price level.

Bullish Divergence?bullish divergence spotted.
MACD low getting higher. while BTC overall structure still bearish.
pending for a breakout above 45K. (bull will only take over the control after btc above 45k.)
DYODD

BTCUSDT long position in 4h time frameObviously we are in a trading range right now and the price is a little above the support line. However, the sellers are still very active and the supply is overpowering the demand but if the sides change it's safe to say we can open a long position. Also, we see positive divergence in 4h and 1h time frames on MACD and RSI indicators, yet opening any long positions still have highly risky due to lower market cap. looking forward to hear your opinions.

Bitcoin DivergenceHello everyone
Before we start a discussion, it is my pleasure to read your opinion on this post's comment section and support this idea with your likes if you enjoyed it !
BTCUSDT :
bitcoin was printing a descending wedge and meanwhile, a divergence between the price and MACD was seen.
the price reacted to the very important support zone and then, braked the descending wedge pattern.
A short term rising trend is possible.
I determine the SL and TP for a good R/R ratio.
please remember any analysis can be failed. so, manage your risk and respect your stop loss.

How to spot and use MACD DivergencesOscillators
Oscillators are any bits of information or data moving back and forth between two points. It is usually used as a signal for a buy or a sell on either side of the range it is moving in. The Relative Strength index which you might hear of is an example of an oscillator, however I will not be going into detail about it as we do not personally do not use it for my trading. When there is a change in momentum, this often signals weakness in a trend. The indicators are designed to signal a possible trend reversal.
The only oscillator we use in our trading is the MACD. Moving Average Convergence Divergence. Feel free to look into other indicators, however, we believe that the MACD has been our favourite to use.
DIVERGENCE
Divergence is simply when we will be looking at the difference in price action against an indicator such as MACD, RSI, Stochastic.
The simplest way to put it, when the price is making higher highs the indicator should also be making higher highs, and lower lows then vice versa. If the price is making higher highs but the indicator is not, then the two are diverting from each other and we have divergence. This is a great sign for a weakening trend and a potential shift in momentum.
The two types include regular and hidden.
Regular divergence
When the price is making lower lows (LL), and the oscillator is making higher lows (HL), then we have what we call regular bullish divergence which usually appears at the end of a downtrend.
If the price makes a higher high (HH) but the oscillator makes a lower high (LH), then we have regular bearish divergence. This usually occurs at the end of an uptrend.
Hidden Divergence
Divergence does not necessarily have to show when the trend will reverse, it can show trend continuation, and since we try to avoid trading against the trend this can be of great help.
When the price makes a higher high, but the oscillator makes a lower low, we have what we call hidden bullish divergence.
When the price goes to make a lower high but the oscillator makes a higher high, this is what we call hidden bearish divergence.
Always remember that in conjunction with these signals, we need other signs in order for us to enter the trade. We cannot solely base our analysis on oscillator divergence, otherwise we can find ourselves on the wrong side of the trade.
Wait for the crossovers of the indicators to be sure, this can happen after the price has begun to move, however it can be an assurance that the divergence observed is correct.
Always remember if the market is moving sideways, there are no clear indications of divergence so do not force it. Always connect the latest in the price action, meaning if the price is bullish and is retracing, you are looking at higher highs. Focus on the highs and lows of the indicators and ignore any small minor movements in between. Wherever lines are drawn on the price, they have to line up with the oscillator and that is where the line will also have to be drawn, everything has to line up.

NFLX Ending Week Above $600Based on these technical indicators, I see Netflix ending the week above $600 per share. MACD shows growing bullish divergence while D+ also shows growing bullish divergence as indicated by the green shadow. The green outline means that is below 40 RSI. Guth 3x Confirm also indicates a buy signal. It has been a volatile market but I personally believe it is a good time to increase your position ahead of earnings. As an options swing trader I plan on buying OTM calls that will expire this week.

Bitcoin channel breakoutHello everyone
Before we start a discussion, it is my pleasure to read your opinion on this post's comment section and support this idea with your likes if you enjoyed it !
BTC moved in the ascending channel. the price pattern looked like an ending channel and I waited for downside breakout.
Also we see a divergence between the price and MACD. that is another proof for expected downside movement.
the price of Bitcoin breaks the parallel channel and I think it is a good opportunity to short BTC.
I want to support the idea with USDT.D analysis.
USDT dominance shows us investors inclination to change their coins to USDT, and vice versa.
As you can see, USDT dominance breaks the descending channel upside and I expect for further rise.
this means people change their coins to USDT.

CRO Bullish Breakout?Hello!
Am i seeing a Golden cross and a bullish breakout here from a descending triangle? , watch out and enter before its too late maybe.

XELA channels and divergencies asking for reversalRSI , MACD vs channel divergency , double bottom ... Seems like a step before trend reversal .

NZDJPYthis is my view for next week
we have a good divergence here ,
a price complex and trend line supp for that

SFPUSDT 15min Cup and Retest-- SFPUSDT 15min Cup Pattern
-- Breakout and Retest
-- RSI and MACD Hidden Divergence

update idea !!!we can update last analysis by this analyse.
support line extended and in this analysis use normal chart (non logarithmic).
2 rule can set. if break resistance line and pullback we can long on it and if resistance line worked the 5 wave confirmed and after break support line we can use short.
see macd and rsi resistance line !!!!!! can create a new bearish divergence.
%%%%%In the previous analysis you could get at least 7% in short.%%%%%%
wait for chart .

NIO could break the downtrend line upwards NIO has been in a decreasing trend since the beginning of the year, which has been confirmed with a couple of bounces. Nevertheless, chances are that the price of these shares break this trend line and starts increasing, having as a first objective attaining $49-50 per share.
The MACD indicator is right now pointing upwards, which means that the two lines that provide its signals could cross in the following trading sessions, providing a more clear buying signal to the market. Therefore, we will be waiting for a breakout signal.
On the other hand, whether the downtrend continues, a triangle figure could end up being created.

WISH - Moving in a descending wedge, possibly breaking up soon..Hi Guys, WISH is moving inside a falling wedge in the daily chart. Two third of this wedge is approximately end of January (blue box) where the price might realistically break the red trendline of resistence and reach the 6$.
If this will happen, next price targets will be the 9$ gap filling and mostly the 15$ level, which represent the target given by the height of the same descending wedge.
In addition to this, MACD on the daily chart is showing a huge bullish divergence which makes pretty realistic an inversion in the upcoming weeks.
Not a financial advice, just personal opinion. Do your own due diligence and good luck!

ADAUSDT 1d timeframe falling wedge continuation chart patternADAUSDT 1d timeframe,
falling continuation wedge chart pattern
macd positive reguler divergence
fibonacci 0.618 level

DCRUSDT Falling Wedge Pattern and Macd Positive DivergenceDCRUSDT Reversal Falling Wedge Pattern and Macd Reguler Positive Divergence
If you wanna scan candlestick patterns, harmonic patterns , chart patterns, divergences, indicators automatically visit the our website cryptopy.net
