HI-HO SILVER!THE PARABOLIC MOVE COMING IN GOLD AND SILVER WILL SCARE BOTH INVESTMENT ROOKIES AND VETERANS!
THERE WILL BE ANOTHER LARGE CORRECTION TO SCARE THE SMALL FISH AWAY AND REWARD THE PRIMARY DEALER BANKS WITH MORE CHEAP MONETARY METALS!
AFTER THIS, THEY WILL SOAR!
Macroeconomics

Consumer staples are the best of all possible worlds right nowSo we've got macroeconomic forces pulling in a couple different directions right now. One the one hand, the Fed is talking about pumping trillions of dollars more liquidity into the market, which should further inflate equity prices. On the other hand, with coronavirus cases continuing to rocket, we're starting to see economic data fall off a cliff. Consumer staples and metals are the natural havens.
Today, the University of Michigan measure of US consumer sentiment for July came in at 73.2 versus the consensus expectation of 79. This was the largest negative surprise on record, and it's going to have a big negative effect on the consumer discretionary sector. And what's bad for retail is also bad for banks, as CMBS delinquency reached 10.32%. We also got a large negative surprise on housing starts today, up only 2.1% vs. the 4.9% consensus expectation. Home building has been the one bright spot in the economy as Americans flee the cities for the suburbs, so this is a concerning deterioration in that market. The ECRI leading index has been flattening, and mobility is falling as scared consumers remain at home even in states that haven't reclosed. California's reclosure this week was a huge deal, since the state accounts for nearly 15% of US GDP.
Consumer confidence chart:
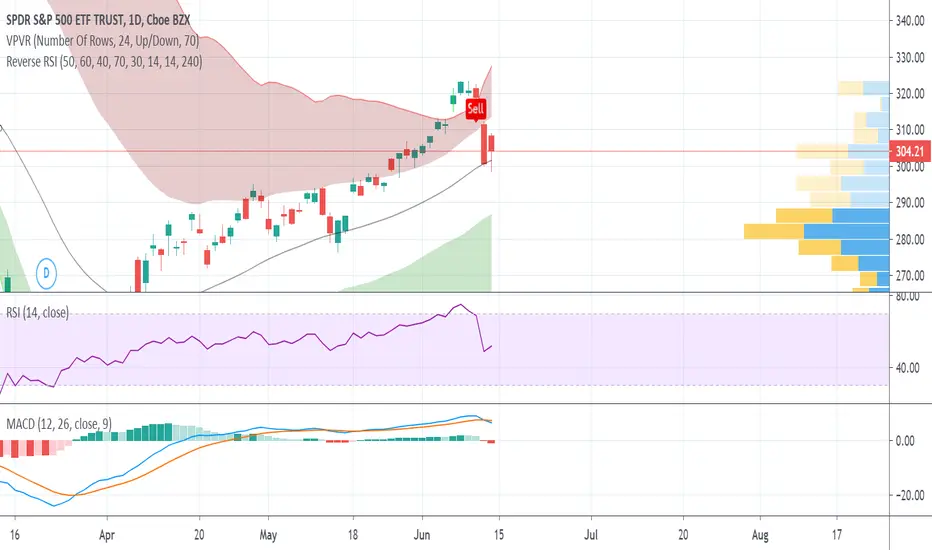
twitter.com
Mobility chart:
www.dallasfed.org
Meanwhile, the Fed's balance sheet grew this week for the first time in four weeks, which means that liquidity-- and the accompanying asset price inflation-- is on the upswing again. Congress is actively working on as much as $3.5 trillion in new stimulus, and Lael Brainard of the Federal Reserve is signaling that the Fed may get more aggressive about trying to hit its 2% inflation target, even to the point of "overshooting" that target to make up for years of weak inflation. (Current CPI is about 1.2%.)
See Brainard's remarks here:
www.federalreserve.gov
With economic data starting to sour, I don't really want to be in equities. But with more liquidity coming, I don't really want to be out of equities, either. My solution is to hide out in metals and consumer staples. A fall-off in mobility will be bad for nearly every sector of the economy, but it should be bullish for consumer staples and grocery store stocks, some of which report earnings in the next few weeks. That makes the consumer staples sector a natural safe haven as California recloses and frightened consumers stay home. Consumer staples also pay dividends, and they're a little more reasonably valued than technology, which is the other sector that might conceivably benefit from reclosing. As you can see on the chart, staples recently made a bullish trend line break (which I alerted before it happened), and they have continued to strengthen since.

HYPERINFLATION!PRIVATE INVESTORS DON'T WANT BONDS, CENTRAL BANKERS DON'T WANT INTEREST RATES TO RISE!


DISCONNECTION FROM REALITY!HOW CAN SILVER BE LOWER FROM GOLD'S PEAK THAN BOTH OF ITS SPECULATIVE MINING VEHICLES, SIL AND SILJ?
THIS IS A MASSIVELY BULLISH SIGNAL!

WAIT FOR BLOOD IN THE STREETS!WOULD YOU BUY CRYPTO AT THIS POINT IN TIME?
CONSIDER THE MACROECONOMIC CLIMATE, BITCOIN'S FUNDAMENTALS, THE PERFORMANCE OF CRYPTO TRUSTS!
A FRIEND RECENTLY INVESTED HIS LIFE SAVINGS, SAYING "THERE IS FUTURE POTENTIAL TO CRYPTO THAT PEOPLE DON'T REALIZE"!
WHAT POTENTIAL WOULD HE, A RETAIL INVESTOR, BE AWARE OF THAT THE MARKET IS NOT CURRENTLY PRICING IN?
WHEN HE SELLS, I WILL BE BUYING!

BULLISH COPPER?FOR COPPER TO TRULY RISE, IT MUST BREAK THE 2.886 RESISTANCE LEVEL!
IF NOT, THIS IS SIMPLY ANOTHER LOWER HIGH!


EPIC BEAR MARKET HAS BEGUN!I KNOW TOO MANY PEOPLE BUYING TECH STOCKS!
THIS BEAR MARKET WILL DOWNRIGHT SCARE KIDS MY AGE OUT OF STOCKS!

CRYPTO BLOOD IN THE STREETS IS COMING!I SEEM TO BE THE ONLY ONE UBER-BEARISH ON ALT-COINS!
ETH TRUST DOWN 70% IN 2 WEEKS!
GAPS AT THE BOTTOM!
I LOVE BLOCKCHAIN BUT TOO MANY HOPEFULS ARE STILL HOLDING THE BAG!
I WILL BE BUYING GOOD PROJECTS FROM THOSE WHO WERE TOO EARLY!

CHINA IS THE FUTURE!I HATE COMMUNISTS MORE THAN ANY POLITICAL GROUP ON EARTH! THEIR COUNTRIES ARE POOR, REGRESSIVE AND AUTHORITARIAN!
BUT EVEN IF CHINA WAS RULED BY TIME-TRAVELLING STALIN AND MAO, A GOLD-MONETIZED YUAN WOULD DESTROY THE DOLLAR!

EUR IS GARBAGE! BUT U$D IS RADIOACTIVE!SYMMETRICAL TRIANGLE WITHIN A DOWNTREND! DECADE LONG RISING CHANNEL!
TREND-LINE REJECTION!

SILVER HAS NEVER BEEN THIS CHEAP!THE LAST TIME SILVER WAS THIS CHEAP RELATIVE TO M2 WAS AT THE BEGINNING OF THE 2000s BULL RUN!
EVEN M2 FAILS TO TAKE INTO ACCOUNT THE ACTUAL EXPANSION OF THE CURRENCY SUPPLY, SO IN REALITY SILVER HAS NEVER BEEN THIS CHEAP!

BITCOIN IS GOING DOWN!WHALE ACTIVITY IS EXTREMELY SUSPICIOUS!
TRADER POSITIONING IS ALL-IN!
PRICE-VOLUME DIVERGENCE!

Seasonal weakness has likely arrived as MACD makes bearish crossSeasonal investors who follow the "Stock Trader's Almanac" approach to investing use June's first downward cross on the MACD indicator as their signal to exit the market until October. We got that all-important signal this week, which suggests that we have now entered the period of seasonal weakness. My experience is that there's money to be made by investing in July, August, and September, but it takes a different mindset, because the dips are a lot bigger than they are the rest of the year, so you have to wait a little longer before buying dips.
I think we'll see some mid-month doldrums here in June, as coronavirus case counts continue to rise. Arizona is facing a crisis because it's out of ventilators and ICU beds, and Twin Cities, MN and Dallas, TX are on the verge of a similar crisis. LA County expects to run out of beds in 2-4 weeks. The public pressure is all toward reopening, but I suspect that some of the big liberal cities will actually tighten distancing rules this month to slow the growth of new cases.
A bigger problem for the stock market is that we're probably headed toward some kind of reckoning for debt. Deferment periods have lulled us all into a false sense of security, but those deferments are now ending, and we're seeing rising numbers of defaults, layoffs, and bankruptcies. I wouldn't be surprised to see a housing market crash or a weakening of the jobs recovery in the coming months. Unfortunately I can't guess when it might hit.
In early July we will probably see a rally, as Congress considers another stimulus bill, movie theaters look to reopen, and the first vaccine human trials get started. We could see more volatility in August as the first trial results come in. There's probably about a 75% chance that one of the vaccine candidates passes in human trials, in which case the market could rally very strongly into the end of the year.
The next two years will then be a period of seasonal weakness, as the first couple years of a presidential term usually are. The market will also be reckoning with the lingering effects of high unemployment and a loss of consumer confidence and consumer demand.


CANADIAN LOONIE WEAKNESS!THE CANADIAN LOONIE WILL CONTINUE TO FALTER AGAINST WESTERN CURRENCIES, ALTHOUGH IT WILL BEGIN TO STRENGTHEN AGAINST THE U.S. DOLLAR!
HYPERINFLATION IS IN CANADA'S NEAR FUTURE!
