Dr copper potential more downside moveHello traders, lets take a look at copper which testing an important resistance area and see what can possibly happen and what are the consequences of possible bearish move in other markets like us equities.
first lets talk technical, price overall bearish Daily move in copper formed a standard #head_and_shoulder pattern in form of consolidation in downtrend move and as we know this chart pattern in the middle of a move showing continuation. As it can be seen price formed clear H&S pattern and now forming possible LH at key resistance area below Daily EMA and at the 4H timeframe 200 EMA. more importantly price failed to close above 3.80$ in the past 3 days.
Also we know that copper as one of the most important commodities is very sensitive on economic data, and since central banks are in raising interest rate campaign in order to take control inflation this can be interpreted as lower economic growth and as a result les demand for industrial commodities like copper which can bring prices lower.
so now obvious chart pattern and a valid downtrend, price testing important resistance area and failed to break above it and more importantly we have fundamental aspect inline with technical analysis which all together gives good odd to find a trigger to short.
Macroeconomics

7-10-23 Daily OutlookNot many if any definitory positions.
This week in the market is very important in determining the direction of the mid-term.
Current state of the market is ranging and thus trend following systems cannot be used.
SDCA in place for the long-term.

Qualitative Fundamental Analysis of US Economy Oct.2023The most important factor for the economy is the behaviour of GDP. Several economic indicators are tracked to determine the overall economic situation and GDP growth.
A technical recession is defined as 2 consecutive quarters of negative real GDP.
If GDP grows less than 3% on average for the year, the economy is not growing fast enough and this will lead to unemployment.
At its core, the Federal Reserve has dual mandate policy: price stability(2% inflation for a year) and maximum employment (max Unemployment rate 4%) .
CPI Inflation projection: inflation is forecast at 4.7% in 2023 and is expected to further slow down to 3.0% in 2024.
Actual CPI : 3.7 %
PCE Inflation projection: inflation to be 3.3 percent in 2023, 2.6 percent in 2024, and 2.2 percent in 2025, and the Federal Reserve expects a similar outlook of 3.3 percent, 2.5
Actual PCE : 3.5%
Unemployment rate projection: The unemployment rate reaches 4.1 percent by the end of 2023 and 4.7 percent by the end of 2024 before falling slightly, to 4.5 percent, in 2025.
Actual: 3,8%
GDP Growth projection: Real GDP increases by 1.5 percent in 2024 and by 2.4 percent in 2025.
Actual: 2,4%
Interest rates projection:The Fed now expects its benchmark federal funds rate to close out 2024 at an effective rate of 5.1%, which is higher than its June forecast of 4.6%
Interest rates: 5.5%
MONEY MARKET
Yields
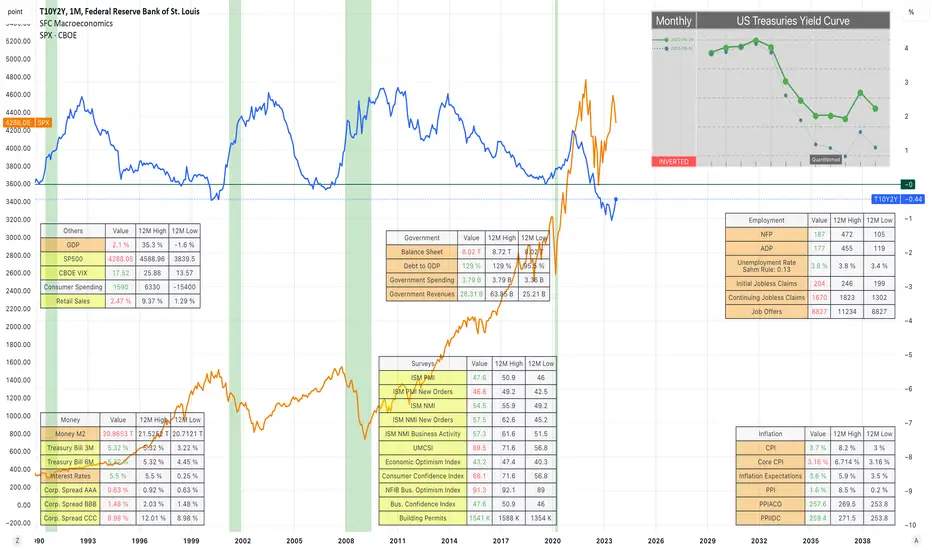
From the chart above we can see when the recession is coming. The 10Y-2Y has already fallen below 0 and we should prepare for a recession when it comes above 0.
The yield curve (all yields) is slightly inverted, but only because of the 20-year yields. The overall curve is normal, which means that investors are not worried about the future, at least for now and they invest more in long-term bonds.
According to the FED, we should expect a mild recession at the end of this year.
The SP500 seems to be consolidating for the next few months.
Corporate Bonds and Credit Spread
Spreads are relatively stable. They do not point to a recession.
Money Supply M2
The money supply is also stable, which means that the printer is not running. This is a good sign considering the banking crisis.
interest rates
The last time IR was so high was during the last recession in 2008. History could repeat itself. At the last FOMC meeting, the FED paused rates but said they would remain high. This could be exactly what happened in 2007. FED paused after aggressive hike and recession came.
SERVEYS
ISM PMI, NMI
The historical correlation between real GDP growth and the ISM PMI/NMI is 85%. PMI/NMI are leading indicators and they will predict how GDP will move. It is a short to long term prediction (within 12 months).
The reading continued to point to another albeit smaller deterioration in the manufacturing performance, as contractions in output and new orders softened. Meanwhile, sufficient stocks of inputs and finished items, alongside still subdued demand, led firms to reduce their purchasing activity sharply again and firms continued to work through inventories in lieu of expanding their input buying, which contributed to a further improvement in supplier performance.
Consumer Sentiment Index(UMCSI)
The level of consumer confidence in stability and future prospects can be used to understand the overall trend in the economy.
Still, consumers are unsure about the trajectory of the economy given multiple sources of uncertainty, for example over the possible shutdown of the federal government and labor disputes in the auto industry.
From a technical perspective the chart looks very suspicious. Like bullback before the new swing. Will see.
Building Permits
The jump in permits suggested that new construction continues to thrive, driven by a shortage of homes available in the market, despite the dampening effect of rising mortgage rates on housing demand.
NFIB Business optimism index
Twenty-three percent of small business owners reported that inflation was their single most important business problem, up two points from last month. Also, the number of small business owners expecting better business conditions over the next six months declined (seven points from July to a net negative 37%). “With small business owners’ views about future sales growth and business conditions discouraging, owners want to hire and make money now from strong consumer spending,” said NFIB Chief Economist Bill Dunkelberg. “Inflation and the worker shortage continue to be the biggest obstacles for Main Street.
Overall the business is not optimistic for the near future.
Leading Economic Index
The Leading Economic Index provides an early indication of significant turning points in the business cycle and where the economy is heading in the near term.
The US LEI continues to signal a recession. Combined with the yield curves, it looks like a recession could be coming very soon.
INFLATION
Total Inflation = 30% CPI (demand) + 40% PCE(supply) + 30% other factors)
CPI
The FED's target may be 2%, but the reality is that inflation is between 2-4%. Inflation has risen again in recent months and current oil prices suggest that it will remain high.
Investors are worried about future prices. The same thing happened in the 80s. The FED does not want the same to happen today, which is why they have been so hawkish recently.
Core CPI
This projection is very scary, but if the economy goes crazy, it can happen, just like in the 80s. I am not predicting that core CPI will rise that much, just pointing out the similarity.
PCE Inflation
The US personal consumption expenditure price index rose 3.5% year-on-year in August 2023, the most in four months, after an upwardly revised 3.4% rise in July and in line with market expectations.
PPI / Core PPI
The producer price inflation in the United States accelerated to 1.6% year-on-year in August 2023. This is the second consecutive month.
GOVERNMENT
Balance sheet
The balance sheet is falling, which is deflationary. On the one hand, this is good and gives us an indication that inflation should be contained, but on the other hand, it is a sign of recession.
[b ]Cyclical Commodities
Trade weighted US Dollar Index
Rising trade indices are actually deflationary for the economy.
Commodities
They stable prices do not give us a clear picture of the near future.
Stocks
The benchmark indices are falling. The failed to make new HH, suggesting that the will consolidate or fall.
Sometimes they are seen as a leading indicator of future GDP and recession.
Summery
The current pause in interest rates, with the hawkish narrative that rates will stay high for a long time, could be the second phase of the business cycle. The next one is recession.
Yield curves have also suggested that the recession is not as far away as we think.
The surveys are relatively stable, but the overall picture is not so optimistic.
Inflation is on the rise again, which may lead the FED to be more aggressive. They have said many times that they would rather have a recession than a price explosion. They have even warned about a mild recession, how mild we will see.
The unemployment rate is still below 4%, but in recent months it has risen from 3.5% to 3.8%. Rising unemployment is a sign of recession.
Stock indices have risen in recent months, but future expectations of a new recession, combined with high interest rates and business optimism, are bearish factors for the stock market.
Dollar Bullish Momentum Continues Despite Global Challenges
The global economy is facing a number of challenges, including rising inflation, slowing growth, and geopolitical tensions. These challenges have led some economists to warn of a potential stagflation environment, characterized by high inflation and low economic growth. Overall, the dollar had a few battles with other intermarket factors that tried to halt its bullish momentum, which has been ongoing for months.
The euro had many indications last week that it plans to strengthen its currency by increasing interest rates in the near future. Germany, which is the eurozone's largest economy, supported this with its ZEW economic sentiment, which came back better than expected, causing short-term weakness during the New York session. Fuel was then thrown on the fire, making the dollar aggressively bullish with the statements made during the ECB press conference. In addition, the unemployment claims and retail sales being better than expected fueled the dollar's ongoing bullish momentum.
With the upcoming Fed rate, where do you think is the next destination for the dollar?

EURAUD: When China's news make Aussie and other Asians strong! My dear friends,
Thursday, 14 September, 2023 and ECB interest rate decision is on the way. We'll wait for confirmations.
But before ECB meeting, series of several bad economical news over China's financial stability were published. Market reacted to them rationally. Suddenly the red dragon start to regain it's reputation. Good news for China means stronger Aussie, Kiwi and Yen!
A personal belief: Markets are not optimist to China's long-term relations with the free world and it makes them avoid longer term investing on Asian currencies. We could expect a more bearish weeks for them in next months, however, we don't hold that much so a mid-term bearish correction could be a opportunity for us!
Regarding the weekly chart, some more corrective weekly candles are expected.
snapshot
Considering the daily timeframe, market structure has changed so there could be a stop hunt around 1.68950
snapshot
The horizontal level could be a high probable and good R-to-R entry point.
Levels are based on: Order-blocks, Pivot Points, Support and resistance and Reversal points.

Navigating a Prolonged Correctional WaveThough I long term bullish on Bitcoin, my opinion remains unchanged from my former analysis in 2022. In which I believe the crypto market remains in a prolonged correctional wave.
Since the initial analysis, interest rates have risen dramatically, mid/low cap equities have continued to bleed, and I myself believe crypto has yet to enter the next bull cycle.
Looking a bit deeper into the situation we see a lack of volatility and liquidity. Often resulting in similar PA from 2018 which was commonly known as the bart market.
Slow and sudden PA is mostly due to lack of liquidity and market participation. Pair this current environment with the regulatory pressure coming into the space, I remain unsold on the idea that the Bitcoin correction is over.
Though I believe a some upward movement is possible due to a major event such as an ETF approval, I believe any hype will remain temporary until global macros improve.
So until then, I will leave these levels to react upon.
In summary:
Long-Term Bullish on Bitcoin: My long-term bullish stance on Bitcoin remains consistent with my assessment from 2022. I maintain the view that the crypto market is still undergoing a prolonged correctional phase.
Changing Market Dynamics: Since my initial analysis, we have witnessed a significant shift in market dynamics. Notably, interest rates have surged, and mid/low cap equities continue to face challenges. These factors have contributed to a sentiment that the crypto market has yet to embark on its next major bull cycle.
Volatility and Liquidity Concerns: Diving deeper into the market's current state, we encounter concerns surrounding volatility and liquidity. The market's price action often mirrors the patterns seen during the 2018 'bart market.' This can be largely attributed to a lack of liquidity and reduced market participation. Furthermore, the regulatory pressures looming over the crypto space further cast a shadow of uncertainty.
Temporary Potential with ETF Approval: While I acknowledge the possibility of a short-term price surge due to a major event such as an ETF approval, it is important to exercise caution. Any resulting hype may prove to be ephemeral, contingent upon broader improvements in global macro conditions.
A Waiting Game: In light of these factors, I remain patient and observant. Until we witness a more substantial shift in market dynamics and improved global macros, any long term trade will be exercised with caution.

China doomEverybody is so depressed about China that it is time to look for the bottom...
All big players have sold China, the state is starting to take some economic measures

Macro Economics- BRICS Oil Nations, GDPHi Traders, Investors and Speculators of Charts 📈💰
The 15th BRICS summit was held in South Africa from August 22-24, 2023. There have been some important updates that concluded from this summit and if you're an active trader / speculator in the Forex, stocks or commodities market, you NEED to know about this.
The BRICS countries (Brazil, Russia, India, China, and South Africa) now control 30% of the entire global economy. This is up from 17% in 2000 and 23% in 2010 . The BRICS countries are also home to 42% of the world's population.
Incase you missed the previous article, find it here:
BRICS Total GDP With New Members:
B razil: $2.08 trillion
R ussia: $2.06 trillion
I ndia: $3.74 trillion
C hina: $19.37 trillion
S outh Africa: $399 billion
Saudi Arabia: $1.06 trillion
Argentina: $641 billion
UAE: $499 billion
Egypt: $387 billion
Iran: $367 billion
Ethiopia: $156 billion
BRICS will now control 30% of the global economy.
If you're invested in any BRICS related stocks or Forex markets, this concerns you!
The summit outcomes are expected to lead to a weaker US dollar in the near term. This means that currencies against the dollar will strengthen. This is because the BRICS countries are collectively a major source of demand for commodities, such as oil and gold.
The outcomes of this summit lead to proposed increased investment in the BRICS economies. This could lead to higher demand for commodities, which would put upward pressure on commodity prices and the value of currencies of commodity-exporting countries, such as the Brazilian real and the Russian ruble. This would make the US dollar less attractive to investors, which could lead to a weaker dollar.
_______________________
📢 Show us some LOVE 🧡 Follow for daily updates and trade ideas on Crypto , Stocks , Forex and Commodities 💎
We thank you for your support !
CryptoCheck

US500 Short-Med Term OutlookUS500 Futures sitting in middle of critical Support/Resistance levels & 23.6%-38.2% Fib Retrace.
Key Global Economic data, BRICS Summit, Jackson Hole Symposium, & US Earnings (NVDA) ahead.
What a crazy/volatile time to be trading in Global Markets.

Any Idea what this chart might mean and an interpretation?Here's a monthly chart of the ES1-ES2 (difference between the two). I'm just wondering if anyone has looked at this before and what it could possibly tell us about the market and economy in general.

Recession Timeframe Horizon Macro Monday (2)
Potential Recession Time Horizon
Below you will find a breakdown of how many months pass before a confirmed Economic Recession (shaded grey areas) after the yield curves first definitive turn back up towards the 0% level:
1) 13 Months (Dec 1978 – Jan 1980)
2) 9 Months (Nov 1980 – July 1981)
3) 16 Months (Mar 1989 – Jul 1990)
4) 12 Months (Mar 2000 – Mar 2001)
5) 22 Months (Feb 2006 – Dec 2007)
6) 6 Months (Aug 2019 – Mar 2020)
7) 4 Months so far (Mar 2023 - ????)
Average Time frame: 13 months (reasonable time horizon would be 6 – 18 months).
I consider the first definitive turn up towards the 0% level as no. 7 on the chart (March 2023). Since this date we have rolled over below the -1% level (see additional chart in comments). March 2023 appears similar to the bounce in Dec 1978 (No. 1 in the chart), it also rolled over to the lower sub -1% level. If we assumed a similar 13 month timeframe to recession commencement as in Dec 1978 of 13 months, which also aligns with our 13 month average above, we would be looking at April 2024 for a recession to commence. Interestingly 1978 - 1980 was a similar peak inflationary period known as the Great Inflation, a defining macroeconomic period of high inflation.
You might be wondering, has a recession ever occurred in the month of April before? I personally thought this was a strange month but it has occurred in the past.
In April 1960 a recession commenced and lasted 10 months to February 1961. The 1960 recession was mainly a result of an over-tight monetary policy whereby the Federal Reserve raised interest rates from 1.75% in mid-1958 to 4% by the end of 1959 and maintained them at that level until June 1960. The Federal Reserves motive for raising interest rates and maintaining them was fear of high inflation (as in early 1951 inflation soared to +9.5%). Is it just me or is this all starting to sound a little too familiar?
If we wanted to cater for all time scenarios in the chart and noted above (no. 1 - 6) we could argue that the start of a recession is possible at the earliest within 6 months (Sept 2023) and at the latest 22 months (Jan 2025). Also, the month of April 2024 has some eerie similarities to two prior recessions, the 1978 and 1960 Recessions.
Lucky 13
Since World War 2 bear markets have on average taken about 13 months to reach their bottom and a further 26 months to recover their losses. Our average time before a recession would start is 13 months. It’s worth remembering that it could take an additional 13 months before a bottom is established and then 2 years or 26 months (2 x 13) of price action below the pre-recession price highs. Over 3 years is a long time to wait to recover losses. It would be pertinent to start deleveraging or increasing your hedge from the 6 month mark (Sept 2023 in this case) as subsequently the likelihood of a 3 year period below the Sept 2023 price levels increase as each month passes. For reference the S&P 500 index has fallen an average of 33% during bear markets over the avg. timeframe of 13 months to the bottom.
I actually find it very hard to accept that a recession is possible in the near term (within 6 - 12 months) and I would in fact argue against it, however I cannot explain away the data in the chart which speaks for itself and warrants at least some consideration & caution. Nothing is a guarantee and maybe this time it will be different, especially factoring in the amount of unprecedented liquidity added to the market in recent years, sticky inflation and financial supports provided to systemically important banks.
All the chart really indicates is a probable window for a recession to start some time between Sept 2023 – Jan 2025 and no guarantees.
The rule of 13 is worth remembering, simply from a timing perspective (before and during a recession) as it may help your timing. Based on two similar periods in history, the 1978 and 1960 recessions suggest the month of April 2024 may be a key date. Again, no guarantees.
It is also worth noting that for the last six recessions, on average, the announcement of when a recession started was up to 8 months after the fact…meaning we will have no direct indication when a recession starts, however the un-inversion of the yield curve (back above the 0% level) and a rise in unemployment will be the early tells, so these are worth paying attention too. We will keep you posted on any sudden changes in these metrics.
I hope the chart is helpful, provides one perspective of which there are many, and can help time and frame the situation we currently find ourselves in. NO GAURANTEES, just probable timeframes that may be worth paying attention too.
PUKA
List of Recessions:
1. COVID-19 Recession (February - April 2020)
2. The Great Recession of 2008 (December 2007 - June 2009)
3. The September 11 Recession (March - November 2001)
4. The Gulf War Recession (July 1990 - March 1991)
5. The Iran/Energy Crisis Recession (July 1981 - November 1982)
6. The Energy Crisis Recession (January - July 1980)
7. The Nixon Recession (December 1969 - November 1970)
8. The “Rolling Adjustment” Recession (April 1960 - February 1961)
9. The Eisenhower Recession (August 1957 - April 1958)
10. The Post-Korean War Recession (July 1953 - May 1954)

Analysis: DXY, gold, Treasury yieldsThe dollar index's quarterly chart is the most important as we heading into the second half of 2022.
Contrary to the popular belief, the quarterly chart suggests the DXY may bounce strongly in the coming six months, putting downward pressure on zero-yielding assets like gold.
Also watch out for a potential breakout in the U.S. 10-year Treasury yield and the bullish development in the US-German bond yield spread.

$XAU - NATH's Ahead ? LONG opportunities incoming for Gold *W (tf) (wave 5)
Wave 4 completed ?
Long Confirmation is anticipated with the red trendline resistance breakout and CHoCH's on smaller time
frames.
Current support trendline support on green and 20EMA on *W
TA speaking, Gold is sitting at a very sweet spot until the uptrend is invalidated
- Looking ahead for New All Time Highs for Gold in the midst of this troubleshooting
frenzy Economic Enviroment
US's Debt Ceiling Crisis and governments not trusting any longer The US Dollar
in their balance sheets.
Did you know that through-out 2022 and the on-going of 2023 amongst many countries,
Russia and China, two Global Superpowers,
have been stacking Gold up as their
State Reserves in heavy amounts !
Do they know something we don't !?
TRADE SAFE !
*** Note that this is not Financial Advice !
Please do your own research and consult your own Financial Advisor
before partaking on any trading activity based alone in this idea

Is the Worst OVER? This is the differential of 10yr vs 1yr US bond which represents long term against short term yield on sovereign debt, and those you don't know, short term bonds are used by central banks to control interest rates(amazing uh? the FED does not actually print money) therefore they do use bonds as a tool to control interest rates which then controls the S&D of capital.
As you can see, we are back at a differential which is extremely low, back to energy crisis levels. However, we seem to be already at very low levels, does that mean THE WORST HAS COME? What is going to happen to the stock market?
A very quick and personal thought to sum everything up as I do not consider myself an expert macroeconomist: the market is efficient, meaning that the current price on every single security is traded at all the current public information that is available and if something keeps going up, it means that expectation are in favor of it moving higher.
Hope that explains what I wanted to say,
Feel free to ask question, be safe!

EUR/USD - Resistances to Observe- With Europe entering in to Recession as a cause of
two consecutive negative quarters,
a positive Price Action is a merely a relief rally that will be short lived..
Golden Zone is most definetely reachable taking into consideration
the negative Macro-Economics events for Europe .
Patience is a virtue .
TRADE SAFE
*** NOTE that this is not Financial Advice !
Please do your own research and consult your Financial Advisor
before partaking in any trading activity based solely on this idea

$DXY -Ballads of Dollar $- Monitoring The Dollar Index TVC:DXY and constantly keeping an eye on its Price Action packed with Stories to Tell ,
is very important in your Trading Journey.
TVC:DXY its ;
The best Strategy,
the best Signal
the best Indicator
Why ?
Because it's a Dollar Story !
As the phrase goes :
'Paper Rules the World'
And so it does,
to the average man working 9-5 having no aspiration to know the dark valleys of this World.
And so it does,
regarding us that are involved in Trading Financial Markets.
While the most valuable of fiat currencies out there is The Mighty Dirty Dollar to whom the whole Economic System is based upon,
it's a must to be diligent and vigilant over The Dollar Index's TVC:DXY
price action stories.
TRADE SAFE
*** This is not Financial Advice !
Please do your own research and consult your Financial Advisor
before partaking in any trading activity based solely on this idea

$DXY -Debt Ceiling Scenarios *2W
All Eyez on TVC:DXY !
The Fate of other Financial Markets is to be decided on X Date of Debt Ceiling
Important Candlesticks prints on *2W and *W
Dollar Index seems to been having stuck between the range of
100.8 - 105.9
so far speaking of 2023's Price Action
However, with the incoming decision of Debt Ceiling this range
can very well be violated on it's borders ;
wether to the downside or upside that has yet to be seen :
- Bearish case'C' wave on ABC Correction)
- Bullish Case Impulsive Wave1 from 1-2-3-4-5 Elliot Waves)
Moreover,
With the breakout of Red Trendine Resistance, wave one is about to come
in to fruiton while yet needing to clear the last Lower High of the downtrend
to create a Change of Character of the Donwtrend.
Breaking above last LH and holding support (Wave B)
also confulences with the Golden Zone of Fibb taken from 114.7 High
to Lows of 100.8 (Wave A)
TRADE SAFE
***
Note that this is not Financial Advice !
Please do your own research and consult your Financial Advisor before partaking
any trading related activities based soly on this idea.

XAU/USD - Brics ThroryThe BRICS theory refers to an economic concept that emerged in the early 2000s, highlighting the growing influence and potential of five major emerging economies: Brazil, Russia, India, China, and South Africa. While the BRICS theory primarily focuses on these countries' collective impact on the global economy, it can also have implications for currency pairs like XAU/USD (Gold against US Dollar).
BRICS and Gold Demand:
The BRICS countries, particularly China and India, have been significant drivers of global gold demand. These nations have traditionally had a cultural affinity for gold as a store of value and a symbol of wealth.
Increased economic growth, rising middle-class populations, and expanding disposable incomes in the BRICS nations can contribute to a sustained demand for gold, potentially impacting the XAU/USD pair.
BRICS and US Dollar Dependency:
The BRICS nations have been exploring avenues to reduce their dependency on the US dollar for international trade and investments. This includes bilateral trade agreements, currency swaps, and initiatives like the BRICS New Development Bank.
If the BRICS countries succeed in reducing their reliance on the US dollar, it could lead to a decline in the US dollar's global dominance, potentially affecting the value of XAU/USD.
BRICS Economic Performance:
The economic performance and stability of the BRICS nations, individually and collectively, can influence investor sentiment and capital flows. Positive developments, such as robust economic growth, structural reforms, and political stability, may increase investor confidence in the BRICS economies and impact the XAU/USD pair.
Geopolitical Factors:
Geopolitical dynamics within the BRICS nations can also affect the XAU/USD pair. Political tensions, trade disputes, or changes in government policies may create volatility and impact gold prices and the value of the US dollar.
Diversification of Reserves:
The BRICS nations have been actively diversifying their foreign exchange reserves away from the US dollar. This diversification often involves increasing their holdings of gold, which can influence gold prices and, consequently, the XAU/USD pair.
It is important to note that while the BRICS theory provides a framework to understand the collective impact of these economies, each country has its unique economic, political, and monetary policies that can independently influence the XAU/USD pair. Therefore, conducting thorough analysis of individual country-specific factors is crucial when considering the BRICS theory's potential impact on XAU/USD trading.

Pound Weakness After U.K. InflationAs a young trader (21 years old), I see my trading style as more of an art than a science. I don't understand patterns, and I don't use technical analysis. I am a macro trader. I take information from various sources (WSJ, Twitter, Investing.com, Trading Economics, ect.), and my instincts kick in. I understand where assets should be moving on data releases.
The U.K. pound has been on a monster rally in the past month and change. Expectations for the U.S. Federal Reserve to pause rates, with some saying cuts later into the year, has simmered the red hot U.S. dollar. The Bank of England on the other hand, is expected to continue hiking rates in the midst of the highest inflation in recent memory. When yields rise on the U.K. Gilt, that makes their debt more attractive to foreign investors, making their currency appreciate against the greenback.
This past Wednesday morning, at 1:00AM (CST), U.K. inflation came in hotter than consensus estimates (8.7% actual versus 8.2% consensus), as did core inflation (6.8% actual versus 6.2% consensus). I would have expected the pound to appreciate against other currencies as their currency becomes more valuable as Gilt yields rise. The opposite happened, FXB has now fallen two consecutive days. I was building up my short position against the pound, but we must remember U.S. data sets can affect currencies across the globe. I exited my FXB position before the open today with the intention of hopping back in after said release.
Tomorrow (5/26), before the bell, we have U.K. retail sales MoM, U.S. durable goods orders MoM, core PCE prices MoM, personal spending MoM, and personal income MoM. There's no telling where any of this data will land us, especially the U.S. data, and that is why I closed out of my position today.
As far as I can see, we have no upcoming U.K data that would affect the pound. That is why I'm confident in this trade. The market will have time to digest what has transpired, and my hope is that it will come to the same conclusion that I have.
I have full intentions of getting back into my trade after this data is priced back into the stock. The most important lesson I've learned in my very young trading career is protecting your capital and letting the trades come to you, don't look for them, they will find you ;)
fyi - this is my first writing and any feedback is appreciated! Thanks

FXB downside after U.K. inflationAs a young trader (21 years old), I see my trading style as more of an art than a science. I don't understand patterns, and I don't use technical analysis. I am a macro trader. I take information from various sources (WSJ, Twitter, Investing.com, Trading Economics, ect.), and my instincts kick in. I understand where assets should be moving on data releases.
The U.K. pound has been on a monster rally in the past month and change. Expectations for the U.S. Federal Reserve to pause rates, with some saying cuts later into the year, has simmered the red hot U.S. dollar. The Bank of England on the other hand, is expected to continue hiking rates in the midst of the highest inflation in recent memory. When yields rise on the U.K. Gilt, that makes their debt more attractive to foreign investors, making their currency appreciate against the greenback.
This past Wednesday morning, at 1:00AM (CST), U.K. inflation came in hotter than consensus estimates (8.7% actual versus 8.2% consensus), as did core inflation (6.8% actual versus 6.2% consensus). I would have expected the pound to appreciate against other currencies as their currency becomes more valuable as Gilt yields rise. The opposite happened, FXB has now fallen two consecutive days. I was building up my short position against the pound, but we must remember U.S. data sets can affect currencies across the globe. I exited my FXB position before the open today with the intention of hopping back in after said release.
Tomorrow (5/26), before the bell, we have U.K. retail sales MoM, U.S. durable goods orders MoM, core PCE prices MoM, personal spending MoM, and personal income MoM. There's no telling where any of this data will land us, especially the U.S. data, and that is why I closed out of my position today.
As far as I can see, we have no upcoming U.K data that would affect the pound. That is why I'm confident in this trade. The market will have time to digest what has transpired, and my hope is that it will come to the same conclusion that I have.
I have full intentions of getting back into my trade after this data is priced back into the stock. The most important lesson I've learned in my very young trading career is protecting your capital and letting the trades come to you, don't look for them, they will find you ;)
fyi - this is my first writing and any feedback is appreciated! Thanks

COTI must hold $0.0694COTI is getting very close to the absolute bottom and it must bounce off $0.0694 (orange line).
If it does not then the next level is $0.0621 (red line)
We can see that COTI has been in a down trend for almost a month now, the MACRO has not been good for the market but COTI has been hit especially hard.
It has to bounce back.
So, in summary, if we break below $0.0694 then there is definitely more pain in the future.
If we manage to bounce off that level we should be able to reclaim $0.0800
Of course if we recover, the speed of the recovery will depend on the rest of the market, but if we break levels then we will dump fast.

US500 short ideaI know a lot of people want the stock market to crash and burn, and for the US economy to go into a recession.
Well here is my idea of what to look for in a short trade on the US500, ES, SPX etc.
But be warned, after this tax drain, if the US Congress lifts the debt ceiling, your shorts will be blown out of the water.
There will be more and more positive fiscal transfers as the level of interest rate as seen in the EFFR stays high and even goes a little higher.

US Dollar looks bearish stillAfter examining the Weekly chart for the DXY, it appears to me that the dollar flow is likely to continue downward for some time. Today's Advance GDP q/q reading is expected to be 2.0%, following the disappointing last reading of 2.6%. Additionally, the US Unemployment Claims are anticipated to be higher, at around 247K.
In my recent blog posts, I discuss the current tax drain in the US, which is an annual occurrence that typically results in assets such as the S&P decreasing in value. However, this year is different as we have reached the debt ceiling, and there is a possibility that things could become precarious if the spending limits are not raised. While there is certainly uncertainty in the US political process, some financial media outlets and fintwit users are discussing the possibility of recessions and de-dollarization. While I agree that there is a flight from the greenback, this trend could easily reverse if a political resolution is reached.
For each of the yen crosses that I have been following I'll wait to see where they are at when we get the news. I am not looking for trades before then.
Here are the levels I expect us to touch at some point in the near future.
USDJPY
GBPJPY
EURJPY
