#MAGIC/USDT#MAGIC
The price is moving within a descending channel on the 1-hour frame, adhering well to it, and is on its way to breaking strongly upwards and retesting it.
We have support from the lower boundary of the descending channel, at 0.1560.
We have a downtrend on the RSI indicator that is about to break and retest, supporting the upside.
There is a major support area in green at 0.1555, which represents a strong basis for the upside.
Don't forget a simple thing: ease and capital.
When you reach the first target, save some money and then change your stop-loss order to an entry order.
For inquiries, please leave a comment.
We have a trend to hold above the 100 Moving Average.
Entry price: 0.1600.
First target: 0.1640.
Second target: 0.1677.
Third target: 0.1719.
Don't forget a simple thing: ease and capital.
When you reach your first target, save some money and then change your stop-loss order to an entry order.
For inquiries, please leave a comment.
Thank you.
Magic

#MAGIC/USDT#MAGIC
The price is moving within a descending channel on the 1-hour frame, adhering well to it, and is on its way to breaking strongly upwards and retesting it.
We have support from the lower boundary of the descending channel, at 0.1474.
We have a downtrend on the RSI indicator that is about to break and retest, supporting the upside.
There is a major support area in green at 0.1700, which represents a strong basis for the upside.
Don't forget a simple thing: ease and capital.
When you reach the first target, save some money and then change your stop-loss order to an entry order.
For inquiries, please leave a comment.
We have a trend to hold above the 100 Moving Average.
Entry price: 0.1800.
First target: 0.1837.
Second target: 0.1900.
Third target: 0.1958.
Don't forget a simple thing: ease and capital.
When you reach your first target, save some money and then change your stop-loss order to an entry order.
For inquiries, please leave a comment.
Thank you.

MAGIC Buy/Long Setup (1D)On the chart, an important trigger line has been broken. A strong bullish CH (Change of Character) is also visible on the chart.
The green zone is a low-risk area for a rebuy.
Targets are marked on the chart.
A daily candle close below the invalidation level will invalidate this analysis.
For risk management, please don't forget stop loss and capital management
Comment if you have any questions
Thank You

#MAGIC/USDT Falling Wedge + Fib Confluence #MAGIC
The price is moving within a descending channel on the 1-hour frame, adhering well to it, and is on its way to breaking strongly upwards and retesting it.
We have support from the lower boundary of the descending channel at 0.1620.
We have a downtrend on the RSI indicator that is about to be broken and retested, supporting the upside.
There is a major support area in green at 0.1662, which represents a strong basis for the upside.
Don't forget a simple thing: ease and capital.
When you reach the first target, save some money and then change your stop-loss order to an entry order.
For inquiries, please leave a comment.
We have a trend to hold above the 100 Moving Average.
Entry price: 0.1780.
First target: 0.1827.
Second target: 0.1905.
Third target: 0.1962.
Don't forget a simple thing: ease and capital.
When you reach your first target, save some money and then change your stop-loss order to an entry order.
For inquiries, please leave a comment.
Thank you.

#MAGIC/USDT#MAGIC
The price is moving within a descending channel on the 1-hour frame, adhering well to it, and is on its way to breaking it strongly upwards and retesting it.
We have a bounce from the lower boundary of the descending channel, this support at 0.
We have a downtrend on the RSI indicator that is about to break and retest, supporting the upside.
There is a major support area in green at 0.1670, which represents a strong basis for the upside.
Don't forget a simple thing: ease and capital.
When you reach the first target, save some money and then change your stop-loss order to an entry order.
For inquiries, please leave a comment.
We have a trend to hold above the 100 Moving Average.
Entry price: 0.1700
First target: 0.1780
Second target: 0.1872
Third target: 0.1980
Don't forget a simple thing: ease and capital.
When you reach the first target, save some money and then change your stop-loss order to an entry order.
For inquiries, please leave a comment.
Thank you.

MAGICUSDT Forming Falling WedgeMAGICUSDT is currently showing a promising technical structure as it breaks out of a classic falling wedge pattern on the daily chart. This pattern is widely recognized for its bullish implications, especially when accompanied by increased volume, as seen in recent trading sessions. The falling wedge breakout suggests a potential reversal from the previous downtrend, with a projected gain of 90% to 100%+ in the coming weeks if momentum continues to build.
The Magic ecosystem, built around gaming and decentralized metaverse infrastructure, continues to attract investor interest due to its unique positioning in the Web3 and NFT sectors. With new partnerships and platform developments emerging, the fundamentals are aligning with the technicals for a potential significant rally. The current price action reflects a growing accumulation phase, indicating strong hands entering at lower levels.
As altcoin recovery gains traction across the broader market, MAGIC is positioned to benefit from both renewed retail attention and institutional curiosity. A breakout above the wedge resistance line can serve as a confirmation trigger for long entries, with a clear risk-to-reward setup. Traders should keep an eye on volume confirmation and short-term resistance levels for scaling out opportunities as the price climbs.
✅ Show your support by hitting the like button and
✅ Leaving a comment below! (What is You opinion about this Coin)
Your feedback and engagement keep me inspired to share more insightful market analysis with you!
#MAGIC broke above the resistance!#MAGIC
The price is moving within a descending channel on the 1-hour frame, adhering well to it, and is heading for a strong breakout and retest.
We have a bounce from the lower boundary of the descending channel. This support is at 0.1160.
We have a downtrend on the RSI indicator that is about to be broken and retested, supporting the upside.
There is a major support area in green at 0.1143, which represents a strong basis for the upside.
Don't forget a simple thing: ease and capital.
When you reach the first target, save some money and then change your stop-loss order to an entry order.
For inquiries, please leave a comment.
We have a trend to hold above the 100 Moving Average.
Entry price: 0.1181
First target: 0.1210
Second target: 0.1239
Third target: 0.1293
Don't forget a simple thing: ease and capital.
When you reach the first target, save some money and then change your stop-loss order to an entry order.
For inquiries, please leave a comment.
Thank you.

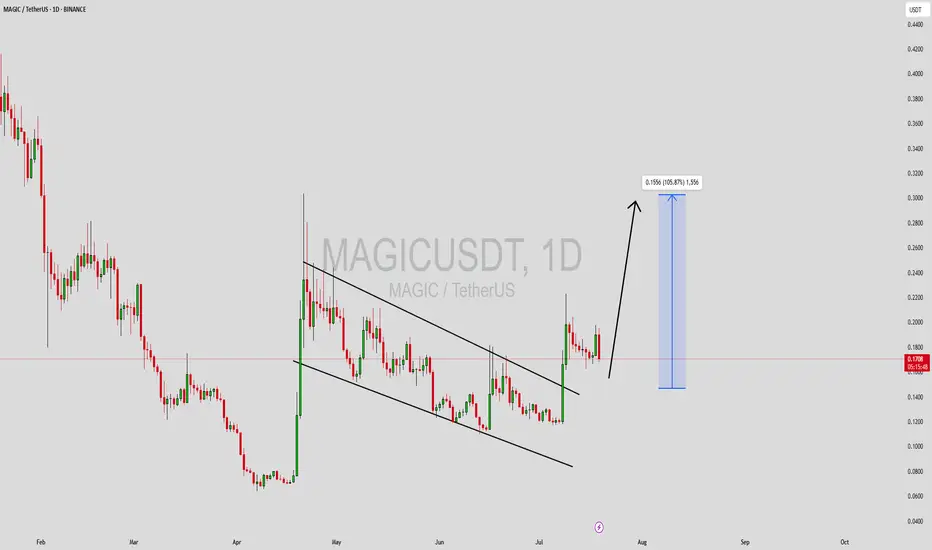
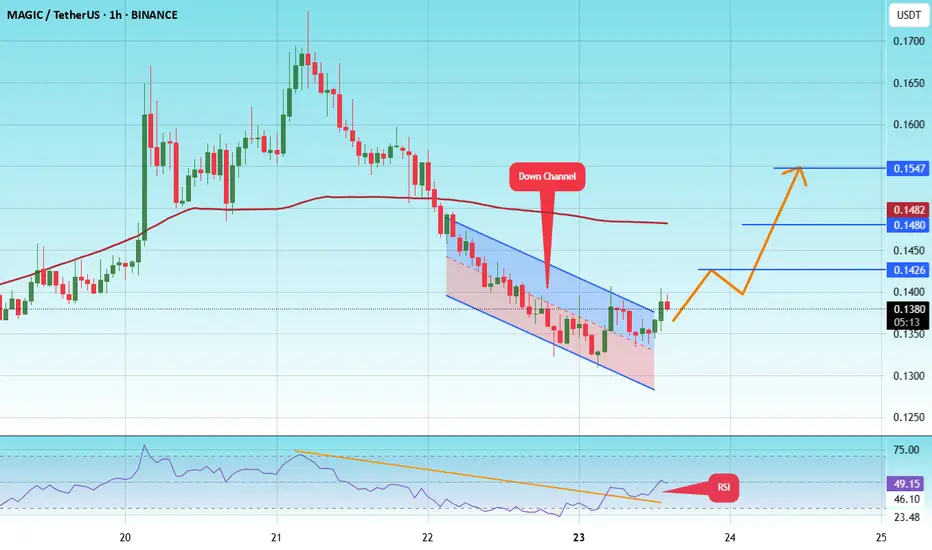
#MAGIC/USDT#MAGIC
The price is moving within a descending channel on the 1-hour frame and is expected to break and continue upward.
We have a trend to stabilize above the 100 moving average once again.
We have a downtrend on the RSI indicator that supports the upward move with a breakout.
We have a support area at the lower limit of the channel at 0.1312, acting as strong support from which the price can rebound.
Entry price: 0.1386
First target: 0.1426
Second target: 0.1480
Third target: 0.1547
#MAGIC/USDT#MAGIC
The price is moving within a descending channel on the 1-hour frame and is expected to break and continue upward.
We have a trend to stabilize above the 100 moving average once again.
We have a downtrend on the RSI indicator, which supports the upward move by breaking it upward.
We have a support area at the lower limit of the channel at 0.1533, acting as strong support from which the price can rebound.
Entry price: 0.1560
First target: 0.1611
Second target: 0.1667
Third target: 0.1750

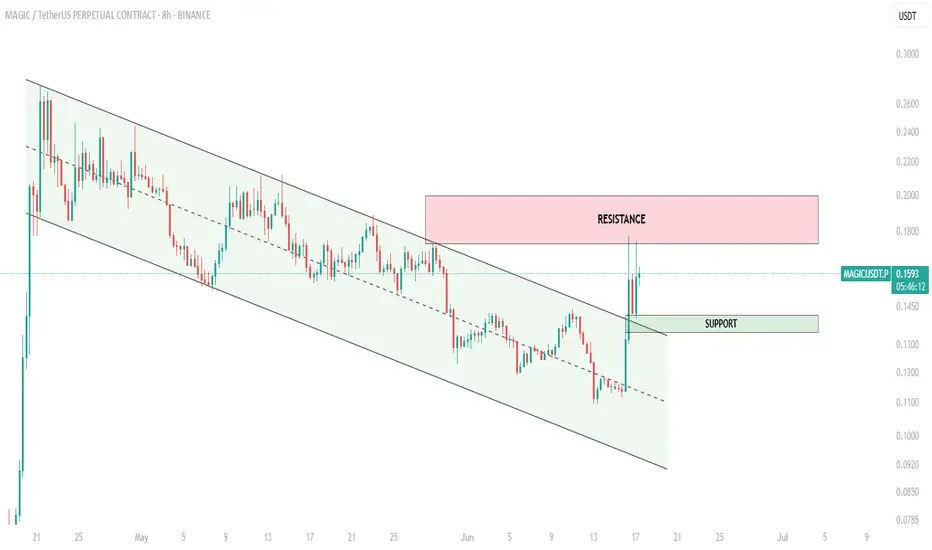
$MAGIC broke out!After weeks of grinding inside a falling channel, OMXTSE:MAGIC finally broke out with a sharp 20% move!
- Channel breakout confirmed
- Price reclaimed the support zone around $0.145
- Resistance zone ahead: $0.185–$0.20
Now it’s all about momentum. If bulls hold above the breakout area, we could see further continuation toward the upper resistance.
Trade smart — avoid FOMO. To ride the wave further, wait for a retest or clear strength above resistance.
This is how a clean technical structure plays out.
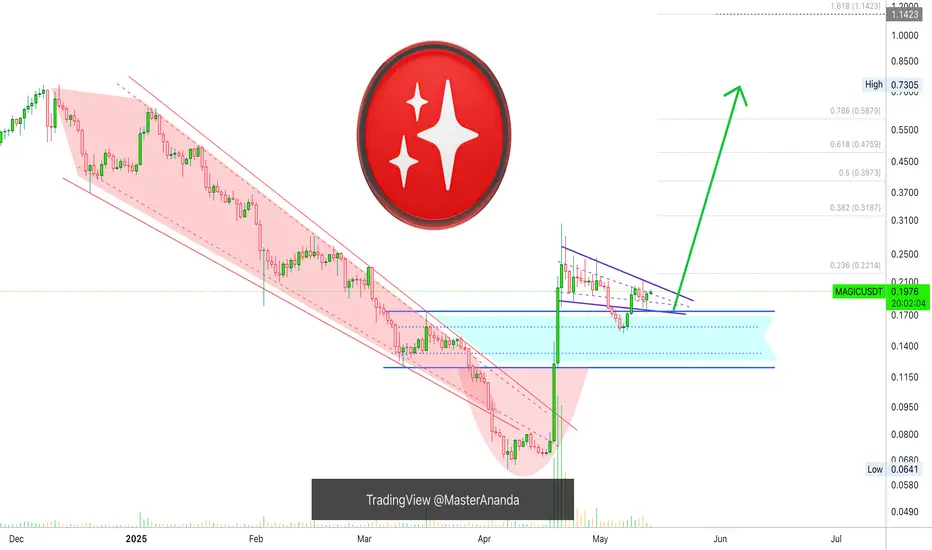
Magic: Higher Low, Falling Wedge & Bullish Continuation (1,046%)It seems like forever, but it is worth it because of the huge potential for growth.
The falling wedge pattern is a classic, we haven't been seeing that many recently and here we have one.
The initial breakout in April only lasted two weeks. MAGICUSDT peaked 21-April and started a long retrace, this retrace as always happens ends in a higher low. The candles formed a falling wedge pattern which can be used as a bullish reversal signal.
As the breakout from the pattern happens today, we can see trading volume going up. The highest volume since April. This high volume confirms this move being real and we can expect additional growth.
The following targets can be hit within 1-3 months. So these are huge numbers watch:
» $1.14 Gives 626%.
» $1.80 Gives 1,046%.
» $0.4759 Gives 203%.
These are great numbers, nice potential for growth. The last target can be hit short-term, within thirty days. It can be less.
Thank you for reading.
Your support is truly appreciated.
I hope we can continue to exchange for the long-term.
You give me attention, and I give you knowledge and great trading opportunities.
Namaste.

$MAGIC Trade Setup Alert!Bull flag breakout on OMXTSE:MAGIC — and we’re eyeing a beautiful move next! 👀📈
Price is testing breakout levels right now with solid bullish momentum.
🎯 Targets:
• TP1: $0.2037
• TP2: $0.2731
• TP3: $0.3996+
🛑 SL: $0.1547
📌 Entry Zone: Around $0.1710
Breakout traders, this is your cue!

MAGIC/USDT – From Consolidation to Explosion?🚀 MAGIC Bull Flag Formation – 200% Potential Incoming?! 👀🔥
Hey Traders! If you're all about high-conviction plays and real alpha, smash that 👍 and tap Follow for more setups that actually deliver! 💹💯
MAGIC is showing strong signs of a breakout from the descending channel on the 4H timeframe. After consolidating inside the channel for weeks, it has now approached the upper boundary and is testing it with bullish momentum supported by the EMA.
🟢 Long Position Activated
🔹 Breakout Confirmation waaiting
🔹 Volume Picking Up 📊
🔹 EMA Flip Incoming 🔄
🎯 Targets:
TP1: $0.25
TP2: $0.31
TP3: $0.39
TP4: $0.46+
🛑 Stop-loss: $0.151
📌 Leverage: 5x max
💡 A clean breakout from here can lead to a massive move—just like last time with a 273% pump! Don’t sleep on this one.

MAGIC Breaking Out – Next 100% Move on the Horizon?🚀 MAGIC Breakout Alert – 100% Potential Incoming?! 👀🔥
Hey Traders! If you're all about high-conviction plays and real alpha, smash that 👍 and tap Follow for more setups that actually deliver! 💹💯
MAGIC has finally broken out from a long-standing symmetrical triangle on the 4H chart — a classic bullish reversal pattern. After consolidating tightly, it's now flashing signs of a strong upward impulse! ⚡
📌 Entry: CMP ($0.200) and add more on dips up to $0.195
🎯 Targets: $0.25 / $0.29 / $0.33 / $0.39
🛑 Stoploss: Close below $0.176
⚙️ Leverage: 5x (Max)
✨ Previous breakout delivered over 100% gains — this one could be next!
Chart structure + volume looks perfect. If BTC stays calm, we might witness another explosive move in MAGIC.
💬 What are your thoughts on this setup? Drop your opinions below and don't forget to like & follow for more high-conviction trade setups! 💥

Magic Bullish Flag, Bullish Continuation = Multi-Year HighIt can crash just as it can move up. When I am saying it is going up this is only my belief.
When I looked at this chart I immediately thought that there will be a bullish breakout next because of the small rounded bottom and the bull flag, but, here is another scenario that can happen:
Then after I started to draw this scenario above seemed less likely.
» After a strong rise the retrace was very small.
» The support zone in blue matches the 17-March peak candle wick and close. It has been tested and it holds.
» There is no bearish volume nor any bearish momentum.
There is simply no need for the market to move lower and there are no signals pointing this way. So instead of down, a bullish breakout (continuation) comes next. Seems pretty obvious, the bull market has already been confirmed.
Thank you for reading.
Namaste.
magicIt has a resistance in the red box that if it can break, it can go to the orange area. If it can't, it will be directed towards the blue lines at the bottom.

MAGIC Rebuy Setup (4H)This analysis is an update of the analysis you see in the "Related publications" section
The price didn’t reach our red zone for entering a Sell/Short position, but the trend reversal outlook on MAGIC was correct.
We are now looking for a potential Buy/Long position near the support zone.
We will only enter a Buy/Long position if the price touches the green zone.
Targets are marked on the chart.
A daily candle close below the invalidation level will invalidate this analysis.
For risk management, please don't forget stop loss and capital management
When we reach the first target, save some profit and then change the stop to entry
Comment if you have any questions
Thank You

#MAGIC/USDT#MAGIC
The price is moving within a descending channel on the 1-hour frame and is expected to break and continue upward.
We have a trend to stabilize above the 100 moving average once again.
We have a downtrend on the RSI indicator that supports the upward move with a breakout.
We have a support area at the lower boundary of the channel at 0.2045, which acts as strong support from which the price can rebound.
Entry price: 0.2060
First target: 0.2097
Second target: 0.2131
Third target: 0.2180

MAGIC Sell/Short Setup (1D)The symbol MAGIC has started a strong momentum towards the Supply zone. Since there haven't been significant pullbacks during this powerful move, and the supply zone is fresh and untouched, a price rejection is expected. If the price reaches the supply zone, we anticipate a rejection and will be looking for sell/short positions within the supply zone.
Targets are marked on the chart.
A daily candle closing above the invalidation level will negate this outlook.
For risk management, please don't forget stop loss and capital management
When we reach the first target, save some profit and then change the stop to entry
Comment if you have any questions
Thank You

MAGICUSDT – Bullish Structure Holding, Watch the Blue BoxesMAGICUSDT has exploded higher, surging over 120% in volume and more than doubling in price. This isn’t a random spike—it’s a clear signal that buyers are taking control. The blue boxes on the chart mark the most reliable support zones to watch for entries into this momentum.
🔵 Why This Matters Now
• Extraordinary Volume—when a coin leads the pack in daily volume, smart money is involved. You don’t want to miss moves like this.
• Support Blueprint—the blue boxes are where price has historically found footing. If MAGICUSDT holds above these areas, it’s a green light for further upside.
🚀 How to Trade It
Long on Confirmed Support
Wait for price to dip into a blue box, then show strength with a clean bounce on lower time frames. Look for sturdy close‑over signals—this is your cue to join the trend.
Adaptive Risk Management
I won’t insist on a bullish view if the market proves otherwise. If MAGICUSDT breaks below these support zones with conviction, I’ll step aside or even flip bearish once confirmed. No forcing trades.
Real‑Time Validation
Always trade with confirmation—lower time frame breakouts, CDV alignment, and solid volume behind the move. That’s how you turn good setups into great results.
💬 Why You Can Trust These Levels
Every support zone I share has been battle‑tested in live markets, and my track record—visible on my profile—speaks for itself. Most traders chase noise; you’ll learn to trade with clarity, precision, and confidence instead.
Imagine capturing this wave of buying pressure right from the blue box, letting the market prove itself first, and then stepping in to lock in gains. That’s the edge that keeps my followers coming back—and winning—time after time.
Stay patient, watch those blue boxes, and trade what you see. Good trades start with discipline.
📌I keep my charts clean and simple because I believe clarity leads to better decisions.
📌My approach is built on years of experience and a solid track record. I don’t claim to know it all but I’m confident in my ability to spot high-probability setups.
📌If you would like to learn how to use the heatmap, cumulative volume delta and volume footprint techniques that I use below to determine very accurate demand regions, you can send me a private message. I help anyone who wants it completely free of charge.
🔑I have a long list of my proven technique below:
🎯 ZENUSDT.P: Patience & Profitability | %230 Reaction from the Sniper Entry
🐶 DOGEUSDT.P: Next Move
🎨 RENDERUSDT.P: Opportunity of the Month
💎 ETHUSDT.P: Where to Retrace
🟢 BNBUSDT.P: Potential Surge
📊 BTC Dominance: Reaction Zone
🌊 WAVESUSDT.P: Demand Zone Potential
🟣 UNIUSDT.P: Long-Term Trade
🔵 XRPUSDT.P: Entry Zones
🔗 LINKUSDT.P: Follow The River
📈 BTCUSDT.P: Two Key Demand Zones
🟩 POLUSDT: Bullish Momentum
🌟 PENDLEUSDT.P: Where Opportunity Meets Precision
🔥 BTCUSDT.P: Liquidation of Highly Leveraged Longs
🌊 SOLUSDT.P: SOL's Dip - Your Opportunity
🐸 1000PEPEUSDT.P: Prime Bounce Zone Unlocked
🚀 ETHUSDT.P: Set to Explode - Don't Miss This Game Changer
🤖 IQUSDT: Smart Plan
⚡️ PONDUSDT: A Trade Not Taken Is Better Than a Losing One
💼 STMXUSDT: 2 Buying Areas
🐢 TURBOUSDT: Buy Zones and Buyer Presence
🌍 ICPUSDT.P: Massive Upside Potential | Check the Trade Update For Seeing Results
🟠 IDEXUSDT: Spot Buy Area | %26 Profit if You Trade with MSB
📌 USUALUSDT: Buyers Are Active + %70 Profit in Total
🌟 FORTHUSDT: Sniper Entry +%26 Reaction
🐳 QKCUSDT: Sniper Entry +%57 Reaction
📊 BTC.D: Retest of Key Area Highly Likely
📊 XNOUSDT %80 Reaction with a Simple Blue Box!
📊 BELUSDT Amazing %120 Reaction!
I stopped adding to the list because it's kinda tiring to add 5-10 charts in every move but you can check my profile and see that it goes on..

MAGIC/USDT NEW INCREASEMAGIC/USDT known with name : Treasure
NEW INCREASE
Showing new volume upcoming which can get confirmed for new uptrend

Magic has formed a gigantic triangle than can lead it to $3BINANCE:MAGICUSDT is days away from breaking above this gigantic triangle pattern. It pumped back up quicker than most of the altcoins and I would definitely put this one in my altcoin basket. The price target for magic is $3 when the break out happens. Don't miss out!
It can go even higher than that but I would play it safe and probably cash out at $3 just to be safe.
