Emini / ES / SPY (4H) Backtest : 57% win rate across 21 tradesWinners = 12
Losers = 5
Breakevens = 4
Total Trades = 21
% Non Losers = 76%
% Winners = 57%
% Breakevens = 19%
% Losers = 24%
Win/Loss = 240%
Net R = 14.2
Avg R/Winner = 1.18
Avg R/trade = 0.68
Bad trades prevented due to presence of liquidity near SL= 14
Icons on the chart
Thumbs up : Trade was a win
Thumbs down : Trade was a loss
Circle with a cross : Trade was breakeven
Cross : Did not take the trade due to presence of liquidity (equal highs) behind the stop loss
Variables
Avg winner = 1.6R
Strategy : wait for market structure break, then trade the retest of that zone. Zone is drawn using the first candle which crossed the pivot high/low to trap the traders.
Makuchaku

USDOLLAR / DXY (monthly) : Faking below yearly low?30 yr yield is already making lower lows since March 2019 (signaling risk). Shouldn't DXY be negatively correlated to it?
DXY has recently dipped below a yearly low to collect liquidity. It's also an exit for trapped sellers from Jan 2018 low (blue box).
Watch out for a rally on monthly charts for DXY!
DXY up => risk OFF => Crash in stock market.
Let's see how this plays out.

NZDUSD (4H) Backtest : Break of market structureWinners = 6
Losers = 5
Breakevens = 2
Total Trades = 13
% Non Losers = 62%
% Winners = 46%
% Breakevens = 15%
% Losers = 38%
Win/Loss = 120%
Net R = 4.6
Avg R/Winner = 0.77
Avg R/trade = 0.35
Bad trades prevented due to presence of liquidity near SL= 20
Icons on the chart
Thumbs up : Trade was a win
Thumbs down : Trade was a loss
Circle with a cross : Trade was breakeven
Cross : Did not take the trade due to presence of liquidity behind the stop loss
Variables
Avg winner = 1.6R
Strategy : wait for market structure break, then trade the retest of that zone (against the trapped traders).

RTY (Russell) (4H) Backtest : Break of market structureWinners = 8
Losers = 3
Breakevens = 2
Total Trades = 13
% Non Losers = 77%
% Winners = 62%
% Breakevens = 15%
% Losers = 23%
Win/Loss = 267%
Net R = 9.8
Avg R/Winner = 1.23
Avg R/trade = 0.75
Bad trades prevented due to presence of liquidity near SL= 26
Icons on the chart
Thumbs up : Trade was a win
Thumbs down : Trade was a loss
Circle with a cross : Trade was breakeven
Cross : Did not take the trade due to presence of liquidity behind the stop loss
Variables
Avg winner = 1.6R
Strategy : wait for market structure break, then trade the retest of that zone (against the trapped traders).

XAUUSD (GOLD) (4H) Backtest : Break of market structureWinners = 12
Losers = 2
Breakevens = 2
Total Trades = 16
% Non Losers = 88%
% Winners = 75%
% Breakevens = 13%
% Losers = 13%
Win/Loss = 600%
Net R = 17.2
Avg R/Winner = 1.43
Avg R/trade = 1.08
Bad trades prevented due to presence of liquidity near SL= 13
Icons on the chart
Thumbs up : Trade was a win
Thumbs down : Trade was a loss
Circle with a cross : Trade was breakeven
Cross : Did not take the trade due to presence of liquidity behind the stop loss
Variables
Avg winner = 1.6R
Strategy : wait for market structure break, then trade the retest of that zone (against the trapped traders).

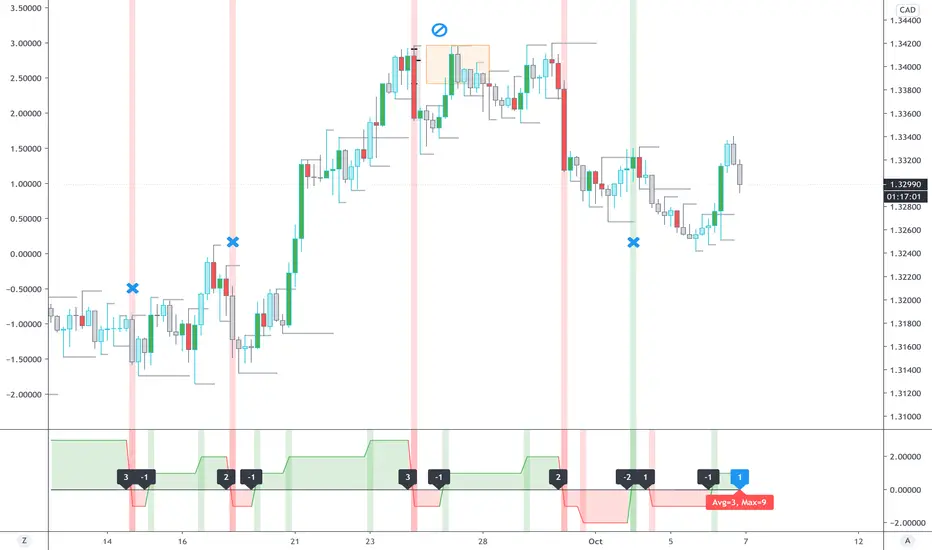
USDCAD (4H) Backtest : Break of market structureWinners = 6
Losers = 3
Breakevens = 4
Total Trades = 13
% Non Losers = 77%
% Winners = 46%
% Breakevens = 31%
% Losers = 23%
Win/Loss = 200%
Net R = 6.6
Avg R/Winner = 1.1
Avg R/trade = 0.51
Bad trades prevented due to presence of liquidity near SL= 18
Icons on the chart
Thumbs up : Trade was a win
Thumbs down : Trade was a loss
Circle with a cross : Trade was breakeven
Cross : Did not take the trade due to presence of liquidity behind the stop loss
Variables
Avg winner = 1.6R
Strategy : wait for market structure break, then trade the retest of that zone (against the trapped traders).
USDCHF : Trapped sellersTrapped Sellers on 4H are nested inside trapped sellers on Weekly. They will want to exit, giving us a long entry.

XAUUSD (GOLD) : Which pocket of trapped traders will exit first?Recently, Gold has been dancing up and down, trapping traders on both sides.
We are patiently waiting for either side to start exiting - and will trade with them!

XAUUSD (GOLD) : Where are traders trapped on a weekly chart? Watch what happens when price comes back to either of blue zones. They both have a bunch of trapped traders caught on the wrong side.
Use these zones as guides and look for refined entries on H4 when price comes back to them.


DXY (Dollar Index) : 2 trapped seller zones to watch outThough in relatively expensive area, there are 2 trapped seller zones to watch for. When price comes to these trapped sellers, the'll want to exit.

XAUUSDD (GOLD) : Trapped sellers below a liquidity zone (Buy!)Sellers were trapped in the recent uptrend in XAUUSD. Just above them, is a liquidity pocket which was recently taken out.
When price reaches these trapped sellers, they'll love to exit their loss making position - (hopefully) giving a beautiful long trade

EURJPY : Let's do a liquidity hunt experiment!During a liquidity hunt, price could fall as shown and reverse from a long term trapped sellers zone. Let's see what happens

EURUSD : Let's do a liquidity hunt experiment!During a liquidity hunt, price could fall as shown and reverse from a long term trapped sellers zone. Let's see what happens

EURGBP : Trapped sellers below a liquidity zoneTrapped sellers will love to exit during a liquidity hunt!

DXY : 3 pockets of sell side liquidity ready to be raided!There are 3 pockets of sell side liquidity right below us, which are ready to be raided!
Short term : ICEUS:DX1! will head lower in search of liquidity
Long term : ICEUS:DX1! will go higher once liquidity pockets have been raided.
Also, lower DXY means higher S&P in the short term, lower in the long term.

Emini : Trapped sellersSunday gap up caught a bunch of sellers by surprise. Their desire to exit is our long trade!

YM : Trapped sellersThe gap up on Sunday trapped a bunch of sellers, who would have a strong desire to exit when price comes back to them.
