Hubline Bhd stock looks to breakout from resistanceHubline BHd stock looks to breakout from strong resistance of 0.60.
Volume rise near key junction and price close near high indicates long buildup can took prices to level of 0.070 or even more higher.
Malaysia

Orion Bhd stock can breakout above resistance Orion Bhd stock can breakout above resistance zone of 0.120 can possible upside tgt can 0.135

London biscuits stock on positive momentumStock looks to trend on positive note. after breakout from trend line can rise to 0.680

Datasonic Bhd oversold on weekly charts caDatasonic Bhd oversold on weekly charts can rise above 0.490 level 0.550 possible and on lower side 0.410 is major support

EFGN - 1MDB Scandal going on since 2 yearsThe 1MDB scandal has been going on for years.
EFG acquired the BSI - Banca della Svizzera Italiana in 2016. This was dissolved because of the complications in the 1MDB scandal on the part of the FINMA (Swiss supervision).
Is now the next bankruptcy candidate?
You can find some information here:
www.finews.com

Hibiscus petroleum Bhd looks weakAs per Weekly chart of Hibiscus petroleum Bhd trend in falling wedge with narrowing in downward slope. Till it not break 1.10 on upside we can expect stock can slide to 0.980-0.930.

Tiger Synergy Berhad flag patternTiger Synergy Berhad stock on daily chart looks to be forming flag pattern.
After sharp rise from level of 0.045 to 0.100 it consolidating around upper part with forming flag like pattern.
Today it gives breaks out a above flag with good volume participation.
we can anticipate it can rise up to 0.110-0.120 with support below 0.080

Singtel stock stock can slide furtherSingtel stock after breaking upward sloping trend line retest it and falling from that level.
To continue bullish stance stock need to close above 3.12. Else below 3.05 can slide further to test previous low where new possible down move as per volume depends.

Telekom Malaysia Bhd up move expectedTelekom Malaysia Bhd up move expected. stock form higher high and breaks above resistance level of 2.47.Long position should be initiated with price TGT 2.70-2.90.
on false move keep closing position below 2.35.

Dow, FKLI & Hang Seng - Again The Retracement LevelAgain the 3 markets have rebound from recent new low. According to elliott wave and fibonacci structure, the market correction size fall between 38.2% to 61.8%. Shall the current market market to prove as trend reversal? Trader please monitor the following price level.
Dow Jones:
Retracement level at 25203, 25537 and 25871. Higher than 25871 indicate price reversal from bear market.
FKLI:
Retracement level at 1697.5, 1707.5 and 1717. Higher than 1717 indicate price reversal from bear market.
Hang Seng:
Retracement level at 25132, 25340 and 25548. Higher than 25548 indicate price reversal from bear market.
If current rally the price do not go higher than the above levels, market remain in bearish structure.

FKLI - Next target 1668Selling will likely find support near previous low 1668. Two fibonacci spirals overlapping the same level.

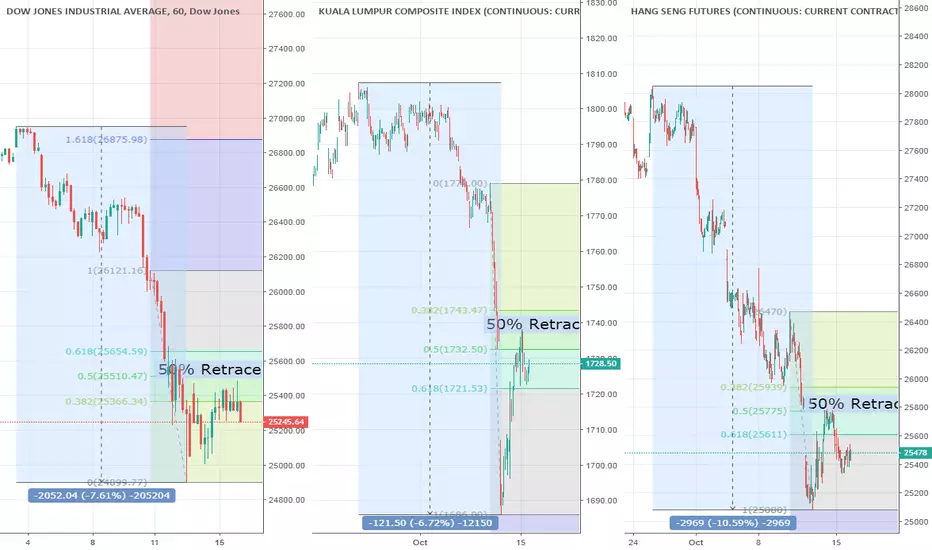
Dow, FKLI & Hang Seng - The 50% RetracementThe sharp declined in indexes market have not make significant come back yet since 11 Oct.
The 3 charts plotted in 60 minitues time frame. From the left
- Dow declined 7.6% from the peak, and rebound to 50% ratracement ( 25510) and trade below.
- FKLI declined 6.7% from the peak, and rebound to slightly higher than 50% ratracement (1738) and retraced.
- Hang Seng declined 10.5% from the recent peak, among the worst performing market, and rebound to 50% ratracement (25775) and trade below.
The current price structure in correction stage with no indication of bullish yet.
AUDUSD - RSI Convergence + Weekly Range Exceeded1. Weekly Pivot wasn't touched (Rob Booker concept)
2. Boomerang Level was formed
3. Weekly Range Projection was exceeded (following week is reversal/retracement bias)
4. Price-RSI Convergence (high probability price could turn)
Refer to the link below to understand what is Boomerang Level

FCPO - Surprising Survey DataThe strong demand in September month have potential to consume rising production. As suggested from yesterday survey data released by Bloomberg and CIMB. Surveys are expecting an unchange inventory for Sep month from Bloomberg and expecting slightly rised by CIMB. (See Below data) Meanwhile, market is waiting Reuters survey data and the first five days SPPOMA production for Oct. Yesterday price rally were largely reflecting the surprised survey data.
The price found crucial support in 2137 as suggested earlier (see previous post for explanation). The current rebound still premature to justify as trend reversal but seen as price rebound. Refer to the right chart, rebound will seen major resistance at 2240. And shorter term time frame on right charts showing price rebound have reached projection price 2233 yesterday. With soyoil down 1.58% overnight and slightly lower oil price, FCPO has retraced from 2232 and reflect the sentiment.
Trader please monitor price level 2233 to 2240 to indicate further direction. If price stay below this zone, FCPO remain in down trend. Otherwise, stronger rebound above 2240.
Bloomberg Poll Sep vs Aug MPOB:
Prodn 1.86m vs 1.62m (+15%)
Impt 70k vs 80k
Expt 1.65m vs 1.10m (+50%)
LDsp 240k-330k
Stks 2.49m vs 2.49m (unch)
CIMB Poll:
Prodn 1.858m (+15%)
Impt 80k
Expt 1.649m (+50%)
LDsp 280k
Stks 2.498m (+0.4%)

GBPUSD & Second Referendum Brexit?I have read that the Labour Party would vote for a second Brexit referendum. I am not sure wether that is bullish or bearish for the sterling. The market is one moody bugger who changes its mind so much. One day, this kind of news would be bullish for sterling, one day it becomes bearish. However, this fresh news (about potential second referendum now that no deals have been strucked with months before deadline) creates more uncertainty, and any uncertainty potentially negative for the Sterling.
Technically, GBPUSD have reached and exceeded its monthly range projection (high), as always, I will always shift my mid-term bias into a "retracement mode". Coincidentally, price reacted bearishly and formed Bearish Engulfing Candle on the Daily TF. I have made an extension projection based on this to a 61.8% extension. I am zooming in to Hour One timeframe and look for a short opportunity and target the weekly range projection low (almost = to the Daily 61.8% extension)

FCPO - Gap ResistanceFCPO filled last week open gap 2195. The filled gap named "exhaustion gap" in technical analysis, this indicate the buying have adapted the recent selling. While intraday price quickly retrace from 2195 to find support between 2181 to 2175 .
Price have no significant direction in current price structure with no PalmOil data for today and tomorrow. FCPO may factoring price movement of BO1! and oil price movement.
Info on Exhaustion gap stockcharts.com

EURUSD Plan & FOMCFOMC later today. The probability of the Federal Reserve to raise interest rate have been priced in at 98%, unless they somehow decided to hold the rates today, there be no headline movement today. However, statement from the Federal Reserve is the one that will potentially set the sentiment tone for the whole week if not the month. Will it be a dovish hike? hawkish hike? ..and many other stuff that I won't bore you with (including the stuff that even I don't understand)
If the "FOMC" later sounded hawkish to me, I will short the EURUSD and target the weekly projection low. Potentially I would even trade into the risk event (in other words, I open a trade hours before FOMC) as I will get more and more information about what is expected from the Federal Reserve today.
Technically, I am currently EURUSD bearish bias due to potential mini Head-And-Shoulders forming and 1.18000 resistance. Ideally i would love it if price could go up wee bit and test one of these levels and a Bearish Engulfing candle forms.

FCPO - Tracking Crude oil PriceFCPO rebound from 2137 (a decades price support level) was affected by rising crude oil prices. Please see right chart correlation indicator. When palm oil price reached 2137, the correlation between oil was as low as -76% due to stronger production. And the rebound start at 20 Sep when price at 2137, on yesterday closing, CPO vs oil correlation has come to almost 80% correlation.
With Soybean oil rises 1.16% from yesterday 6pm. FCPO is likely to open high and retest 2200 level. Thus, the rebound is like to continue. As mentioned yesterday, the current rebound have no strong indication of price reversal yet. The strength of the current rebound can be refer to the left chart, resistance at 2200 & 2220.

FKLI - Short Term CorrectionFKLI set for mixed start of the day, with Dow pull back from historical high as Fed decision ahead.
Yesterday intraday high 1797 was 50% retracement of previous swing from 1807.5. This suggest the price in short term selling structure. As price below 1797, FKLI may retest yesterday low 1787. Major support at 1786 & 1781 (see left chart). Overall trend remain bullish while short term correction.
As FKLI Sep moving ahead expiry, trader may start trading Oct contract if intention to hold beyond this week.
Malaysia data for the week ahead:
12:00 PM PPI YoY AUG
03:00 PM M3 Money Supply YoY AUG

EURUSD StoryIntraday, price did not touch it's minimum high or low projection by few pips. I always tell a story to myself that "if the price doesn't touch the minimum high or low daily range, they owe the market and have to pay it eventually".
Now, this information doesn't help me really as it doesn't necessarily offer me any kind of a "crystal ball" "leading indicator" telling me with absolute accuracy in which the price will go, after all price could touch the minimum high or minimum low regardless on where the price currently sits in (if the price is closer to the projection high, doesnt mean it will eventually touch it. It could move down and touch the projection low and vice versa.
However, it can offer me a level once a bias have been established. I am, technically, bias on a EURUSD Bull. In the last 4 weeks, EURUSD been stuck in a range (refer to top right chart, H4) between 1.17300 to 1.15500. Technical Analysts will describe this as an accumulation phase (though in a up-trend, they also call it distribution phase). The old adage "Range begets Trend". I am anticipating a price expansion beyond this four-week range and finds 1.17500 (if you scroll back in the past, you can see a major rejection when price hits there. Notice the green trendline and inspite of the big bearish candle, the trendline remain strong and supported the price further up.
Weekly range havent been hit as well, its almost the end week, usually price already made anchor and turns towards it. I pick a direction for a bullish move. Speaking of, monthly range havent been hit as well, dependent on which side the price pick this week, next week could be a clear (technically) bias setter.

FCPO - Eye on Export DataPalm oil had dropped almost 150 points in just two weeks time as concern on rising inventory. In fact, demand were surprisingly good during the first 15 days of September. The first 20 days export data is due on today. Trader please be cautious if the continue strong demand will trigger potential price rebound if market have overdone. Speculation of 3.3 m inventory by Dorab still uncertain with surprised demand.
On the left chart showing a 2 months chart, the horizontal line in orange plot at 2013 Jul low 2137, If you look at the the entire chart, price did not trade lower than this for almost a decade except 2014 to 2015. As price near to this level, market is expect to be volatile. Meantime,
In technical view, price may initiate rebound with nearing long term price zone 2137. Market is expect to open higher with Soyoil increased 1.36% from yesterday 6 pm closing of Bursa FCPO1!. And price have achieved 7 multiples of golden ratio at 2158 (see right chart)
If rebound, resistance at 2175 to 2187.
If open gap up, price may fill the gap and trend remain favorable to selling.
If open gap up, price do not fill the gap fully, price factoring in potential strength for rebound.
Stay tune for intraday updates in the same post.

CADJPY Story Intraday (refer to top left chart), price almost touching the weekly range. When that happens, I am biased on a retracement. Mid-term (refer to H4 and D1 chart), price have touched the Monthly projection and tested 87.000 price which was rejected mid May 2018.
Plenty of trading plan can be produced from this. Bearish Engulfing Candle on H4 and/or H1 would warrant me to short the pair between Frankfurt open until London Close. A bearish moving average crossover on the 30-min chart during London-US session overlap until London close, would warrant me a scalping trade as well.
Anything bullish today, I will observe and re-evaluate. Commodity-backed currencies (Canadian Loonie is one of them) have been well supported after market risk tone shift inspite of the Chine Tariffs was slapped but there was "good news" on the North Korean Nuclear plan issue as well. I am anticipating the market to sell this (fully priced in) eventually and that means dumping commodity currencies.
The range projection for this pair is :
Monthly = 320 pips
Weekly = 160-170 pips
Daily = 70-75 pips

FKLI - Bullish Sentiment RemainMarket quickly pull back from yesterday projection 1798.5 zone and fill the opening gap. The intraday price structure found support at 50% retracement level (left chart) and close at mid of intraday range.
With Dow trading at 8 months high, FKLI expect to retest 1800 zone. Trader please aware that the current FKLI vs Dow correlation at only 20% positive related. Emerging market sentiment still under-perform US market.
A few scenarios illustrate for intraday trading as follow:
1. Price trade higher than 1798.5, breakup may rally to 1805 and 1809.
2. Price hover below 1798.5, FKLI trading in range support at 1789 and resistance at 1797.
3. Price move lower than 1789 will change the current structure to sell.
