FKLI - Potential retracement to SellIn Daily chart (left chart), current price did not breakup 1804, this suggest the market remain in correction zone while bias to the downside. The current rally will be reverse if price trade below 1793.5. With Dow trading near 1% below Friday 17:15, FKLI likely to open gap down.
Stay Tune for price projection after first swing has formed. Trader please watch out following price level for potential support resistance & price indication:
Resistance : 1800 & 1804
Support : 1792 & 1785
Malaysia

USDCAD Trading PlanThe fundamentals that move the Canadian Dollar the past week or so were the updates on the NAFTA deal. If a deal struck, Canadian will definitely strengthen. However, the Commodity Market is an important catalyst as well specifically Oil. US-China Trade war somewhat affecting market sentiment and the energy market is no different. The market sentiment at the moment is fragile.
Having said that though, technically we have setups and if the market players decided to dump their CAD longs that I would hope will be illustrated in the chart as a bullish engulfing candle, then I will be a CAD Bull. Should there be an update of the NAFTA deal specifically hinting or confirming a NAFTA deal will be struck, I will short the pair and target according to the daily range.

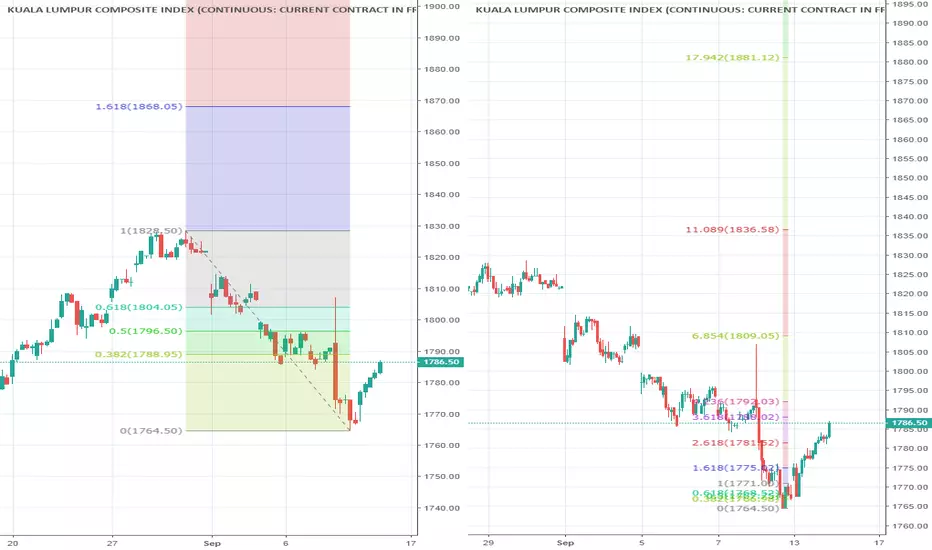
FKLI - Rebound ContinueOn yesterday post, crucial support 1767.5 have prove valid by price action, as rebound breakup correction zone 1776.5 to 1784, the rebound will be a stronger one.
Price should approach 1789 to 1804 zone in short term. 1792 will be resistance.
AUDUSD Two WaysWeekly Range had been hit so technically I will be biased of a 38-50% retracement move (if not full reversal). I am however not ruling out another push to the upside.


AUDUSD "binary" TradingBinary as in 1 and 0. Good unemployment data, I will Long AUDUSD. Bad Employment I will short AUDUSD (Aussie is already pressured by the US China Trade War as it is). A good economic data could give some relief to the Aussie and I want to make sure I am in a trade if that happens

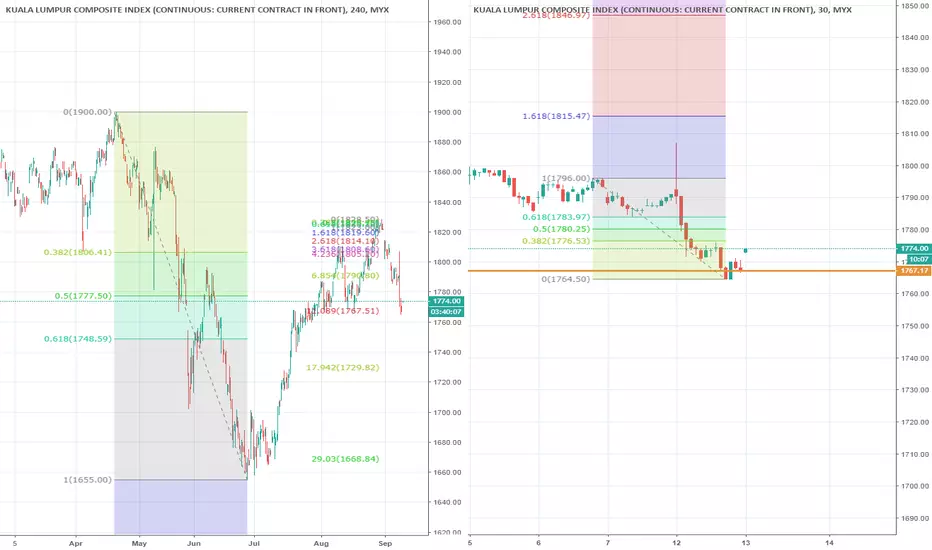
FKLI - Crucial Support 1767.5FKLI correction come to crucial support level (see left chart arrows), trader please monitor this price level for clues of direction, below 1767.5 will see market continue selling to 1729.5 As higher timeframe suggest on the left side, the market trading in correction phase.
If market rebound from 1767.5, the resistance to be see between 1776.5 to 1774. Price further this range indicate a stronger rebound.
EURUSD Bullish PlanSentiment from the PPI poor numbers and the NAFTA deals (CAD strength pressures the Dollar). CPI US later some market experts believed a slow down numbers as well. I am trading into this risk. Technically, USD across the board failed to break levels to continue the bullish USD trend.
If current candle closes as Bullish Engulfing cande (1) , then I will LONG it with risk 0.33% of my account. Stoploss would be just few pips under the Daily Pivot. If price reverses and test the daily pivot (2), then I will add in to my position. I am not ruling out resistance at 1.16500 hence my very small risk for trade (1). A bullish engulfing candle at the pivot (2) will give me conviction that the EUR bid would continue again today.
If there would be a strong bearish engulfing candle happens below the daily pivot, then I will re-assess my trading plan today and make a bearish EURUSD plan.
*ECB Press Conference today
*BOE Bank Rate today
So be careful

FKLI - Sideway around 1790.5FKLI have not moving our from range 1785 - 1796 since 5 Sep. In the daily chart, this price zone was crucial support at 61.8% of previous impulsive swing. In FBM KLCI chart, price did not breakaway the 61.8% (1794). Expecting FKLI to continue sideway until breakout from the range. While without higher high set up, the entire picture remain bearish.

FCPO - Expect open gap down before MPOB ReleaseMPOB data to released on today noon. The survey data expecting rise in inventory. (See below survey data)
The long holiday in Malaysia have not priced in 1.3% drop in soybean oil (BO1!), market is expecting to open down later. Price below 2262 suggesting price move in correction. FCPO formed a double top formation with target at 2255.
FCPO support between 2263 2237 (see right chart)
Bloomberg Poll Aug vs Jul MPOB:
Prodn 1.65m vs +1.50m (+10%)
Expt 1.24m vs 1.21m (+2.5%)
Stks 2.41m vs 2.21m (+9%)
Reuters Poll:
Prodn 1.65m (+9.88%)
Impt 50k
Expt 1.23m (+2.25%)
LDsp 270k
Stks 2.41m (+8.96%)
CIMB Poll:
Prodn 1.681m (+11.8%)
Impt 44k
Expt 1.236m (+2.5%)
LDsp 239k
Stks 2.464m (+11.3%)

AUD Bearish IdeaThe US-China Trade War most definitely pressures the Aussie Dollar. Technically, AUDUSD is consolidating and I am looking for a Short Trade opportunity. A pullback might be an ask but any small pullback followed by a Bearish Engulfing Candle in H4 or H1, I will be in that trade. Target the Weekly Low Projection (120 pips)

FKLI - Below 1790.5, next target at 1767.5The selling remain with emerging market bearish sentiment remain. Trader please look for sell opportunity.

My current SHORT Trade : EURUSDAter Daily Projection High (yesterday) was exceeded and Bearish Engulfing Candle after testing Weekly Pivot . I shorted hours ago and target as illustrated on the chart.

GBPUSD two-way planThe No-Deal Brexit jitters potentially pressure the Sterling in mid-term. I am picking two directions within a general GBPUSD mid-term bearish bias.
Left Hand Side Chart is H4 Timeframe. Right Hand Side Chart is H1 Timeframe
For Plan A : I am marking yesterday's daily pivot + 1.29000 price and I want to see how the market will react upon reaching it. A bearish engulfing candle in H1 timeframe will trigger me to short the GBPUSD. Target will be as illustrated by the arrow.
For Plan B : If the price test today's daily pivot and see a strong bullish reaction from it, I will be LONG and target will be as illustrated by the arrow.
If you like the write-up please give me a follow, If you agree with this trading plan please hit the Agree Button. If you disagree, post a comment down. Thank you for readinG!

EURUSD : Spot the "similarities" Can anyone spot it?
If you do, allow me to say that I am not saying this will pan out. But my argument would be when it is okay to say certain patterns are repetitive, who are to say THIS will not repeat itself as much as price respect previous price levels?
NOT A TRADING PLAN

AUDUSD - Bearish IdeaI am anticipating AUDUSD to rally after the RBA Monetary Policy Meeting and reach weekly pivot @ 72422 and coincidentally hitting Daily Projection high (58 pips). If the price goes there, I am looking for a Bearish Engulfing candle or Dark Cloud Cover and short AUDUSD. Target weekly projection low or 2:1. I am still seeing bearish AUD in spite of the current reaction of the policy meeting. Chine/US trade war pressured the AUD and I expect it will be so.
If you agree or disagree with my plan, post a comment below and we can discuss.

Shorting EURUSD Trading IdeaI want to short EURUSD if a bearish engulfing candle or a dark cloud cover in one of these levels (marked in red arrows). Target(s) based on the average daily projection Low.

A GBPJPY Retracement Trade IdeaIf price reaches there, I will wait what kind of reaction will happen. If Bullish Engulfing Candle occur, I will LONG and target the daily/weekly pivot (it would be within the daily range projection high).

EURJPY -Retracement/Reversal Trading IdeaEURJPY had hit the average weekly range (220 pips) from Y130.80. Part of my method in range analysis is, when price already hit its range the price very often retraces between (38 to 60% of its move), make a full reversal or price begins to move smaller and create small price structure (accumulation phase) (Yes I've just described the entire price action phases. Duhh!).
Having said that though, not all my trading plans are Long. One of my plans is to Short the EURJPY when
A. price reaches the daily pivot and gives me either i) Bearish Engulfing Candle ii) Dark Cloud Cover , I will SHORT and target according to the arrow I've marked in the chart.
Price very often react to obvious levels like Daily/Weekly/Monthly hi-lo levels. B : When price reaches this level, and gives me i) Bullish Engulfing Candle ii) Piercing Candle and target according to the arrow I've marked in the chart.
C. If the price breaks the weekly low (or I was long based on plan B and got stopped out) and reaches last week's Weekly Pivot and gives me i) Bullish Engulfing Candle ii) Piercing Candle, I will LONG and target according to the arrow I've marked in the chart.
If you agree my trading idea, hit the agree button and give me a follow. If you do not agree with my trading or I am missing something (i.e significant prices, levels etc), post a comment below and let's discuss. Thank you for reading
p/s : Its U.S Labor Day hence I trade the crosses today (USD Pairs range on Labor Day is almost untradeable, whilst EURJPY and GBPJPY historically maintains 90-100 pips daily range)

Pick a direction and make a plan : AUDJPYI do not know where this pair going to go. Sentiment wise, I see more weakness for the Aussie Dollar due to reports that Westpac has lifted home loan interest rates by 0.14%. Technically, price recently has tested last week's Low (consequently forming this two-week range). Today I am making a plan if AUDJPY going to go down further. Weekly range haven't been hit (135 pips) I've marked several levels in which when the price reaches there, I will wait for one of the following :
1- Bearish Engulfing Cande
2. Dark Cloud Cover
Targets according to the Average Daily Range for the pair (75 pips).
If you like this plan, have me a follow and thank you for reading

Zoomed in Trading Plan Based on H4 Setup : EURUSDRefer the main plan here :
I've marked the daily pivot level which I will be waiting for the bearish reaction if the price reaches there. The bearish reaction is either a) Bearish Engulfing Candle b) Dark Cloud Cover anything few pips above or below the daily pivot. The target would be the weekly range low.
If you like the trading plan, give me a follow and hit the "Agree" button. Thank you for watching

BearishEngulfing Candle @ EURUSD sets my bias until.....its invalidated by candle "un-engulfed" the bearish candle @ 1.1700. The beauty of planning trades is that we can always project, predict, anticipate the perfect price action that your head can paint in your imagination, but quite often it comes out differently. But that is ok, very often it creates opportunites to trade the bounces.
I am more leaning towards EURUSD bearish, however I am keeping an open mind that the market decides to keep their Euros Long positions hence refer to the upside projection.
If you like this post, give me a follow and click the Agree button. Thank you for reading

My top two trading setup/scenarios/plan for EURUSDLooking for a Bearish Engulfing Candle to "engulf" 50% of the Bullish Enguling candle from 1.66 price. If that happens, I'll short the EURUSD and target 2:1/Weekly Range Low
In the case that price continues going up, I am anticipating the price will find its way to 1.7700 (weeklY Range High) and I will wait the reaction there. A bearish engulfing candle will trigger a Short position for me.
