Decentraland: Where Are the Bulls?Decentraland’s MANA has recently struggled to sustain the upward momentum of wave iii in orange. Nonetheless, our primary scenario remains that this move should eventually push the altcoin above the $0.40 resistance level. Overall, we anticipate the full five-wave orange sequence could extend beyond the next key threshold at $0.85 before the larger blue wave (i) reaches its peak. Conversely, our 25% likely alternative scenario still allows for a new wave corrective low below the $0.19 support.
📈 Over 190 precise analyses, clear entry points, and defined Target Zones - that's what we do (for more: look to the right).
Mana

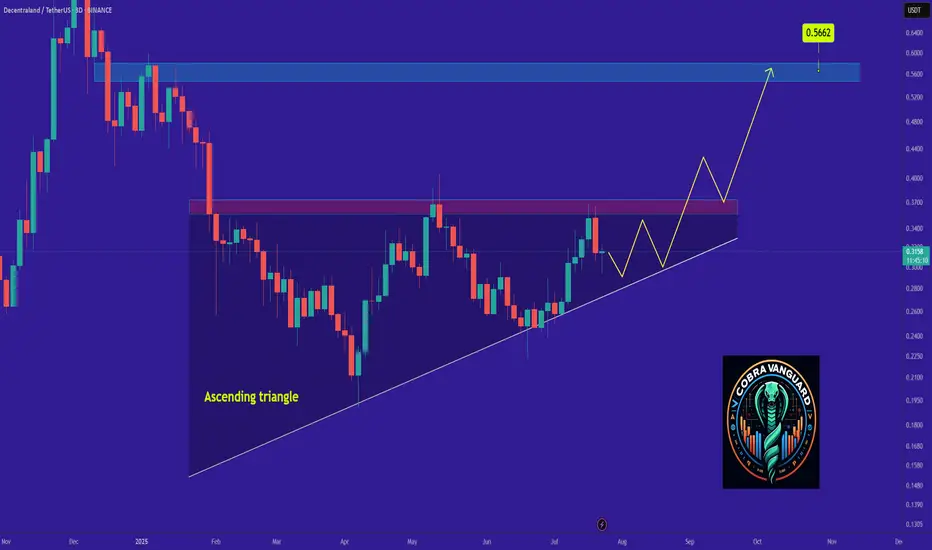
MANA's Situation, A Comprehensive Analysis !!!The price on the 3-d timeframe is within an ascending triangle, which can be promising. If the price breaks this pattern with bullish candles, it could easily rise by the distance of AB=CD .
Best regards CobraVanguard.💚
ManaDecentraland token
Mana usdt Daily analysis
Time frame daily
Risk rewards ratio =2 👈👌
Target = 0439 $
0.44$ - 0.46$ is strong resistance for mana
If price can break this resistance it will go to 0.6$

Bloktopia OutlookNobody is talking about #BLOK, so it's the best time to rise. It's like #SAND and #MANA when nobody knew them. 700X possible!

MANA - move in support and then shoot at 150%Price Prediction:
Short Term (1-3 Days):
The price may continue to move within the falling wedge, maintaining a downward trajectory. However, there is a high probability of testing the lower boundary of the wedge ($0.1900 USDT).
If the price holds above $0.1900 USDT, this could signal a corrective rally toward the $0.2750 USDT level.
Medium Term (1-2 Weeks):
If the price successfully tests the lower boundary of the wedge and rebounds upward, this could lead to a reversal of the pattern and the start of an uptrend.
The target levels after a wedge breakout would be $0.3863 USDT (previous local high).
In case of an unsuccessful test of support ($0.1889 USDT), the price may continue to decline toward deeper support levels (e.g., $0.1500 USDT).
Long Term (1 Month+):
If there is a successful reversal of the falling wedge pattern, this could mark the beginning of a sustained recovery. Target levels could extend beyond $0.3863 USDT, such as $0.5000 USDT or higher.
However, if the downtrend continues without reversal, long-term targets could be significantly below current levels.
Trading Recommendations:
Long (Buy):
Entry: After a successful test of the lower boundary of the wedge ($0.1900 USDT) and a subsequent bounce upward.
Take-Profit: $0.2750 USDT → $0.3863 USDT → $0.5000 USDT.
Stop-Loss: Below $0.1889 USDT (to protect against further declines).
Short (Sell):
Entry: If the price fails to break above the upper boundary of the wedge ($0.2750 USDT) and begins to decline.
Take-Profit: $0.1900 USDT → $0.1500 USDT.
Stop-Loss: Above $0.2750 USDT (to protect against a bullish reversal).
Conclusion:
At the moment, the asset MANA is in a downtrend, forming a falling wedge. This creates potential for both a corrective rally and a continuation of the decline. The key event will be the test of the lower boundary of the wedge ($0.1900 USDT). A successful test could lead to a reversal of the pattern and the start of an uptrend, while an unsuccessful test could strengthen the downtrend.

MANA/USDT Rebounding from Key Weekly Demand Zone – Path to $1?🔶 Strong Support Zone (Demand Zone):
MANA/USDT is currently testing a major weekly support area between $0.20 – $0.30, a zone that has historically acted as a strong demand level since 2021. Price has bounced off this region multiple times, indicating strong buyer interest and potential for a bullish reversal.
🔶 Chart Pattern:
There is no classic pattern like a double bottom or head & shoulders, but price structure shows signs of horizontal accumulation, which resembles a Wyckoff re-accumulation phase—a typical base formation before a strong upside breakout.
🚀 Bullish Scenario:
If the price holds above the $0.25 support and forms a higher low, a bullish continuation is likely. The following resistance levels could serve as potential upside targets:
1. $0.3610 – Initial resistance and confirmation level.
2. $0.5475 – Intermediate psychological level.
3. $0.8109 – Former supply zone.
4. $1.0661 – Major resistance from 2022.
5. $2.7291 – $5.0666 – Long-term targets if macro bull trend resumes.
> Bullish Confirmation: A strong weekly candle close above $0.36 with high volume could spark a major rally.
🔻 Bearish Scenario:
If price breaks down below $0.25 and closes below it on the weekly timeframe, it would invalidate the bullish structure and may trigger further downside towards:
$0.13 – $0.07, the historical lows seen in early 2021.
> Bearish Confirmation: A weekly close below $0.25 with increasing volume would suggest sellers are back in control.
🧠 Conclusion:
MANA/USDT is at a pivotal point within a long-standing support zone. Holding this level could result in a strong upward move, but a breakdown would indicate further bearish pressure. Traders should watch this zone closely for confirmation in either direction.
#MANAUSDT #Decentraland #CryptoTrading #TechnicalAnalysis #AltcoinAnalysis #BullishSetup #SupportZone #TradingView #MetaverseCrypto #CryptoBreakout

Decentraland: Bottom Confirmed!Decentraland (MANA) has delivered a convincing upward reaction within our orange Target Zone ($0.28 – $0.22), confirming the low of orange wave ii. Under the primary scenario, the token is now advancing in wave iii of the same degree. This leg should propel MANA toward resistance at $0.85, with the full five-wave orange sequence expected to surpass that level before completing blue wave (i). That said, we still assign a 33% probability to the alternative scenario, which would imply one final corrective dip below support at $0.19.
📈 Over 190 precise analyses, clear entry points, and defined Target Zones - that's what we do.

MANAUSDT 1W AnalysisMANA ~ 1W Analysis
#MANA Buy back gradually from this support block with a short term target of at least 20%+ from this support.

MANAUSDT 1D AnalysisMANA ~ 1D Analysis
#MANA Buy gradually from here if you still have confidence in this coin with a short term target of at least 15%++ from here.

Decantraland: Progress in wave [i]Following the renewed rise last week, we continue to locate the MANA coin at the beginning of the magenta wave . This movement should have the medium- to short-term potential to extend above the resistance levels at $0.59 and $0.85 before a countermovement should pick up again with wave . Nevertheless, there is a 33% chance for our alternative scenario: if weakness emerges in the near future, a new low of the green wave alt. might be reached. Ultimately, however, this would only imply a slight delay.

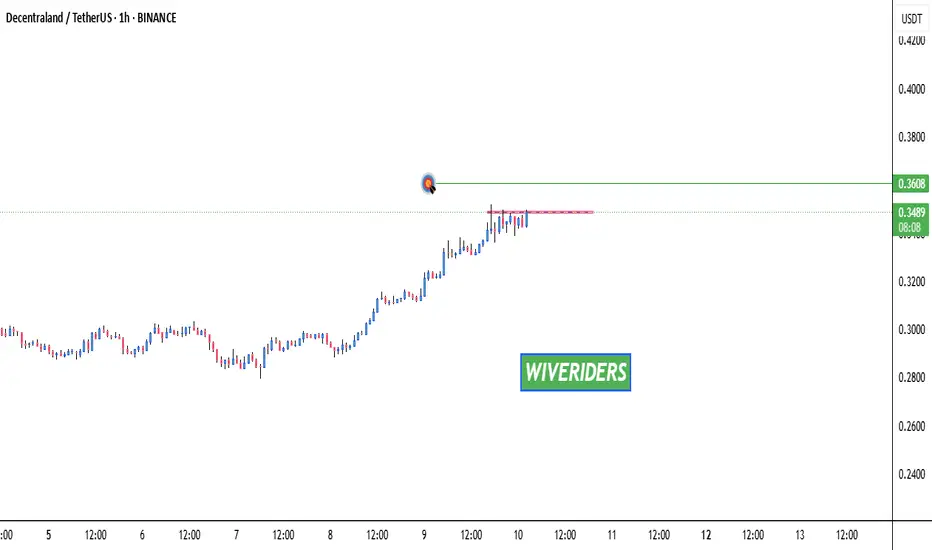
MANA Testing Red Resistance🚀 OTC:MANA Testing Red Resistance – Target Ahead! 📈
OTC:MANA is currently testing the red resistance zone. If the price breaks through, the target could be the green line level! 📊
Let’s watch this breakout together! 💼💸
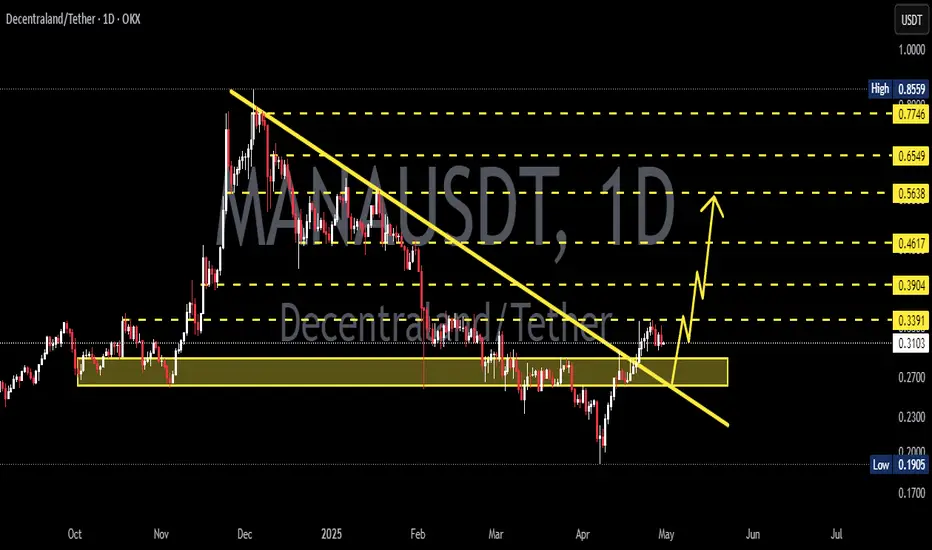
MANA Weekly AnalysisMANA Weekly Analysis
MANA is showing a positive divergence on the weekly timeframe.
This coin has the potential to rise toward the marked resistance levels.
It’s recommended to take profit at the first resistance level.
For added caution, you can rely on the lowest support zone as a safer stop level.
Potential growth and pullback percentages are shown on the chart.
Follow us and support us with your energy!

Decentraland: Your Altcoins Choice (S5)I looked at MANA (Decentraland) recently, two weeks back, and the chart is the same but with the bullish reversal now confirmed.
MANAUSDT produced a major low last month and now is full green. This is the fourth week with growing prices and a bullish bias. A clear recovery. This recovery will lead to a major bullish wave.
The recent low activated the lowest prices since February 2021 and this support level back in 2021 launched the fifth wave of the last bull market. In April 2025, this same level marks the start of the current bullish cycle. We are set to experience maximum growth so lets focus on the targets.
» A very easy target can be found at $1.93 with 505% profits potential. This is a strong target with a very high probability to be hit within the next 3-6 months. A strong target sits at $3.75 and gives 1,076% profits potential or more than 11X.
» Short-term, there is a target at $0.6017 for 88% and this is just too easy, it should be ignored. Aim higher.
If this bull market becomes a really strong one, which I believe will be the case, MANAUSDT can move to hit a new All-Time High. An ATH for 2025 can be $6 just as it can be $9.37. The latter gives 2,837% profits potential or almost 30X from current prices.
This is a good project and has done great in the past. Timing is good now if you focus on the long-term.
The low is in. The correction is over. The bottom is in, higher highs and higher lows next.
A bullish cycle.
Thanks a lot for your continued support.
Namaste.

MANAUSDT 1D AnalysisMANA ~ 1D Analysis
#MANA Buy gradually when re -testing this support with a short -term target of at least 15%+ from here.
MANAUSDT Huge Bounce Incoming?MANA is currently testing a long-term descending support trendline on the weekly chart. This level has acted as a reliable bounce zone multiple times in the past (highlighted with arrows).
-Price is holding above a major support level (~$0.21), showing signs of demand.
-Weekly RSI is forming a bullish divergence, with higher lows on RSI vs. lower lows on price — often a precursor to trend reversals.
-Previous touches on this trendline have led to significant rallies.

Conspicuous - MANA / USDTEvening fellow traders,
Every now and then I ride waves on MANA.
This time it won't be different, as I am already in it.
But I'm looking for an extra touch, that outta the box type thing and buying an extra chunk between the prices shown in the chart.
Please take advantage of this if you get the chance, and let's make a big chunk of money together!
Trade thirsty, my friends!

Decentraland: Fake Rally?Decentraland reacted significantly to the low of April 7 and temporarily achieved an increase of over 50%. Still, there is a 33% chance that the current corrective movement is not yet complete, and we will see a final setback to a fresh low of the green wave alt. in the short term. Primarily, however, we assume that a sustainable bullish trend reversal and the start of a magenta uptrend quintet have already succeeded. Via the magenta and the subsequent interim correction of wave , MANA should now gather momentum for the impulsive breakout of the magenta wave above the two resistance levels at $0.59 and $0.85.

Decentraland: Success In 2025 & BeyondRemember the linear chart. When the action goes flat and the candles become very small, sometimes almost invisible, it means that the current sideways period is reaching its end.
After a bear market there is a long-term consolidation phase and then the next bull market. The long-term consolidation phase for Decentraland is reaching its end and we are about to enter the 2025 bull market. Expect maximum growth.
Here is the linear chart, it shows a perspective with which we can easily appreciate the fact that MANAUSDT is trading at bottom prices. Truly bottom, very low. The best time to buy; when prices are low.
Then we can consider the logarithmic chart. Decentraland grew 45,300%+ between 2020 and 2021.
With this little exercise we cleared up two things: (1) bottom prices and (2) huge potential for growth. Cryptocurrency is the best financial market in the world.
So this pair is good and recently pierced the sideways channel which is a strong buy opportunity, but this never last long. The action is back above but it is still early, because the action is happening near support.
The rest is up to you. This is a friendly reminder. Great timing. No complexities, an easy trade. Buy and hold. Wait patiently and then comeback to collect your check.
There is no need to try and catch the market within a bullish wave. When one pair starts moving, there is always one that is yet to grow. Instead of chasing the ones that already broke out, look for the ones that are still to make their first move, buy them and hold. This strategy leads to success. If you chase a pair, it means you have no plan and the moment you buy it drops and this will push you to sell at a loss and find another pair.
Since it takes many months for a full bullish wave to develop, there is no need to buy something just because it is going up today. Since it can take years for prices to grow, just look for the ones that look best, with the highest probability of high gains, low risk.
Plan ahead and if you don't know what to do, just follow me.
If you don't know what to choose, read these charts that I share everyday. There is no need to rush. Once you read daily what I have to say, you will get used to the market and your choice will make itself present.
There are many of us and not everybody should buy the same. What works for you might not work for me and vice versa. That's why time is needed, invest in yourself. When you take the time to read and study, you will know exactly which pair to buy and hold. Take your time, opportunities are endless when it comes to Crypto.
Thanks a lot for your continued support.
Take your time but do not become complacent. Read everything, be prepared.
It is a small price to pay. Dedicate some time to the market and the market will bless you, with profits.
Namaste.

The key is whether it can rise after receiving support at 0.2349
Hello, traders.
If you "Follow", you can always get new information quickly.
Please click "Boost" as well.
Have a nice day today.
-------------------------------------
(MANAUSDT 1D chart)
It receives support near 0.2349
1st: 0.2636
2nd: 0.3136
The key is whether it can rise to the 1st and 2nd above.
An important volume profile section is formed in the 0.1066-0.1547 section.
Therefore, from a mid- to long-term perspective, the 0.1066-0.1547 range can be considered the last buying range.
-
In order to continue the upward trend, the price must be maintained above the M-Signal indicator of the 1M chart.
Therefore, a way to increase the number of coins (tokens) corresponding to profits with peace of mind is needed.
-
MANA coins are used for Collectibles & NFTs, Gaming, Play To Earn, and Payments.
In addition, it belongs to the Ethereum Ecosystem, Solana Ecosystem, Polygon Ecosystem, Gnosis Chain Ecosystem, and Fusion Network Ecosystem.
Therefore, it seems that it can be used in various ways.
I don't think the future outlook is that bad, but since it is currently being used for Gaming, I don't think there is much merit in terms of price.
This is because it is not easy for the Gaming business to continue to develop.
I think the business needs to expand a bit more.
-
(30m chart)
- HA-High indicator rises above,
- Trend Cloud indicator is rising,
- Rising near the M-Signal indicator on the 1D chart,
- StochRSI indicator enters the overbought zone,
Under the above conditions, there is a possibility that support will be confirmed near the HA-High indicator again.
Accordingly, the key is whether it will be supported near 0.2349, which is the M-Signal indicator point on the 1D chart.
It cannot be ruled out that it will rise to around 0.2636, but it is judged that there is not enough trading volume for that to happen.
-
Thank you for reading to the end.
I hope you have a successful trade.
--------------------------------------------------
- This is an explanation of the big picture.
I used TradingView's INDEX chart to check the entire range of BTC.
I rewrote the previous chart to update it by touching the Fibonacci ratio range of 1.902 (101875.70) ~ 2 (106275.10).
(Previous BTCUSD 12M chart)
Looking at the big picture, it seems to have been following a pattern since 2015 and has been rising.
In other words, it is a pattern that maintains a 3-year uptrend and faces a 1-year downtrend.
Accordingly, the uptrend is expected to continue until 2025.
-
(Current BTCUSD 12M chart)
Based on the currently written Fibonacci ratio, it shows up to 3.618 (178910.15).
Fibonacci ratio 0.618 (44234.54) is not expected to fall again.
(BTCUSDT 12M chart)
I think it is around 42283.58 when looking at the BTCUSDT chart.
-
I will explain it again with the BTCUSD chart.
The Fibonacci ratio ranges marked in the light green boxes, 1.902 (101875.70) ~ 2 (106275.10) and 3 (151166.97) ~ 3.14 (157451.83), are expected to be important support and resistance ranges.
In other words, it seems likely to act as a volume profile range.
Therefore, in order to break through this section upward, I think the point to watch is whether it can rise with support near the Fibonacci ratios of 1.618 (89126.41) and 2.618 (134018.28).
Therefore, the maximum rising section in 2025 is expected to be the 3 (151166.97) ~ 3.14 (157451.83) section.
To do that, we need to look at whether it can rise with support near 2.618 (134018.28).
If it falls after the bull market in 2025, we don't know how far it will fall, but considering the previous decline, we expect it to fall by about -60% to -70%.
So, if the decline starts near the Fibonacci ratio 3.14 (157451.83), it seems likely that it will fall to around Fibonacci 0.618 (44234.54).
I will explain more details when the downtrend starts.
------------------------------------------------------

I'm Bullish, but... MANA / USDTHi friends,
My latest post about MANA was bullish, and I did buy some of the blood we just had.
But this would be another coin that could drop 25% - 30% giving a great opportunity.
Keep an eye on BTC cause if it dumps, this will happen.
Trade thirsty!

Decentraland: Summer FlashbackWith the recent sell-off, Decentraland's MANA reached its lowest level since early August of last year. The selling pressure should now intensify further to push the price down to the anticipated new bear market low of the green corrective wave . From there, the next magenta five-wave upward sequence is expected to begin and finally break through both resistance levels at $0.59 and $0.85 during wave . However, according to our 33% probable alternative scenario, the price could reverse upward now and directly start the impulse wave alt. . In this case, the precursor wave alt. of the same color would conclude at the current price level.

MANA Roadmap (1W)From the point where we placed the red arrow on the chart, it seems that the correction of MANA has begun.
It appears to be forming an ABC pattern, where wave B is a diametric.
Currently, we seem to be at the end of wave f of B.
The price is expected to drop to the green zone, where wave C will be completed.
After wave C is completed, we anticipate a strong upward move in price.
For risk management, please don't forget stop loss and capital management
Comment if you have any questions
Thank You

Decentraland: Corrective TerritoryDecentraland’s MANA remains stuck in corrective territory and should drift slightly lower in the short term, aiming for a new bear market low in the green correction wave . From that level, the next five-part magenta impulse should take over, pushing the price back above both the $0.59 and $0.85 resistance levels in wave . However, there is a 33% chance that MANA will progress faster than primarily assumed: the magenta impulse wave alt. could start directly, driving the price above the two green resistance levels at $0.59 and $0.85. In this alternative scenario, the green wave alt. would be already finished.
