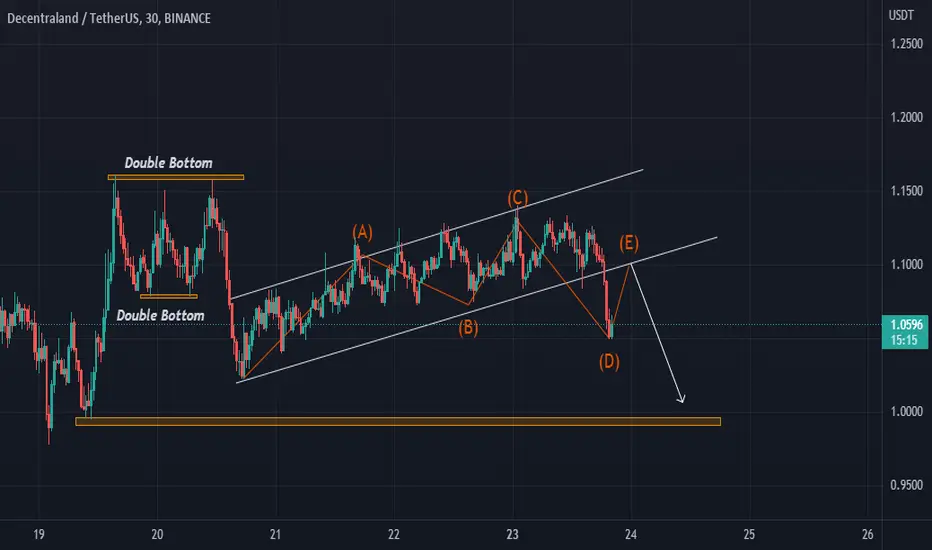
DecentralandMANA/USDT chart is on 30min making Rising Wedge Pattern im waiting for full breakout and i will take SHORT POSITION
Mana
MANA/USDT Short-term bullish sign!Hey Colleagues,
Today we came across MANA/USDT. We see a great short-term opportunity for this coin to have a major pullback back to the $1.45.
There are two scenarios for this coin but both would have same outcome:
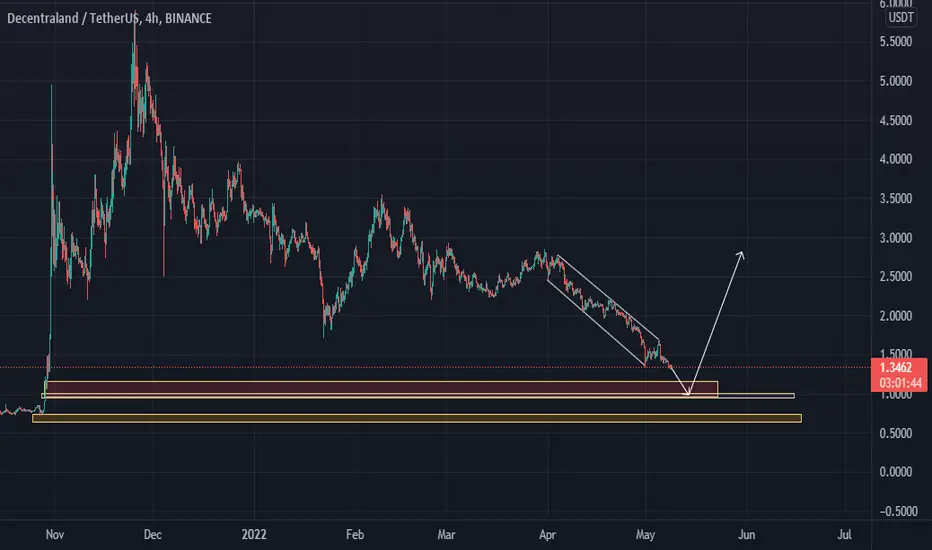
1) We move to $0.83 from where we would bounce back up.
2) We will move to $1.34 where we would try to break the resistance and make from it our new support.
If you like ideas provided by our team you can show us your support by liking and commenting.
Yours Sincerely,
Swallow Team
Disclamer:
We are not financial advisors. The content that we share on this website are for educational purposes and are our own personal opinions.

DecentralandMANA/USDT i see this crypto testing Strong Support zone if dont break this support i will take LONG position into my Supply zone and waiting for breakout to SELL

🆓Decentraland (MANA) May-19 #MANA $MANA
The $1 zone is a very important support for MANA at the moment, MANA can still turn up strongly from this zone. However, we should be careful because if it loses this support it will face a sharp drop towards $0.7 or even $0.5 before recovering. However, the current price zone is still very good for long-term accumulation. Pay attention to capital management and risk management to avoid unnecessary losses in the near future
📈RED PLAN
♻️Condition : If 1-Day closes ABOVE 1$ zone
🔴Buy : 1
🔴Sell : 1.2 - 1.4 - 1.7 - 2
📉BLUE PLAN
♻️Condition : If 1-Day closes BELOW 1$ zone
🔵Sell : 1
🔵Buy : 0.7 - 0.5
❓Details
📈Red Arrow : Main Direction as RED PLAN
📉Blue Arrow : Back-Up Direction as BLUE PLAN
🟩Green zone : Support zone as BUY section
🟥Red zone : Resistance zone as SELL section

BITCOIN on TrendLine SupportAccording to the chart is in the important range of dynamic support trend line. If this line is broken, we will see more falling trend. And if this range is maintained, we will expect the trend to return.
If the line breaks, the analysis process will be updated.
Its not Buy or Sell SIGNAL
DYOR
BY : Mohamad Teriz - @AtonicShark

possible mana price actionmy technical analysis on mana possible reversal if it breaks the previous low,
not a professional please tyor and have a good day

[ALTCOIN] MANAUSDT FALLING WEDGEHello, everyone
We're a team that specializes in chart analysis
We will always analyze and provide you with charts to help you sell
There are so many trading laws and there are so many good technologies that come with them, but I'm confident that the trend line is really strong.
If you read the point of view and get to know the line, every line will adjust
Thank you.
------------------------------------------------------------------------------------------------
Chart Analysis Content -
FALLING WEDGE

MANA - Intraday Short (we hedge)Hi everyone, market is recovering but we always need to hedge with some short positions.
So, here you go with a MANA short we take today.
remember: we are BULLISH at the moment and Long on BTC, FTM,SOLANA, GMT so we need to hedge.
May this idea not go well for us but we ALWAYS need to be careful:
One Love,
the FXPROFESSOR

Mana Bounce before the BullsI think the divergence in indicators shows bull a few days ago then a bear divergence again. If we hold the support a bull run will happen. In this case it might form a double bottom. Not a financial advice

#MANA/USDT 1HOUR UPDATE BY CRYPTOSANDERS Hello, community members welcome you all to this MANA/USDT 1hr chart analysis.
mana/usdt1hour analysis and cup and handle complete and buy green zone.
leverage:-5x to 10x leverage
entry:-$1.11,$1.16
target:-60% to 80%
stoploss:-0.9910
Remember: This is not a piece of financial advice. All investment made by me is at my own risk and I am held responsible for my own profit and losses. So, do your own research before investing in this trade...
happy trading...
thank you...

Go Go BTC You Can Do It!!!!temporary bullish but be aware we are in a bear market so don't forget to close the position after reaching target of 35k as soon we will going to dive more with the bear

I traded with my real money 20% capital #3 Shorting manaMy 2nd trade eth is still open since yesterday. Now I think mana is a good sell. not a financial advice

Decentraland MANA Price Targets and Stop LossMANA/USDT
Entry Range: $1.15 - 1.37
Take Profit 1: $1.55
Take Profit 2: $1.75
Take Profit 3: $2.20
Stop Loss: $0.95
after the short

MANA Took an Early Recovery on the Support Level Price recovered from the decline very early from the support formed. Here we can see that price move back inside the lower boundary of structure while this has a chance to reverse one more time before the lift off. A bull requires a bullish breakout to be confirmed first on the resistance formed.

MANAUSD hit and bounced on the 1W MA150Decentraland (MANAUSD) is almost on a +70% rise since yesterday's Low, with the rebound coming on the 1W MA150 (red trend-line), which got hit for the first time in history. The fractal though resembles that of the mid April High both in terms of price action and 1D RSI.
That sequence rebounded on the 1D MA200 (orange trend-line) instead of the 1W MA150 but as it failed to break the 1D MA50 (blue trend-line), it eventually dropped to a Lower Low below the 1D MA200. The Fibonacci level below the 1W MA150 is the 0.236 at $0.5300. As a result we believe that until the 1D MA50 breaks, which was the bullish break-out point in 2021, MANAUSD remains bearish.
Notice how well those Fibonacci levels (extensions and retracements) have been accuratelly providing Resistance and Support levels these past 12 months.
--------------------------------------------------------------------------------------------------------
** Please support this idea with your likes and comments, it is the best way to keep it relevant and support me. **
--------------------------------------------------------------------------------------------------------

I'm shorting MANAI' was watching APE but I've ended up shorting MANA. On chart you can see my target and my hypothetical stop loss....
I think right now it's at resistance even if it keeps going up but hopefully volume won't support.
Good luck

MANAUSDT - FinalsP.S. Always do your own analysis before a trade. Put a stop loss. Fix profit in parts. Withdraw profits in fiat and reward yourself and your loved ones


PREPARING FOR A MANA LONG Looking at the MANA/USDT pair today, Lets get it!
Chart above us shows that we have a first wave extension impulse in play. As shown by the first fibonacci tool, we found support at the .382 region marking the end of wave 2 and made new ath's at the 1.5 fib region(just under the 1.618) for a wave 3 top before clearly getting rejected as shown by the 2nd fibonacci retracement tool.
Currently still in the correction phase of wave 4, MANA seems to be baiting everyone into buying and longing here, however the chart below shows us with the angles presented that this isnt the bottom and that we will most likely still go to the bottom of the ascending channel before getting a reversal for our wave 5 impulse
Once we confirm our Wave 4 bottom, target for our wave 5 will be the touch of the channel resistance once more and should be inline with either the 1.9 or 2.0 fib resistance, leaving us with a price target in the range of $15-20 depending on how early we can achieve that.
If you agree with this idea, leave a like and share your thoughts in the comments
Feedback is always appreciated.

MANA MACRO ANALYSIS - (DECENTRALAND)Happy New Month Everyone.
We will be looking at MANA/USDT today.
In our past analysis we managed to predict the drop on mana and identified areas to get into a long position, however price missed by a few digits (need to learn to market buy more often). Today we will have another go at longing mana.
As you know the last analysis was based off the First Wave Extension Theory which still remains the same. You can read up on the previous analysis for more details:
Current Analysis:
Not much to explain really. Judging by the chart above, we can expect price to make new ath's this year around early July to September depending on how Bitcoin & Ethereum behave in weeks to come.
Longest duration for price to peak was the 1st wave which having the highest %growth makes sense, followed by a correction of -77%.
Wave 3&4 have had similar timeframes to conclude their tops and bottoms, as well as -70%+ corrections, so we can expect the same for wave 5.
PS: I was expecting a drop to the 1.6 region in January with 1.3 being the worst case scenario, try and keep that in mind and remain on guard. Other than that, I'm happy to average in at these prices.
If you agree pls leave a like and share your views as well in the comments.
Feedback is always appreciated.

MANA/USDT SCALPING SETUP$MANA follow BTC retest after breakdown
Buy zone : 1.165 - 1.1
Target : 1.2481 - 1.3069 - 1.3752
Stop : 1.06

MANA in decissive zone - sell-off or reversal?MANA will arrive decissive zone in 1.1 area where longterm-uptrend should hold to give us some upside-momentum.
2 TPs possible for me - consider your stop-loss in case we break towards south. Good luck

DecentralandMANA/USDT comming pushing down trend and i waiting until 1$ and waiting for retest if not support on 1$ next target is 0.70