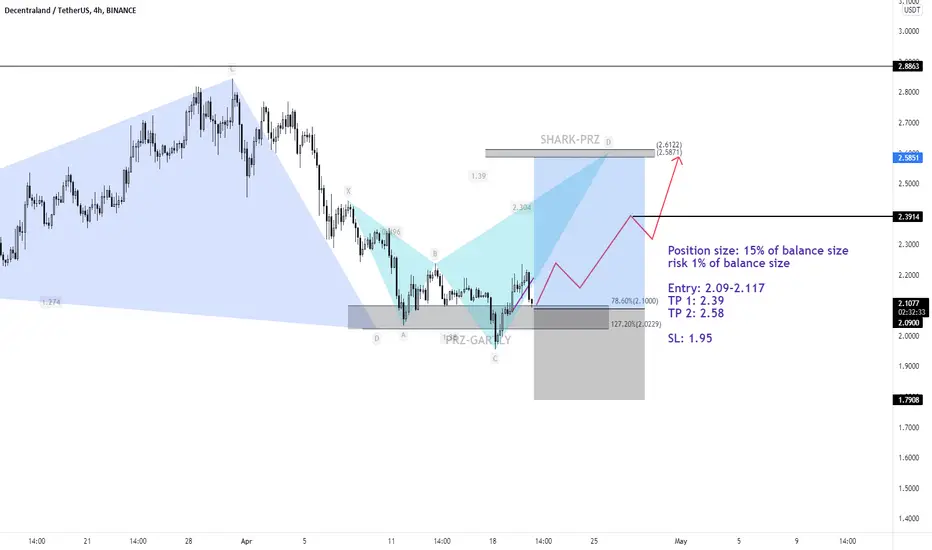
MANAUSDTPosition size: 15% of balance size
risk 1% of balance size
Entry: 2.09-2.117
TP 1: 2.39
TP 2: 2.58
SL: 1.95
Mana
MANAUSDT LONGPosition size: 15% of balance size
risk 1% of balance size
Entry: 2.09-2.117
TP 1: 2.39
TP 2: 2.58
SL: 1.95

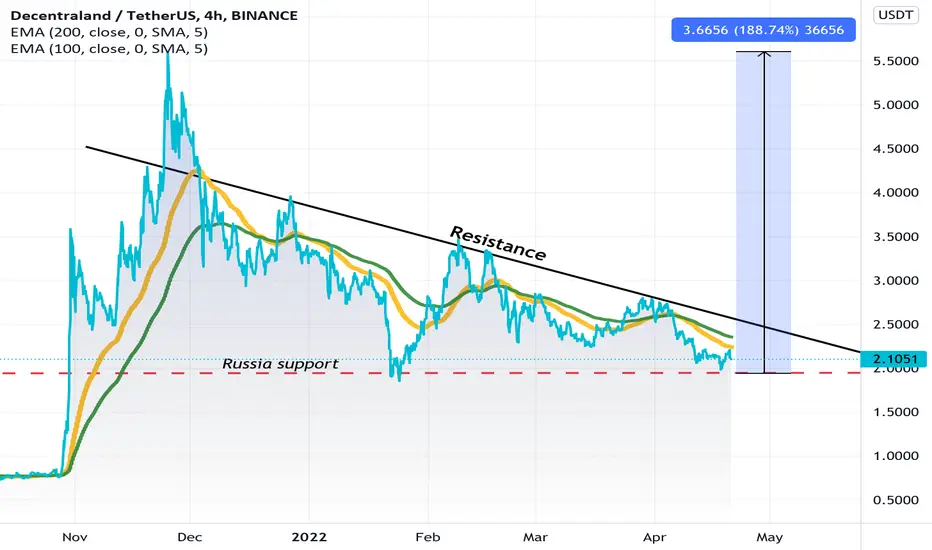

MANA double bottom and falling wedge Good day,
We are looking at the one day chart of MANA//USDT
As we can see, a double bottom has formed within a falling wedge.
The above could mean bullish
Good day!

new ta :))my last two positions got stop-loss, tho it's ok since the risk is small.
this is my new position for mana hope I don't get sl lol
ps: not a pro trader dyor
stay safe :)


GALA: major TRENDLINE breakout! Possible scenarios!Gala Games (GALA) is a popular gameplay project. Like 99% of the cryptocurrency market, GALA is in consolidation.
Price is squeezing to the global trend line and may break out soon. In case a manipulation happens (stop-loss collection, false breakout) as shown on the chart, this is a good opportunity to open long positions.
Targets:
1. $0.21-0.22 (short-term)
2. $0.245-0.25
Be sure to keep an eye on Bitcoin. If it shows strength and starts to rise to local highs, all altcoins will starts to PUMP.
Friends, press the "like" button, write comments and share with your friends - it will be the best THANK YOU.
P.S. Personally, I open an entry if the price shows it according to my strategy.
Always do your analysis before making a trade.

Possible rising for MANA The kumo cloud is thin then we can see a strong trend
----------------------------------------------------------
there is a huge space around lagging span
-------------------------------------------------------
The base line has been flat for a few days
--------------------------------------------------------
The distance between price and base line is less than 300 pips


MANA trend follow shortPrice broke below very important area of support around 2.20 - 2.24 with an impulsive candle. Price then retested support turned resistance with a bearish flag, broke trend line with a high volume bearish engulfing candle on the 1h chart.
Stop loss: above resistance, recent highs
Take profit: at 1.5 fib extension level, acts as level of structure to the left

Short $mana Decentraland $Mana (Decentraland) is in a long downward trend against USDT, towards -99% in my opinion
My thesis is built upon stalling user activity; stalling "metaverse narrative"; poor in-game experience (in my opinion); bearish tokenomics
I'm SHORT as follows:
Entry: 2.638
Liquidation: 3.099
Leverage: 5x
Margin(USDT): 1269.67
Take Profit @ 2.060

#MANAUSDThe selling pressure seems to be high and the correction process to the resistance area causes a fall again


MANA/USDT BINANCE H1 Falling Wedge (active) [Decentraland]MANA/USDT BINANCE H1 Falling Wedge (active)
A Falling Wedge is activated
Targets are displayed as green horizontal rays
Longterm, Midterm and Shortterm view Fibonacci Retracement Levels are displayed as horizontal lines
Historical Monthly Highs and Lows are displayed as horizontal lines
This Pattern is part of a bigger bearish pattern, see active Bearish Pennant

MANA/USDT BINANCE D1 - Bearisch Pennant (active)MANA/USDT BINANCE D1 - Bearisch Pennant
a Bearisch Pennant was activated today
Targets are marked as horizontal rays in green

MANAUSDT -- 4HHey guys
It is time to invest in some coins and tokens according to their technical and fundamental conditions.
here is the third one I have orders according to the key levels shown in the chart.
DYOR!
This is my idea. not a financial advice.
like and share and comment the coin or token you want me to share my technical point of you of them
Good luck


Decentraland MANA short Price Targets and Stop LossMANA/USDT short
Entry Range: $2.20 - 2.44
Take Profit 1: $2.10
Take Profit 2: $1.60
Take Profit 3: $1.15
Stop Loss: $2.66

let's long manai'm not a profssional but look at this chart trading safe with low leverge , stop loss and tp and lets see.

MANA/USDT by CryptoTradersWWPrice is reaching the falling triangle's apex, indicating that a substantial move is on the way.
With a pattern like this, it's critical to stay neutral until we see evidence of a breakthrough.
Below the $2 support, there is a large hole, which might lead to a rapid decline if this level is lost as support. The bulls will have to work a little harder to invalidate this bearish pattern and take out the previous lower high of $3.48.
<---------------------------->
☑️ Follow, Comment & Like
☑️ Create a civil and healty discuss in the comments and share with me your thoughts
Thanks and Happy Trading!

Mana / Decentraland Long / Target 30$Mana / Decentraland Long / Target 30$
Nice ascending channel! Hope pattern will continue

Update on MANA USDTHere are my thoughts on Decentraland!
No financial advice
Have a nice weekend,
therightanswer
