2 of 3 bullishCurrently, I see the short-term ascending triangle (green) leading to the next step in a symmetrical triangle (red)...or just what was needed to create a H&S scenario (blue). A dip to $3 would confirm the H&S pattern, leading to a drop to mid-$2.40's. Hopefully, it will stay above $3.20 at least until it breaks $3.60, invalidating the H&S. It really depends on BTC. If BTC tests 42-44K again, MANA and everything else will tank...I think, because these are just ideas and not financial advice.
Mana


MANA incremental increaseMANA chart is calm but we see a gradual increase, it is not big but healthy and shows that we have strong support at these levels

MANA 15mn Reviewif its break the box as a support and resistance and conform a second candle above it or below it then Enter LONG/Short... Happy Trading Guys...

RUNE TRADE ENTEREDRUNE has broken out of falling wedge, before hitting horizontal resistance and now on third attempt has broken and closed above the resistance showing bullish signs of an ongoing trend reversal.

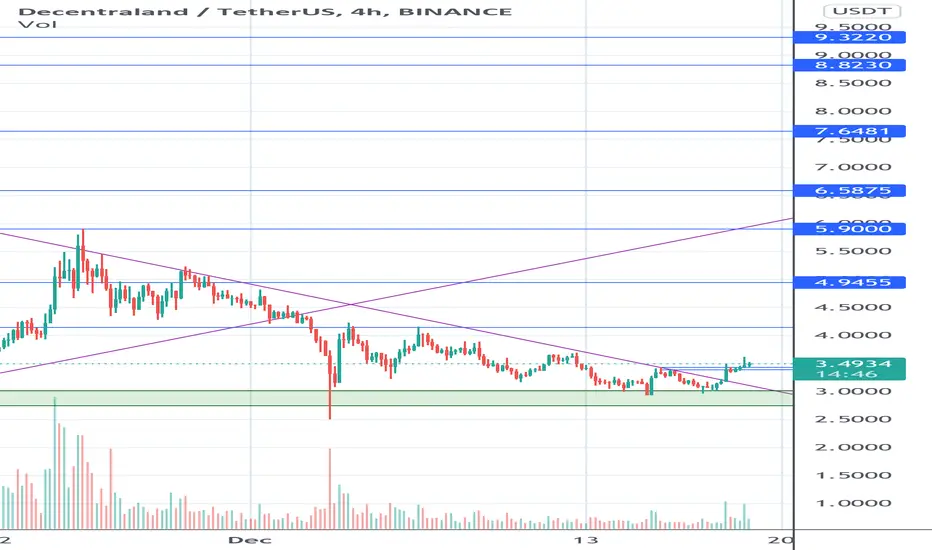
MANA/USDTMANA 4H timeframe Update Buying Range 3.35$ to 3.00$ Sell Target Mention In Chart (Green Box) By Scorpion Crypto

MANA, PULLBACK CONFIRMED...!Good support area for Mana. Looking for a new pump for altcoins due to the Usdt.d downtrend...
Short-term target: 4.20

MANA continuation of high trend volatilityMANA currently has a very dynamic chart, the strong support line shows that MANA is trying to break out, but it is difficult

MANA ... attractive for GARYSCALE ...on daily or 4H; we have an uptrend channel.
umm ... and we were in the consolidation pattern that was breakout
now we pull back on it for go up or not?
have SL ! cation!

mana is in a good moodmana broke its falling wedge and hade pull back ( last kiss ) on it if the btc condition help it can have huge move toward the upside

MANA high volatilityMANA is falling further in price, the situation looks difficult but it is due to BTC, the market always gets a ricochet from BTC, such situations should be treated as promotions

MANA bulls still fightingJust a short-term update/confirmation. The support on the green line looks better on the 6 hour and a similar line can be made on the 1 hr...and this is such a small trend, the 1 hr is fine. Small but crucial as I am hopeful BTC doesn't drag MANA below $3.18. MANA is looking good within the Bullinger Bands and the MACD is good-mediocre. MANA is just at "that point" where trends are coming to a head and I fear some people were burned last week. I did pretty well through it all, but could have done better had I had a crystal ball. On a good note, volume, albeit low, is double that of yesterday...so hopefully, that trend will continue. Should MANA break $3.71, I would feel a lot better all around. MANA has ignored BTC lag before...and this is going to have to happen at some point when financial institutions realize BTC is more of a Kleenex brand for a greater product, but there are far better crypto products out there than BTC...I just hold one, for the cause. Kleenex is a poor example because I think their tissues are the best;-) Anyway, this is not financial advice. Note, MANA is approaching the mid-line on the descending channel that began on Dec. 3. It will be interesting to see if it bounces (soon) around $3.22, maintaining a strong position in the upper half of the greater descending channel.

Good opportunity to buy MANA- Keep an eye on MANA for a short profit...
- It is going down (somehow pullback) so we can buy it there...

MANA iHs breakout play to R1breakout confirmation and run to R1
iHs breakout play and running to R1
news coming out for drop in 2 days, good time for a nice pump and profit claim
TP: R1 PP 0.382
SL: S1 pp 0.382 + 7 pips

MANA could be about to moon again MANA back in October shown a cross over of the 100,200 ma (2HR CHART) which resulted in a massive move to the upside, we could potentially be about to see a move like this show in the chart as the price approaches the 200ma on the 2HR chart, after already surpassing it on the 1HR chart!!!!

MANA green candles and strong supportMANA shows a green chart, the situation looks healthy and is likely to continue, everything will depend on BTC

Bullish Scenario #2Depending upon where the breakout happens in the symmetrical triangle that would be confirmed with the C&H (purple), I think MANA will rally closer to $5 with an approx. $1.3131 rise in price from breakout. This is just an idea...not financial advice. I will feel better about all these ideas, of course, once MANA breaks from the descending channel (green). MACD is starting to point upwards on the daily. Once it crosses, I think it will shoot above the histogram, supporting this large pump.

Breakout Eminent 2: adjusted for time.Numbers haven't changed but in the initial post, we had no idea when it would break out of the descending wedge. Assuming that the bottom holds, from where the actual breakout occurred, the shorter-term target, oddly enough, is exactly $4.50. Crypto loves round numbers. Just like the original idea, this is not financial advice, just an idea that seems to be playing out should the rest of the market cooperate. Do your own research...let me know if I'm missing something.

ZEC TRADE ENTEREDZEC inverse head & shoulders confirmed on hourly and position entered. possible retest on neckline before pump.

Crypto IndexTotal crypto market cap analysis is very useful four major cryptocurrencies and real scenario of future in the crypto world so look it carefully, it have measured trendlines and measure support and resistance levels I have no money to do trades but I have something to give people which is my learnings.

MANA is going up from here! BINANCE:MANAUSDT
Mana is surely need to go up from here, and can only fail if BTC truley falls into the bears hands.
we have:
1. 68% on the fibonacci level acting as a support over all when we zoom out. a strong clue that the big picture bull run is still in progress.
2. bulls triangle with a breaking green candle with nice volume.
3.visible divergance on the rsi indicator indicates a short term trend reversal.
4.clear resistance levels on the volume profile indicator that can easily act as support if we are moving over allthough we need to track carfully those spots. may be a rejection, take profits smartly.
5.clear and nice cross on the macd indicates a possible trend reversal.
6.100 EMA golden cross.
7.reversal breaking EMA's of the vpvr indicator on the 4H chart.
take profits level are : target 1 - 3.6 target 2 - 3.9 target 3 - 4.6
too much signs for it to fail although crypto s truly sometimes unexpected, calculate your risk wisley.
"not a financial adviser" "only an idea"

MANA - Decentralandcrossing the descending line with strong candle .
3.55$ is the first resistance .
look at the MA and reactions of chart .
