Decentraland (MANA) - April 29Hello?
Dear traders, nice to meet you.
By "following" you can always get new information quickly.
Please also click "Like".
Have a good day.
-------------------------------------
(MANAUSD 1D chart)
You should watch for any movement that deviates from the 1.39115151-1.56279408 segment.
If it falls, you need to make sure you get support at 1.30533024-1.39115151.
If it falls from 0.90768802 point, a Stop Loss is required to preserve profit and loss.
We have to see if we can stockpile the power to ascend above 2.0 points.
-------------------------------------
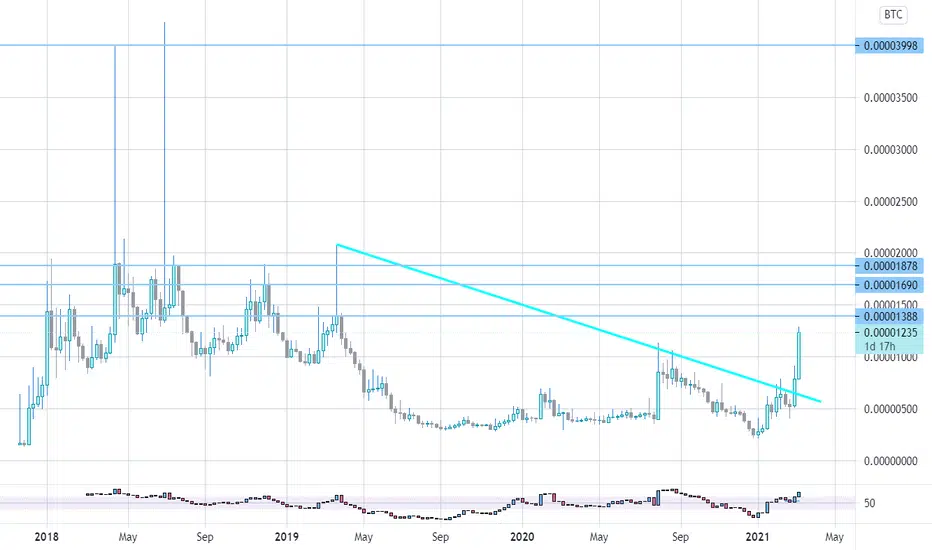
(MANABTC 1D chart)
We must see if we can ascend above the 2705 Satoshi point.
If it falls, we need to make sure we get support in the 2295 Satoshi-2432 Satoshi section.
--------------------------------------
It is advisable to trade at your average unit price.
This is because if the price flows below your average unit price, which was on an uptrend or downtrend, there is a high possibility that you will not be able to earn a large profit due to the psychological burden.
The center of every trade starts with the average unit price you start trading.
If you ignore this, you may be trading in the wrong direction.
Therefore, it is important to find a way to lower the average unit price and adjust the proportion of the investment, so that the money that ultimately corresponds to the profit can regenerate the profit.
-------------------------------------------------- -------------------------------------------
** All indicators are lagging indicators.
So, it's important to be aware that the indicator moves accordingly with the movement of price and volume.
Just for the sake of convenience, we are talking upside down for interpretation of the indicators.
** The wRSI_SR indicator is an indicator created by adding settings and options from the existing Stochastic RSI indicator.
Therefore, the interpretation is the same as the conventional stochastic RSI indicator. (K, D line -> R, S line)
** The OBV indicator was re-created by applying a formula to the DepthHouse Trading indicator, an indicator that oh92 disclosed. (Thank you for this.)
** Check support, resistance, and abbreviation points.
** Support or resistance is based on the closing price of the 1D chart.
** All explanations are for reference only and do not guarantee profit or loss on investment.
Explanation of abbreviations displayed on the chart
R: A point or section of resistance that requires a response to preserve profits
S-L: Stop Loss point or section
S: A point or segment that can be bought for profit generation as a support point or segment
(Short-term Stop Loss can be said to be a point where profits and losses can be preserved or additionally entered through installment transactions. It is a short-term investment perspective.)
GAP refers to the difference in prices that occurred when the stock market, CME, and BAKKT exchanges were closed because they do not trade 24 hours a day.
G1: Closing price when closed
G2: Cigar at the time of opening
(Example) Gap (G1-G2)
MANABTC


MANA in amazing MANA and all other altcoin do not have light future and wait for BTC's new position
But i emphasis that MANA ,Zil , ADA is good choise for hold

MANA price bottom updateSpecial shout out to those of you who listened to me when i told you not to dip buy just yet and wait for the better deals to come rolling in one by one.
We are holding strong with our previous idea and expecting an even lower drop to occur in the coming days..

MANAUSDTMANA is on the hot coins list in Binance.
It did a 35% pump and still looks good.
It's got the potential to reach those 2 TP areas I've shown on the chart.
If you're looking into opening a long position, wait for the closure of a 4H candle above the resistance area and then open long positions.
⚠️ NOTE: This usually happens when a coin gets hot on crypto platforms: it might go down by a little and then get back up to a new high.
Good Luck 🎲
Tell me your ideas. Like and Share 🗣✅


$MANA price action $Mana still trying to break out but lacks volume. Looking like a break down back to the support and then pump??

MANA Out Of The TriangleMANA is out of the triangle now. We can expect it to continue the uptrend as long as it's moving above the EMA50 & EMA60.

MANA Bullish Pennant (MANAUSDT)MANA breaks the pennant pattern. Also crosses the MA60 and Moving Average Ribbon shows buy signal. MACD is bullish too.
So we can expect a move to the resistance zones as the potential targets.

MANA-DownCorrection out of the rip channel into a more leisurely bull channel still ongoing, price testing key support @ .90 if price breaks through we are headed back to the gray bull channel with support at .67. Otherwise a bounce off .90 past .93 keeps the stronger channel in play.

MANA-Wanna Piece A That DigiLANCorrection, or recovery, MANA showing some signs of fight. Back in channel, watch for support lines.

2$ Mana - Grayscale TrustMANA is ready for another leg up. Bull Flag target is almost $2. And add to Grayscale trust is going to give it a huge push to upside.


MANABTC on fire#MANABTC has broken out from long term descending resistance and now is on fire to reach 1388 sats and 1878 sats. 🚀🚀

MANABTC - Beginning of the 3rd ascending wave Beginning of the 3rd ascending wave with the target of Satoshi 1327
By the end of the 2 / B wave in the range of 216 Satoshi, the uptrend has begun, in the range of 786 Satoshi, the first uptrend ended. By break down of downtrend line the, 3rd Wave has started.
In the 240-minute chart you can check the sub-waves

Decentraland (MANA) formed Shark for upto 15.5% profit moveHi dear patrons, hope you are well and welcome to the new update on Decentraland.
On the short-term 4-hour time period chart, the price action of MANA token with Bitcoin pair has completed the final leg of Shark pattern and entered in potential reversal zone. There is also 200 SMA support below the buying zone.
This trade has a huge profit possibility of 15.5%, and the loss possibility is only 3.2%.
Note: Above idea is for educational purpose only. It is advised to diversify and strictly follow the stop loss, and don't get stuck with trade.


MANA , TIME TO CONSIDERSeems iHS is in play on daily time frame , with DNT & CVC Pumps i think mana will join the party soon.


MANA is ready to set new all time highHey friends, hope you are well and welcome to the new update on Decentraland token.
In my previous article, we have seen that the MANA was moving in a down channel and I predicted that this time it will break out the channel.
Now if we take a look at the live daily chat, then finally MANA has broken out the channel and also broke out 25, 50, and, 100 simple moving averages. Now it is stuck at 200 SMA. If the price action of Decentraland will not be able to break out the 200 simple moving average then it may re-test the resistance of the channel as support.
Long-term SMAs:
On the long-term weekly chart, the price action of Decentraland is trying to break out the 25, 50, and 100 simple moving averages.
Long-term Ichimoku cloud is bullish now:
On the long-term weekly chart, the price action of the MANA token was moving under the strong bearish Ichimoku cloud. Now the cloud has finally turned bullish, therefore, it is a strong possibility that the price action would breakout this cloud with a powerful bullish divergence.
Big Shark move:
While the Ichimoku cloud has turned bullish the price action of the MANA token is also moving in a potential reversal zone of a very big bullish Shark pattern on a 2-month chart. When the priceline will start moving up from this potential reversal zone then the price action of MANA my cross the all-time high price level as well.

$MANA, 50% up since monday.. (Buy Signal)$MANA
Following what Alts have been doing over the last week or so..
50% up since monday.. (Buy Signal)
Unfortunatelly I didn't catch this one, but if you did, these are the targets that I'm watching for retests/resistances.
#MANA
