Decentraland (MANA) Stronger Than Most (153% Profits Potential)Decentraland (MANA) is a very active cryptocurrency, judging by its charts. It touched bottom at least a week in advance compared to other alts and it also reached its all time high just a few weeks ago on the 22nd April, while most of the altcoins reached and / or challenged their all time high back in December 2017 / January 2018. So this one is definitely creating its own cycles.
The fact that this coins chart moves different to the rest, is a good reason to hold it (for diversification purposes) and track its movement, as it can give us signals and clues as to what might happen next for other coins. Let's see what we can make out of this one. I remember it being a great money maker for me and my supporters in the past. Let's see if we can have the same again.
Decentraland (MANABTC) Trade Analysis by Alan Masters
CHARTS, SIGNALS & INDICATORS
On the daily chart:
- We are in an uptrend, short, mid and long term.
- We are trading above the EMA50, 100 and 200 lines. All these lines work as strong support if MANA decides to move down.
- MACD, RSI, STOCH and DMI, all room for growth.
- Decentraland has a very active team. It is a prominent coin in this Consensus 2018 and also has an upcoming event on the 25th May.
- On the 31st December 2018, is the opening of the Decentraland virtual reality metaverse (VR-world, Genesis city) for all users. This can be a huge event for this coin.
Now, let's trade it...
TRADE INSTRUCTIONS
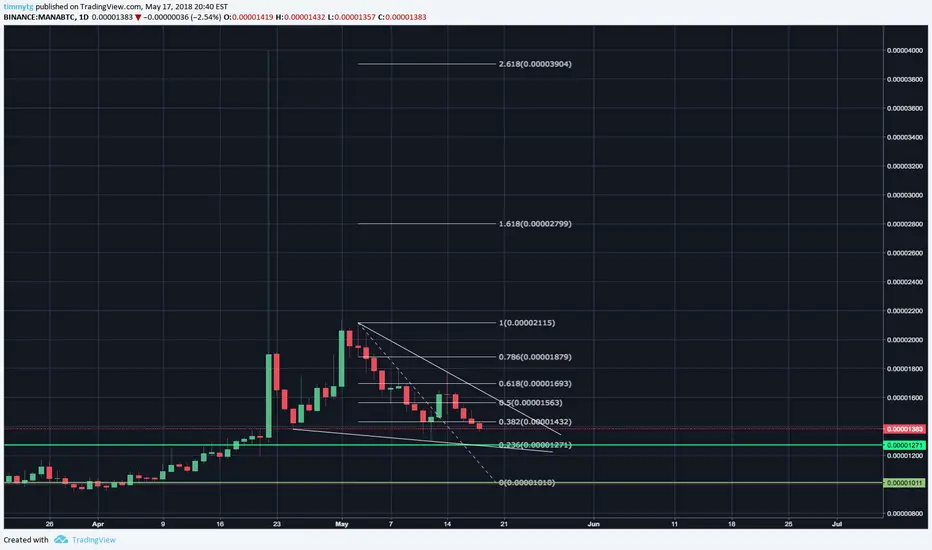
Buy in: 0.0000131 - 0.000171
Decentraland (MANA) Targets:
(1) 0.0000198
(2) 0.0000248
(3) 0.0000273
(4) 0.0000332
(5) 0.0000399
Stop loss: 0.0000117
Note: Stop loss active for this trade. If stop loss hit, close the trade we are likely to be able to buy back lower if this happens.
YOU DESERVE THE BEST!
Have you ever been in this situation?
When you felt down and you doubt yourself.
Maybe something happened in the past, that made you forget your amazing attributes, you start to judge your own actions and ways.
The past is the past.
The present is the moment that is made for us.
The future is beautiful but is yet to come.
Remember to focus in what you really want.
So regardless of the tragic or beautiful past, or the present that sometimes gets in your way.
Just remember that you are special...
And it doesn't matter what really happens...
You will always DESERVE THE BEST!
Namaste.
MANABTC

MANA/BTC fall to 1200 -1010Short term trade down
Following trend line wait for price to drop to 1200 - 1150 and buy
Monitor the fall of bitcoin if it does drop and see how sensitive the market is. if conditions seem rapid worst case scenario a fall to 1010 before bouncing back.
T1 1430
T2 1550
T3 1700
T4 1900

#MANA: breakout of falling wedge, Targeting KS & cloud #cryptoMana has broken out of the bullish falling wedge and crossed above 20DMA which is acting as a support level now at 1388 sats
Price has crossed above TS(Conversion-line) and looking to break KS(Base-line)
Resistance confluence region: 1390-1525 region
In the 4H t-f Mana has crossed above both TS & KS giving a buy signal
also TS bullish crossover of KS giving another buy signal
MACD bullish crossover of signal line, RSI above 50 & Stoch RSI also bullish
We can expect #mana to break above resitance region and Target higher fib levels
Target 1:1525
Target 2:1700
Target 3:1900

MANA/BTCbuy half at entry 1271 following trend and/or the rest at 1010 if bitcoin falls to lows again
(if it holds around the 1200 for a couple of days buy the remanding at a price you desire)


MANABTC / H4 / Support lineMANABTC / H4 / Support line
it try to ove up from Support line,
Resistance zones are on the chart
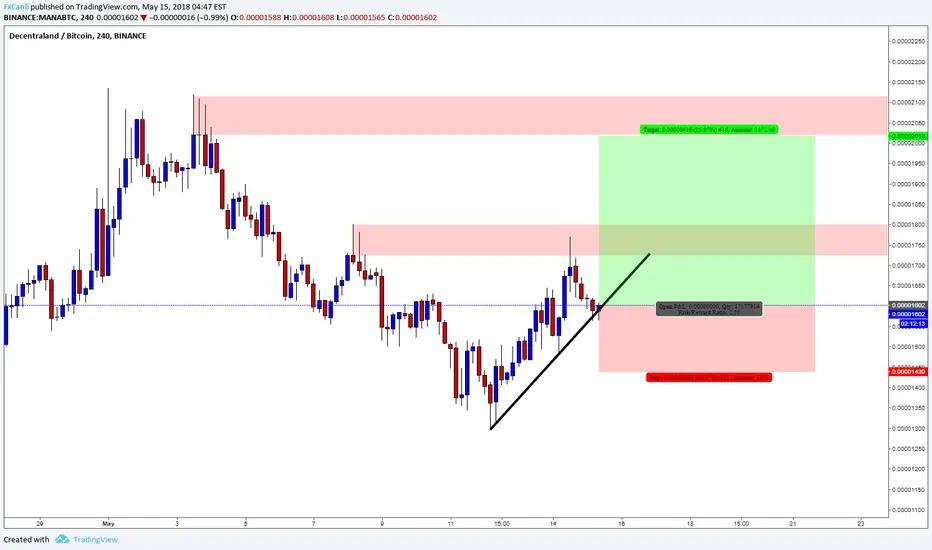


MANA heading for higher highsYellow circle / Close above or under the MA and EMA
Blue Box / Buy in zone
Red Box / Support / Stop loss
Green Box / Targets we are want to achieve!

MANABTC - Analysis There are two scenarios that can be explained in this 15 min chart:
1 - MANABTC chart, in the last couple of days, showed a resistance to a MA200, as you see on the chart (Red Circles).
That can be a sign that the trend will continue going sideways or hypothetically it might bounce up.
2- On the other hand, MANABTC shows a TRIPLE TOP. Also, the stoch chart is not very promising; you can see the lower top and the bottom is almost flat. It might be a Huge Drop in the next few hours!
Despite the fact that BTC price can change the scenario, HODL is apparently may be the best option.

MANA Long Playlooking for another leg up. Looks solid support off fib line. Looking to go up. Good R/R.

MANA Decentraland Cup and HandleCup and handle forming for MANA on Binanace. Lets see what happens. Do not 90% of my predictions fails :D
Doing all of this just for fun :)))

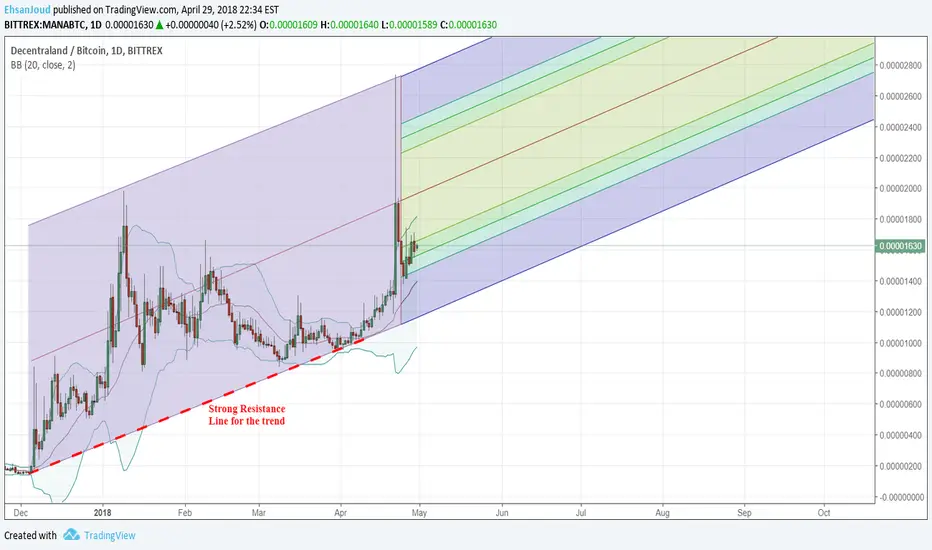
MANABTC - Bullish Trend According to the chart, using Fibonacci trend and BB indicator, MANABTC is right on the parallel trend moving upward. BB indicator, also, is presenting a new potential bullish movement in the short-term.
For a mid term and long term, it probably stays bullish as it is. The only concern is low volume!
$MANA - Decentrilized, Maybe?I have not had much luck with this coin. When i see an entry, it seems to fail on me, but I again give it a shot and im making a trade based on the following:
Price above the 10 Period Moving Average
Strong Heikin Ashi Candle and priors showing the start of a bull trend.
Stoch K line turning up. Most should wait for the K line and D line to cross but based on some lower time frames I feel this will happen.
%BB Turning positive, also moving up.
Volume is "ok" lower then the average though in the green, could be better.
I am aiming for 1897 SATS which is about a 6% gain though may change if there is a reversal. My Stop is around 1619, around a 5% loss. Semi risky trade as the volume is kind of low, though this could always spike in either direction.


MANABTC 4H BounceMANABTC bounced out of a longterm support zone on the 4h timeframe. Could be heading higher, but the volume needs to pick up to confirm the bounce.

Acceptable dealsBYE
0.00001000 BTC
TO
0.00001030 BTC
SELL
0.00001050 BTC
0.00001100 BTC
0.00001170 BTC
STOP LOSS : 0.00000900 BTC


