MANAUSD - Finished first Impulsive move After finishing the first Impulsive Wave after the big correction MANA is ready to start a new uptrend. There is a good entry chance comming up next in the wave 2 between the 61.8 and 78.6 retrace. After this move the minimum target for wave 3 is 5$.
Note: The box has been placed based on price not time
Manausd

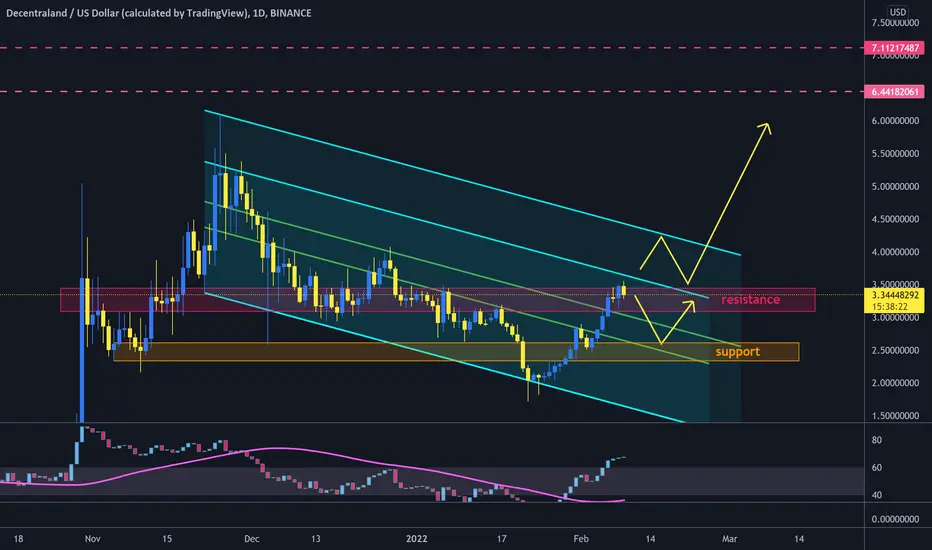
MANA, buy or go long according to the situation, TP 3.1 4.2There are two operations depending on the situation:
1. If there is a chance, step back and enter around 2.4, and stop loss below 2.38.
2. After breaking through the 2.72 line, step back to confirm the support entry.
The first target is 3.1, and the second target after the breakthrough is 4.2.
good luck!

MANA / USD 1 hour chart patterns -waiting for the bottom.I feel just by the nature of opportunity there should be more downside. if i was a market maker i would take advantage of all the unknowns in the air and push the entire market down with shorts. (I personally do not short. I buy and hold and buy and sell.) but i can see the structure. Same fear and greed. and these people are often the same as the ones who drive pumps. We all love those. It seems manipulative, and it is, but it exists in all markets as does all criminal activity. It is the energy that keeps the wave patterns moving . I think the Government oversight groups into crypto should be the same as any financial item that you own and pay taxes on. I think Right now that is the Department of Treasury. They would benefit greatly if they just simply added crypto to the treasure of the treasury. The fact that they print money and make money off of making money is a bit of a relic.
From the 2021 budget - "including $1,030.0 million
in Bureau of Engraving and Printing (BEP) costs and $65.8 million in Board costs. The
increase is primarily for higher banknote printing costs due to the demand for cash that
followed the onset of the COVID-19 pandemic"
The basic functions of the Department of the Treasury include:
Producing all currency and coinage of the U.S.;
Collecting taxes, duties and money paid to and due to the U.S.;
Paying all bills of the U.S.;
Managing the federal finances;
Managing government accounts and the United States public debt;
Supervising national banks and thrift institutions;
Advising on domestic and international financial, monetary, economic, trade and tax policy (fiscal policy being the sum of these);
Enforcing federal finance and tax laws;
Investigating and prosecuting tax evaders;
Publishing statistical reports.
Crypto could turn all of that around. Smart contracts will give more control.
the game market and the Meta World tokens will be monitored through these cross platform transactions or when converted to USD coin.
In that world i can have and use Mana all i Want in VR worlds and VR assets and only pay taxes when i transfer gain to USD whatever.
These are my hopes in my thinking of the Crytpo world. I Probably wont keep mana though. But will buy and sell if i see action. that currency climbing is the important part of the US stable coin.

MANA to $3.811MANA is in a descending triangle
Two rejections at 0.236 and 0.382 fib retracement
If bitcoin behaves MANA may reach 0.5 to 0.618 fib retracement in a week or two

MANA trend resversalMana has finally changed its trend with enhancing volumes, might see it touching level on 5 within 2 months.

ManaUsdtHello This Is My Technical Analysis For Mana Metaverse Crypto Follow & Like And If You Have Question Comment I Answer Good Days And Good Trades.

MANA: WILL METAVERSE TAKE THE MARKET BY STORM?Some points to mention regarding the chart:
1. The significant role of MA21.
2. The steady and consistent volume, albeit at lower levels compared to the previous bull rally.
3. The 2.5 - 3.5. is of great significance considering the price history in this region. The manner of breakout is consequential.

Mana to $5 path
Potential inverse head and shoulders on the 4hr and 1D chart. If it breaks above $3.5, we are going to have massive buy pressure until $5 level
do your own research before going on trades. This is my personal idea
HODL Mana folks, good stuff ahead

MANA 15 min Chart - FEB 13-14 - FED Reaction watchMANA also seems to be building up pressure. I think either way it goes tomorrow this is where i look at use case. my child introduced me to the power of game spending when i got an amex call saying they just spent 2000 on some gems to buy an outfit for a new character. This market is riding the crypto wave but is Powered by the gaming generation and has a solid reason to belief value. The fed is almost using these meeting announcements as market manipulation and honestly i wouldn't mind if they would write some bills that allow then to invest and make money and that has to go directly towards the national debt. Otherwise they skirt to much towards their own pocket and not the countries. we should be allowed, as a country, to hire a new finance manager. I vote Bitcoin.

Decentraland MANA 23% drop or 60% pumpHello all. Looking at MANAUSD on the weekly timeframe, we see that this coin has broken bearish out of the (white) falling channel/descending channel.
Currently MANA is inside the green up-trending/ascending channel. On the daily as well as on the weekly mana failed to break above the $3.5 psychological price barrier. Currently mana is due to a retest and here are the scenarios where and why the price can go next.
Bearish scenario: If mana fails to break above $3.5, I would expect mana to retest the bottom of the channel at around $2.5. This is where the daily 200 EMA is currently. From the current price to the bottom of the channel it is a 24% drop.
Bullish scenario: In case mana break above $3.5, I would look for the price to reach first the fibonacci golden pocket at $4.3-$4.5, and then $5.9 the top of the channel. From the current price to the top of the channel it is a 60% up.
The stochastic RSI is very bullish, as it has never been so oversold and with a reading below 20.
Thanks for reading, and stay tuned. Enjoy.

MANA / USD 1 hour chart patterns - minimalI have been using this method for almost a decade. I have recently started listing them here for the play function. This is not an offer of anything other than patterns i use to feel the market. I think i am hitting on a similar array used by algorithms and AI. Time will be a part of this so the play function becomes an important aspect of set paths.

Nice short-term buy signal for #Decentraland #MANANice short-term buy signal for Decentraland MANA
Chart also shows the last two comparable signals - of course never a guarantee.
What do you think - do you hold this coin? 😎
Drop me a nice comment if you'd like me to analyze any other cryptocurrency.
*not financial advice
do your own research before investing

MANA, wait for a good opportunity to buy or go longOperation: Wait for the opportunity to ambush to buy & go long
Starting price: 2.77-2.885 40%, 2.289-2.473 60%;
Stop Loss: 2.2
Goal: 4.3 4.9 Drop bags in batches, after arrival, you can choose to leave about 25% of the bottom warehouse to fight for the long-term.

MANA trend lines#MANA/USD
$MANA is inside descending parallel channel, and now struggle inside resistance zone that can be around upper line of the channel.
🐮 if it success to break out descending resistance and parallel trend line from shadow of ATH, it will head up toward $6.5 and $7.
🐻 if price reject from this descending trend line, it will drop to support zone around $2.5.
$MANA, Betting for the 'metaverse' narrative$MANA
Market bullish across the board
Betting for the 'metaverse' narrative
Looking for 4$ per #MANA
UCTS 1D Buy printed yesterday
12H showing a potential R/S flip already over the ~3.2$ area

MANAUSDT - Long - 1W💡💡#INVEST 💡💡
MANA / USDT
▶️ Buy in three block
1.35 - 1.85 (40%)
0.822 - 1.02 (30%)
0.43 - 0.62 (30%)
🔴 SLT - 1W (Trigger)
The implementation period of the idea is 3-12 months. These are very strong blocks. They are on the 1W and 1M timeframe. I think we will buy and sell on these blocks several times. I expect there to be a strong battle for the price.
#MANAUSDT_INVEST_141221

Decentraland (MANA) flipped the MA Ribbon bullish...Decentraland (MANA) flipped the MA Ribbon bullish...
But can MANA break the volume resistance at $3.28?
What do you think? 😎
Drop me a nice comment if you'd like me to analyze any other cryptocurrency.
*not financial advice
do your own research before investing

MANA- New ATHs in 2022MANA, Decentraland is a key player in the Metaverse sphere. No matter how we personally prefer sandbox and everdome, this is a bullish chart and will keep outperforming the market.
News:
BITCOIN- Updated Mini-chart
Bitcoin jumps 10%, climbs past $40,000 for first time in 2 weeks
The world’s largest cryptocurrency climbed by the most in more than three months.
The big cryptocurrencies have been largely trapped in a range over the past couple of weeks, after experiencing widespread declines in January.
Bitcoin gained the most in more than three months as investors show signs of renewed risk appetite following a volatile week across financial markets.
The largest cryptocurrency by market value jumped as much as 9.4% to $40,426, the most since Oct. 15. It hasn’t been above $40,000 in more than two weeks. Ether climbed as much as 11%. Even SOL, the native currency of the Solana blockchain that has tumbled in the wake of the Wormhole project hack, surged about 10%.
You had been warned:
1. Our projection at the last post of 2021 was a dip first to 38k (finally it was 34k) and a rise to 79k (hopefully we are JUST A TINY BIT wrong again and it goes to 80k+):
BITCOIN 2022 - 38k First - 79k Then
2. We bought the dip perfectly and shared it here with you:
BITCOIN- Is this the Rainbow
3. Despite the FUD and some negative comments from some of you, we had estimated the NFP will play a role and it did. From now on: start understanding the fundamentals:
BITCOIN - Video Update (NFP tomorrow will be HUGE!)
04:07
Hope you enjoy our charts and analysis.
One Love,
the FXPROFESSOR

MANA Decentraland: 1D Chart ReviewHello friends, today you can review the technical analysis idea on a 1D linear scale chart for Decentraland (MANAUSD).
The chart is self-explanatory. Please review the chart for all my notes.
Included in the chart: Trend line, Support and Resistance Lines, RSI, MFI, Resistance Zone, Ichimoku Cloud, Volume, Simple Moving Average.
If you enjoy my ideas, feel free to like it and drop in a comment. I love reading your comments below.
I have a bunch of additional recent charts below on cryptocurrencies to review. Check them out!
Disclosure: This is just my opinion and not any type of financial advice. I enjoy charting and discussing technical analysis. Don't trade based on my advice. Do your own research! #cryptopickk

MANAOn a 4-hour TF, The trend is negative. If it can break the resistance of $1.3 and the negative trend line with high trading volume, the target of $3.4 will activate. Otherwise, I expect the correction to the $ 2.6 range. #Mana's price floor is in the range of $ 2.3.

DecentralandOn a 4-hour TF, it is now testing the resistance of $2.75 - $2.90 area. Decentraland coin (MANA) breaks the long downtrend line, and this is a good sign. We may see a retest of the $2.50 support area before the next uptrend move. The next resistance is $3.20.

MANAUSD Long Trade
MANAUSD Long trade opportunity just kicked off at $2.802 on the 7 Hour chart which is the best timeframe for my strategy. This recent bullish candle also broke the resistance line that started on November 25th.

Almost done with the right shoulder completion. MANA imminent. As I’ve stated across the board, MANA, like the rest, is currently perfectly drawing us a Head and Shoulders that spans quite some time. We are nearly to the last burst upward to 2.8-3.0 before the waterfall. Set stop losses. Do your due diligence. This is not financial advice.
