MANA/USDT Rebounding from Key Weekly Demand Zone – Path to $1?🔶 Strong Support Zone (Demand Zone):
MANA/USDT is currently testing a major weekly support area between $0.20 – $0.30, a zone that has historically acted as a strong demand level since 2021. Price has bounced off this region multiple times, indicating strong buyer interest and potential for a bullish reversal.
🔶 Chart Pattern:
There is no classic pattern like a double bottom or head & shoulders, but price structure shows signs of horizontal accumulation, which resembles a Wyckoff re-accumulation phase—a typical base formation before a strong upside breakout.
🚀 Bullish Scenario:
If the price holds above the $0.25 support and forms a higher low, a bullish continuation is likely. The following resistance levels could serve as potential upside targets:
1. $0.3610 – Initial resistance and confirmation level.
2. $0.5475 – Intermediate psychological level.
3. $0.8109 – Former supply zone.
4. $1.0661 – Major resistance from 2022.
5. $2.7291 – $5.0666 – Long-term targets if macro bull trend resumes.
> Bullish Confirmation: A strong weekly candle close above $0.36 with high volume could spark a major rally.
🔻 Bearish Scenario:
If price breaks down below $0.25 and closes below it on the weekly timeframe, it would invalidate the bullish structure and may trigger further downside towards:
$0.13 – $0.07, the historical lows seen in early 2021.
> Bearish Confirmation: A weekly close below $0.25 with increasing volume would suggest sellers are back in control.
🧠 Conclusion:
MANA/USDT is at a pivotal point within a long-standing support zone. Holding this level could result in a strong upward move, but a breakdown would indicate further bearish pressure. Traders should watch this zone closely for confirmation in either direction.
#MANAUSDT #Decentraland #CryptoTrading #TechnicalAnalysis #AltcoinAnalysis #BullishSetup #SupportZone #TradingView #MetaverseCrypto #CryptoBreakout
MANAUSDTPERP

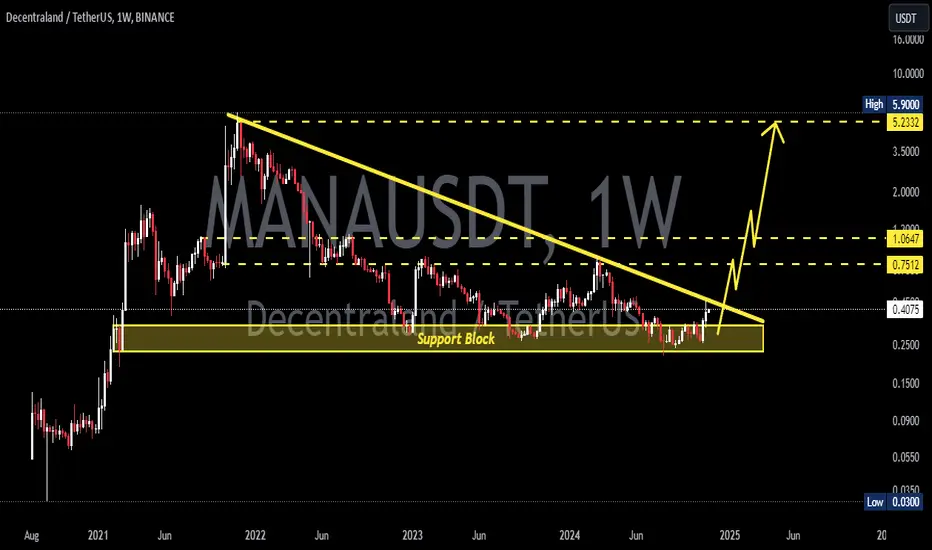
MANAUSDT 1W AnalysisMANA ~ 1W Analysis
#MANA Buy back gradually from this support block with a short term target of at least 20%+ from this support.

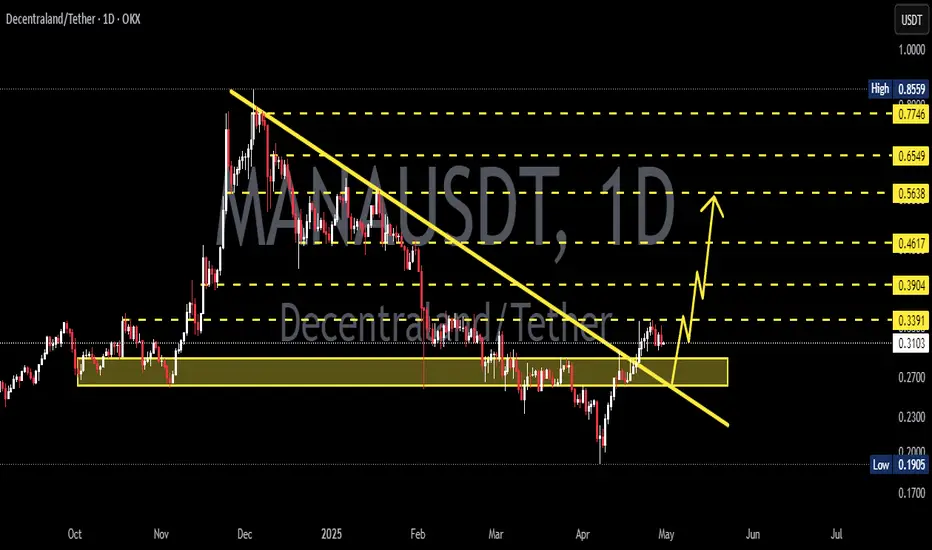
MANAUSDT 1D AnalysisMANA ~ 1D Analysis
#MANA Buy gradually from here if you still have confidence in this coin with a short term target of at least 15%++ from here.

MANAUSDT 1D AnalysisMANA ~ 1D Analysis
#MANA Buy gradually when re -testing this support with a short -term target of at least 15%+ from here.
MANAUSDT Huge Bounce Incoming?MANA is currently testing a long-term descending support trendline on the weekly chart. This level has acted as a reliable bounce zone multiple times in the past (highlighted with arrows).
-Price is holding above a major support level (~$0.21), showing signs of demand.
-Weekly RSI is forming a bullish divergence, with higher lows on RSI vs. lower lows on price — often a precursor to trend reversals.
-Previous touches on this trendline have led to significant rallies.

MANAUSDT 1WMANA ~ 1W Analysis
#MANA Buy gradually from here if you still have a Conviction on this coin with a short -term target of at least 20%+.

MANAUSDT 1WMANA ~ 1W Analysis
#MANA If you still have a Conviction on this coin,. This is a very good support for now. buy gradually with a minimum target of 20%+

Decentraland at Pivotal Level: Can Bulls Push Above $0.59? MANA/USDT (Decentraland) chart shows the price trading just below the key support zone of $0.55-$0.59.
This area is crucial for determining the next directional move, as a reclaim of this zone could trigger bullish momentum, while a failure to regain it may lead to further downside.
DYOR, NFA

Manausdt Lookd Ready for a Flight (Swing)Analyzed this and this looks good here worth taking it.
Entry DCA under 0.5100.
Invalidation clean breaking below 0.4900(think won't happen ATM)
Note: Not a Financial Advise.

MANAUSDT 1WMANA Update ~ 1W
#MANA At Time frame 1W,. EURONEXT:MANA rejected by this local resistance. The best way for now. You can buy back when this resistance line is retested or you can place another purchase on this support block.
these two scenarios with a target of 20%++

MANAUSDT Set for Channel Breakout!MANAUSDt Technical analysis update
BINANCE:MANAUSDT price has formed a descending channel on the weekly chart, which has been developing over the past 930 days. The price is now approaching the channel's resistance line, with rising volume observed in recent weeks. Additionally, the price is trading above the 100 EMA. Once the breakout is confirmed on the weekly chart, a strong bullish move can be anticipated.

MANAUSDT 1WMANA ~ 1W
#MANA This chart is very interesting,. It is very bullish if this resistance line is successfully broken. if you still have Conviction on this coin. Buy in stages starting from here. minimum target 20%++
#MANA/USDT#MANA
The price is moving in a descending channel on the 1-hour frame and is sticking to it well
We have a bounce from the lower limit of the descending channel and we are now touching this support at 0.2980
We have a downtrend on the RSI indicator that is about to be broken, which supports the rise
We have a trend to stabilize above the 100 moving average
Entry price 0.2988
First target 0.3045
Second target 0.3121
Third target 0.3200

Mana/Usdt Idea The Mana/USDT trading pair is currently showing signs of a breakout on the 4-hour timeframe, emerging from a triangle pattern. This indicates a potential shift in market dynamics, with a possible bullish momentum in the short term. If this breakout proves successful, there could be a price surge of 30-60% in the near future.
It's crucial to emphasize that this analysis is not financial advice. It's highly recommended for individuals to carry out their research, known as DYOR (Do Your Own Research), before making any trading decisions. By conducting thorough research and staying informed about the market trends, investors can make more informed choices in line with their financial goals and risk tolerance levels.

🚨#MANA/USDT Long#MANA
The price is moving in a perfectly formed head and shoulders pattern
We have a higher moving average of 100
The rise is expected to continue to complete the model based on 4 goals
Entry price is 0.4611
The first target is 0.4779
The second target is 0.4935
The third goal is 0.5172
The fourth target is 0.5378

📊#MANA will rise according to the double bottom structure📈🧠After completing the correction at the daily level, we established a double bottom long structure in the buying zone at the daily level. If we can successfully break through the short defense point, it means that we will hope to challenge the previous high.🙏
Let's see👀
🤜If you like my analysis, please like 💖and share it💬
💕 Follow me so you don't miss out on any signals and analyze 💯

Mana Parabolic?Looks like Mana setting up for strong move to the upside.
Already longed in spot mentioned in previous idea.(linking)
Longed 5550 with margin.
Invalidation and stopping if holds below 0.5500.
Possibly can expand in next daily candle or maybe next two candles.
Targeting 0.72 and above
Risk Reward from here is pretty solid.
Note: Not a Financial Advice.

MANAUSDT Trend Line Breakout!MANAUSDT Technical analysis ypdate
MANA's price is approaching the trend resistance line, and volume has been gradually increasing over the past month. If the price breaks out above this resistance level, we can expect a significant upward move.
Regards
Hexa

MANAUSDT"Daily crypto market analyses I provide are personal opinions & not financial advice. Trading carries risks, so do your own research & seek advisor's help."
Don't forget to like and comment

Mana PlanManausdt
Moving in triangle pattern expecting 25-20% bullish move short-term
Persnol opinion not financial advice
Dyor
If you are satisfied with our work kindly support us (Like & Follow)

Decentraland MANA price can be one of 1st to start a rising waveToday we will talk about the prospects for the price of the Decentraland token - MANA
But first, please like our previous idea MANAUSDT, which has perfectly worked out the sales area and recently the purchase area for 4 months.
It looks like the MANAUSD price has completed its correctional wave (2) and is now trying to start a growth wave (3).
Wave (3) is considered to be the longest, and given that there are many liquidity zones above, the path of growth will not be easy.
However, we have schematically depicted on the chart how the growth and correction waves can look like.
The intermediate targets for MANA's price growth are $0.90 and $1.85.
The final selling zone for MANAUSDT, which is now visible in the probable wave (3), may be in the area of $2.25-2.50.
What do you think, will such a positive scenario work out given the current pessimistic sentiment in the cryptocurrency market?)
_____________________
Did you like our analysis? Leave a comment, like, and follow to get more

MANA Big move coming! (Long entry setup)Mana has strongly changed character from a key point, I expect a minor pullback validating the change of character and a move up from here!
NFA

MANA BUYDear valued ones. A good mana coin to buy. The long-term . How much do you notice in the analysis? The currency managed to make gains. The descending channel was broken. It also broke a strong resistance. At the price of 600 . The currency is now in an accidental state.
