BTC rebound is comingOn a 1-day scale, the market is too oversold: Stoch RSI has pushed its lower limit and is already starting to rebound, RSI in the oversold area, where it can also unfold. Below meets tight support near the level of Fin 0.786, within the cost of 4800-5000, but to decrease further to these levels without a visible correction of the fall (rebound or flat), the market can not, Bitcoin lost 29% of the value in just 17 days. In addition, the price is not the first time approaching the 6000 mark, it is very important that it does not go lower, which indicates good support at current levels. As long as the daylight candle did not close below this level, we still have chances for a further positive development scenario, otherwise closing the candle below will indicate the possibility of further decline.
Manipulation

Higher lows for the first time since December?????????????With stochastic being so low, and TDseq showing perfect candle #9 sitting at an important support, followed by a good green candle with acceptable Volume we can hope for a higher lows formation (based on closing daily price, for the first time since Dec that the downtrend started. If price can keep going up and breaking the $6800 are this will happen, and we might finally see higher highs, which will be a huge confirmation of the rally starting and fresh money coming in probably!!! If price cant pass ~$6800 it can go down to below $6000, not that it would happen for sure if price cant pass ~$6800 but there is chance of this happening.
Educational: TDseq indicator gives candles numbers, and indicates the trend, red numbers for downtrend and green for uptrends. Look at the previous rally and downtrend we had! Yep, almost a perfect 1-9 counting in both uptrend and downtrend, indicating that happened so fast, and there was such a strong trend. To me having a strong uptrend, even minor, followed by a strong downtrend, doesn't seem to be normal. I believe there is a mix of manipulation and emotions (FOMO and Panic sell), this helps to get rid of emotional investors (referred to as weak hands) which helps to have a healthy rally in the future.
So the most important thing right now is if the price can break ~$6800 area and stay above it or not.
Remember that "The stock market is a device for transferring money from the impatient to the patient."
Garyreza (@Analytca)

ETH good level for open long-term trade#ETH
Ethereum at current levels looks very good for long-term purchases, but in the short term, before building a new wave of growth, the market can survive lower (we have already seen such behavior of prices among crypto-currency assets). The possibility of plum before the beginning of growth is due to manipulative influences from the major players, no one will give up the opportunity to buy the top asset at an even lower price. Artificially, the price can be lowered to 330-340 (possibly up to 320), it will be extremely difficult to lower below, in any case, such a drawdown is possible for an insignificant and short term, since the technical aspects and popularity of the coin itself will not allow for a long time to be oversold, and specifically with Ethereum it is not profitable for anyone. In long periods, ETH has a very good chance of touching its absolute maximum and eventually overcome it. Pay attention to the asset from the current levels, but do not forget about the possibility of a speculative decline in the global market as a whole, which will also affect Ethereum.

ETF rumour is followed by a massive manipulated pumpsWell, I am still bearish because the biggest picture hasn't enrolled yet. Regarding my latest post we are in a retracement. Watching the value increase compared to it time schedule and the normal candle values vs time, the only one conclusion can be made, it's a manipulated pump. During my master study I did some investigation into these pumps. Its increasing and a shame to gain trust by the retail buyers. All those yellow eclipses are suspicious pumps to my perception. Problem, you can't prove and no regulation so no penalties. Sad!
Save trades and look out. Also TA's become unpredictable. I'm away for while. Little vacation.

cme control the marketin chart you can see cme futures control the market and those investor / invest only on bitcoin 3.38% and on this scenario altcoin doomed to fail. vol insanely picking high and this market manipulation with futures is a old joke and old scenario .
good luck.

BTC manipulation - compared to ETH/LTC/BCHIt is interesting to compare the charts of the main coins. Let's take BTCUSD and ETHUSD for now (LTC and BCH follow ETH closely). BTC has clearly been sustained, whereas ETH/LTC/BCH followed an expected retrace. This shows to me that there is an ongoing effort currently to push the BTC price up, while there is no such effort on the other coins. Is that good or bad? It could go both ways : either the current manipulator(s) decide(s) to push it further up, or pull it down. One could see it as a guardian angel, or a damocles sword over our heads.

Let me tell you something about BTC.Hello my Dear Followers.
I'm Feeling like they might set a bull trap, pushing higher above 7800 up to 8200.
Before the next bear run will start.
Faking the H&S pattern.
Also with same pattern like previous small bullish momentum.
Right now we can see obviously we have a bullish pressure, but all depends how we will react to 7800.
Longer term, attached with planned news i do expect fall in between 3500-4500.
Everyone will be shorting at 7800 and pushing price to 8200-8400 would be extremely profitable for whales. Another bear run from 8200-8400 is really possible. But i have even greater news. Next bear run will be really bad for most of The alts. There is huge possibility that alts Could die up to 60-70% from current prices as BTC will gain dominance. So for us later would be The Best opportunity to buy alts at new crazy lows so we’ll be ready for 10x gains this year!

BTC - ETH Manipulated Inverted HS (continues)At this time...
This pattern is holding so far... and..
I am republishing this chart because of new possible events that will effect the pattern.
Most notably.. on AUG 16th, the SEC will decide on allowing or repealing CBOE's request to sell ETFs.
If approved, this will be historic news...
A bull run should happen right then and there, regardless of price or current trend.
If rejected
A bear rally or at least sharp movement down could occur.
I also speculate..
that manipulators will try to influence price a few days before Aug 16th.

USDCAD Daily Long Term Thoughts.Here is some simple analysis for the USDCAD Daily.
These blue levels are some ''Obvious'' levels that could cause a bit of fluctuation in price and therefore some LTF Setups.
I will pay close attention to these levels purely for their significance on the daily chart, These levels could be possible for stophunting or give setups in terms of reversals but especially continuation, If price manages to move down for a while and nearing the lower blue zones i will watch closely for these levels to have not a single reaction, as for the way i trade i can find very likely continuation setups based on the fact if price does NOT react upon FTB.
These white levels are just there for myself, as i expect these levels very able to whiplash price around, Only in very fortunate PA i will maybe look for setups on the LTF in these white zones, but probably wont trade these.
However there is a small little side note with the bottom white zone, There is a blue zone on a very ''Obvious'' level very close above the white zone, Again i will have to see how price develops but there is the possibility of some manipulation here, What exactly am i talking about? Read this:
1. Blue zone gets hit = Initial Buyers pulled in (Maybe some PA to lure in more buyers)
2. If and when blue zone gets broken = Buyers most likely stopped out aswell as Breakout shorts joining the party, could make some false retests aswell to lure as many sellers as possible.
3. Price has lured in the shorts and continues to rally upwards very strongly to also stop out short orders, I expect this to be a strong and powerful upmove purely for the fact that big bullish candles scare short traders to re-enter, and makes possible buyers stay out because it plainly scares them.
4. Long story short i am expecting a bit of ''Market manipulation'' in and between the blue/white levels at the bottom of my chart.
The results of these zones will show over time, still a long way away until we will get close to hitting all levels, if at all!
Until then, trade with caution and ofcourse always go full margin on scalps boys and girls.
(Seriously dont go Full margin though)

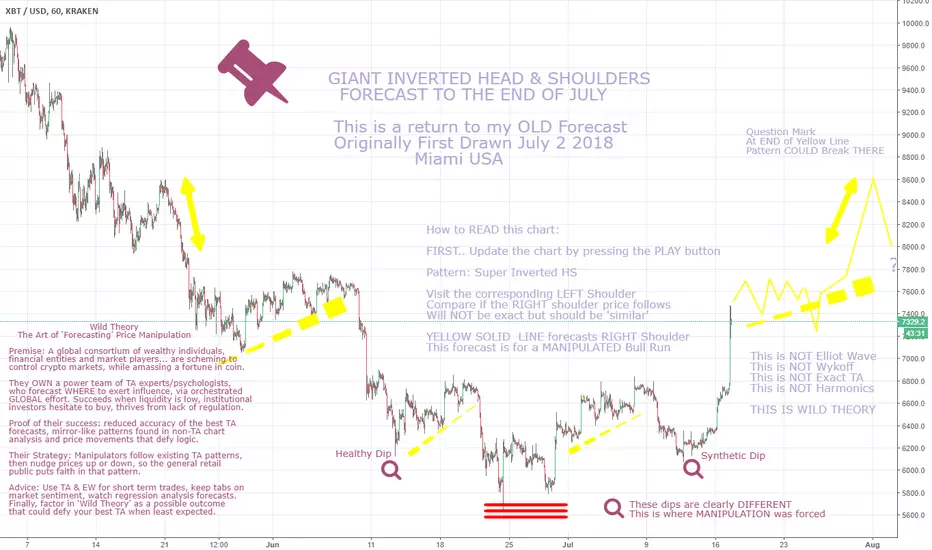
BTC- ETH: Returning to Previous July 2 Manipulated Inverted HSMany of you were NOT happy with my support of the TA that indicated prices would fall further and lower.
I was SUPPORTING the respected TA of my favorite authors.
This goes to show that TA is not perfect, EW is not perfect, Wykoff is not perfect, Fundamentals can be off
Manipulation overrides everything.. all logic and all sensible analysis.
What is happening on the price charts should NOT be happening... but yet.. it is.
So I went back to my previous chart I did on July 2nd and redrew a newer version.
This might make some of you happy.
(My flight was delayed and I had time to kill, so this is my gift to my followers)
Will this map HOLD?
I think it will start to deviate (as in the left side matching the right side) where I have posted the ?
However.. if we get THAT far.. this is a great chance a recovery will happen.
FOMO will take over and a new run to 10k will begin.
BTC - ETH - Yes... even good TA suggests new bottom coming...The manipulators have been very careful this month...
Natural market forces predominate... and the price we are at today makes sense.
Yes, markets in alt coins are expected to be repressed during the summer time.
All this will change when new money enters the market.. which is already starting to happen.
We need to be watching for fundamental market 'wins' in August; specifically approval of ETFs by the SEC..
followed by institutional investors who start to use the new custodian solutions; like those offered by Coinbase.
The big optimism is coming for the last quarter in 2018, with a glimmer of hope starting September.

BTC: get your tin foil hat outInteresting thing I discovered today. Check out price action at every 16:00. Large red or green (mostly red) candles right around that time, very day. Who's building all these Marg and Bart heads? When will it stop? :)

Mutated Inverse Head And Shoulders- we all see it (BTC)Hi lads,
I stopped charting and looking up TA for a while.
IMO the manipulation is and was at such a high level that no chart was helpful. Anytime shorts built up, they'd pump it up 200-300 dollars. Longs would build up, they'd dump it (the exchanges themselves). So it was just a guessing game.
Anyways, in the perfect world it'll make something like this. But since many others are betting on a similar chart... will the Market Makers allow it to happen?
You be the judge, Good luck to all!

BITCOIN: 48h pump pattern | price manipulation at its finest!hi there.. i just have to upload this. Another great example how this market is played by big whales and cartels. Its sad to see that only like 3000 BTC's can influence the total mcap and price of bitcoin this easily.
If in the coming 60 mins another pump appears.. we would have an exact 48h pump pattern since 6 days straight. Still we need to break 6800 and build a new floor above this to break 7200$ with enough volume (green line from falling grand wedge). RSI should stay above 45.
Play the waves.. stay save..
Cheers

Market slaughter housesIn this screencast and links below I expose what's going on in market manipulations.
In essence large organisations - who shall remain nameless - are busy buying back their own stock in an attempt to stabilise Wall Street and other markets. This is likely to give small investors a sense of security that they should buy stock. Price - to the minds of the big boys - is likely to move north as the small fish come in. Then the big boys sell off!! Oh sure - this is a gamble by the big boys. How big? Nobody really knows for sure. Estimates are in the region of Trillions of US dollars.
Yes the big boys have a secret 'war chest' with which to fight the markets. And the 'big' manipulate money out of the pockets of the poor. This is Corporate America - innit?
References:
1. Corporate buybacks keeping the markets afloat (at this time).
2. Why would a company buy back its own shares?

Manipulated BTCUSD price - Bull Market is hereSo to me this chart is a clear example of price manipulation. It looks like BTC reversed from bearish to bullish across most market participants June 24th. Price has been making a slow wedge up except for the 29th when CME futures contracts expired. It was a perfect push down for the close of the trading day to close out short contracts that opened back in december. Then followed by a strong rally back up into the wedge by the end of the day. In my mind we will continue in this wedge until a breakout that will most likely be up. As long as we stay above 6500 for the next day or so i think we'll continue this rally all the way back up to $10k in the mid term.

BTC - the WILDEST THEORY YET - a Manipulated Bull Run???Price Manipulation is NEVER Random.
Seen so many small/giant Head and Shoulder formations, I have lost count.
And this could be a new one about to happen, but on a super grand scale.
For those of you that are new... Head and Shoulders is exactly what it sounds like...
- A price 'peak' forming the head, with the left and right peaks called shoulders.
- Regular H&S is often a bearish play; it results in a reversal leading to big price drops
- Inverted Head and Shoulder patterns usually end with a reversal to a rise; BULLISH.
- These patterns can break, they are not fool proof
- If the pattern holds, you can use the left side of the pattern to forecast the right
- It is not perfect, but it does give you general direction
- You still need to do daily TA when using this pattern, it is never a perfect mirror
NEXT DISCUSSION
HOW manipulation would make this happen in the current market..

BTC- ETH - Hyo Cloud slowing Price - Drop should ResumeVolume is very low...
And more or less, it's why the bulls have not recovered much ground.
Price manipulators are being VERY careful, as the Feds are watching...
but they will make a move sooner or later

Binance hacked? Price manipulation being prepared? Whats up?As you may have observed, trading on Binance wasn't working today for several hours ("maintenance purposes"). Now in the Binance app I see this message, one hour old:
"Fellow Binancians,
Due to a warning from a pre-trade check in our risk management system, we will postpone the start of trading and withdrawals.
Please stay tuned for more information regarding the reopening of trading and withdrawals.
We apologize for any inconvenience and thank you for your patience.
Thanks for your support!
Binance Team"
What is going on? Warning, risk management?? Are they being hacked, or are big whales depositing a lot and getting ready for big move? Is some market manipulation being prepared? What is going on? This doesnt make me feel safe very much.
Thanks and best regards!
Tomas
2018/06/26

Bitcoin cycle update: this is not a "triple bottom"This is a continuation of my "Bitcoin absolute worst case scenario, possible bottoms" I would recommend looking at that to explain this a little better. Just waiting for institutions to take the short positions for themselves distribution consolidation pattern until we get a nice big drop.

BTC 666 PART 3A lot of people (me too) was expecting FIFA 2018 like a boom for Bitcoin.
WE ALL WERE DECEIVED
Bitcoin started dropping at 6660 USD, Think as a whale or manipulator from dark forces,
Bitcoin is being accepted as payment method in FIFA 2018, so it means this mvthaf*ckers need to dump the price in order to fill their bags because if btc is cheap, bitcoiners in fifa will have to give more btc for each thing they pay for.
NOW Bitcoin has being manipulated for dark forces, THIS part 3 is the 4th post from me taking about BITCOIN and 666 relationship. Wake up.
Can't you believe it??
Please Go, read them and see the charts by your self, it doesn't to be exact but goes around 6660 USD,
We just have one thing to do, learning to think as these mvthaf*ckers.
In my humble opinion, please DYOR before dropping rocks on me.
Peace.
Darwinco

ETH - BTC Market is 50-50 bearish/bullish today.. what now?Been visiting the BEST TA pros on TradingView
No one is certain which way we are going.
Indicators and Fundamentals are all over the place.
Will be reporting more on this as things develop over the next few days.
Manipulation Report:
I see evidence of SHORT TERM manipulation by AI bots
This is NOT major... and the big manipulation forces seem to be waiting
For what, I do not know.

Bitcoin Manipulation pattern?I've been recently been reading some books and articles by Richard Wyckoff, who traded manipulation patterns in the stock market around the year 1900-1910. I believe looking for these patterns could be useful in crypto-currencies, as they share the low liquidity and high ease of manipulation of the stock market at the time Wyckoff was trading.
This pattern could indicate that institutions and manipulators are distributing their bitcoin into the market. According to Wyckoff (and common sense), a manipulator can not dump all their bitcoin in one go without them selling for less than they would like, because of the lack of liquidity. They instead look for liquidity pools where retail traders will look to buy, or be forced to buy (short sellers stop losses). Once the manipulator has increased the supply of bitcoin in circulation, the price should eventually drop.
This is a possible trade, after visiting one more liquidity pool. I'm still only testing these ideas so i'm putting in a very small short trade.
