MANTA/USDT – Bullish Structure Forming MANTA/USDT – Bullish Structure Forming
MANTA is showing early signs of a trend reversal, with multiple confluences indicating strength from the bulls. After a prolonged downtrend, the asset has not only broken key resistance levels but also flipped the 50 EMA, a major dynamic resistance, into support.
✅ Key Technical Highlights:
Double Bottom Formation:
The chart has clearly printed a double bottom, one of the most reliable reversal patterns.
This formation suggests that bears are losing control and buyers are starting to step in with conviction.
Breakout Above the 50 EMA:
Price has decisively broken above the 50 EMA (~0.2127), which had previously acted as dynamic resistance during the downtrend.
Notably, the price retested the 50 EMA and successfully bounced, confirming it now as support.
Resistance Flip to Support:
The previous horizontal resistance zone has been breached and retested, reinforcing its role as a demand zone.
Market Structure Shift:
Lower highs and lower lows have now transitioned into higher lows and higher highs, signaling a structural shift from bearish to bullish.
Momentum and Candle Structure:
The bullish candles post-retest show strong momentum with minimal upper wicks — a sign of buyer strength.
Mantausdtanalysis

MANTA Breakout Trade Setup – Long OpportunityMANTA has broken out of a clean ascending triangle formation, confirming bullish strength. The breakout happened just above a key horizontal resistance and the 50 EMA, flipping both into support.
The chart shows a strong impulse candle on breakout, with a well-placed stop below the ascending trendline and a healthy 4.5R risk-reward to the upside. RSI sits near neutral (50.86), suggesting there's still room for price expansion.
DYOR, NFA

Don't miss this jump on MANTA!Hi fellow traders, MANTAUSDT is ready to make a move higher after completing the complex correction in WXY formation. Target the 1.4961 level. Good luck and trade safe!

MANTAUSDT 1WMANTA ~ 1W
#MANTA This support block has so far kept prices from dropping any lower. If you still have Conviction on the coin,. This support block would be a very good buying place for now,. Buy in stages with a minimum target of 20%+

Will MANTAUSDT Break Out or Break Down? Critical Moment ApproachYello, Paradisers! 🚨 Are you ready for the next potential breakout, or are you about to miss a crucial move? Let’s dive into MANTAUSDT and see what the charts are telling us!
💎MANTAUSDT has bounced off a key support zone and has shown a Change of Character (CHoCH) towards a bullish market structure. Additionally, a bullish divergence has formed, further increasing the chances of an upward move.
💎While the probability of a rise looks high, caution is essential as the price approaches the resistance trendline. If the price breaks through this resistance with strong candles, it will signal bullish strength.
💎Should the price break out and close a candle above the resistance zone, we could see the formation of a W-pattern structure, significantly boosting the likelihood of a bullish move.
💎However, if the price breaks down and closes below the support zone, our bullish outlook will be invalidated. In that scenario, it’s wiser to wait for better price action before making any moves.
Strive for consistency, not quick profits. Stay patient, disciplined, and keep those emotions in check, Paradisers!
MyCryptoParadise
iFeel the success🌴

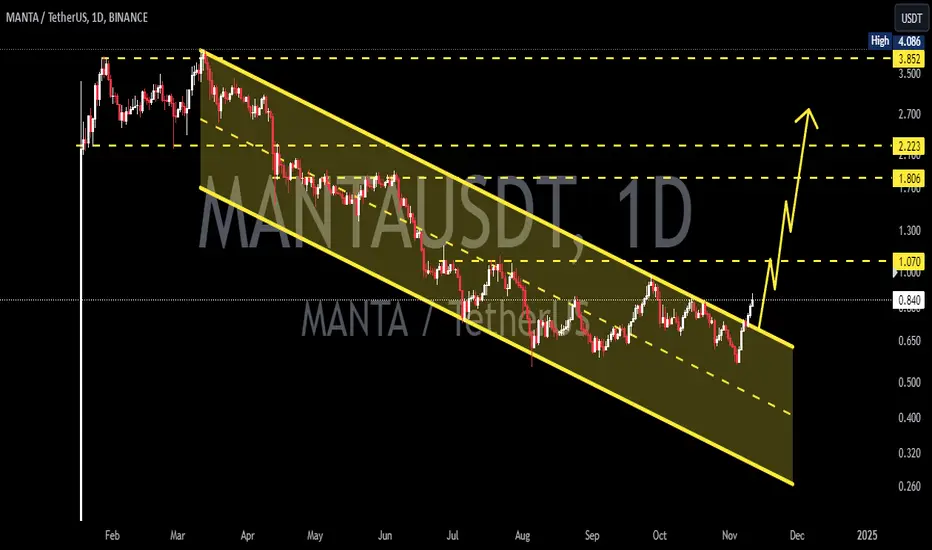
MANTAUSDTMANTA ~ 1D
#MANTA Looks very good,. After successfully getting out of this descending pattern.
We do not give you a recommendation about this coin. But if you still have Conviction on this coin,. you can buy gradually when retesting the Support Line in this pattern. Target 10%+++