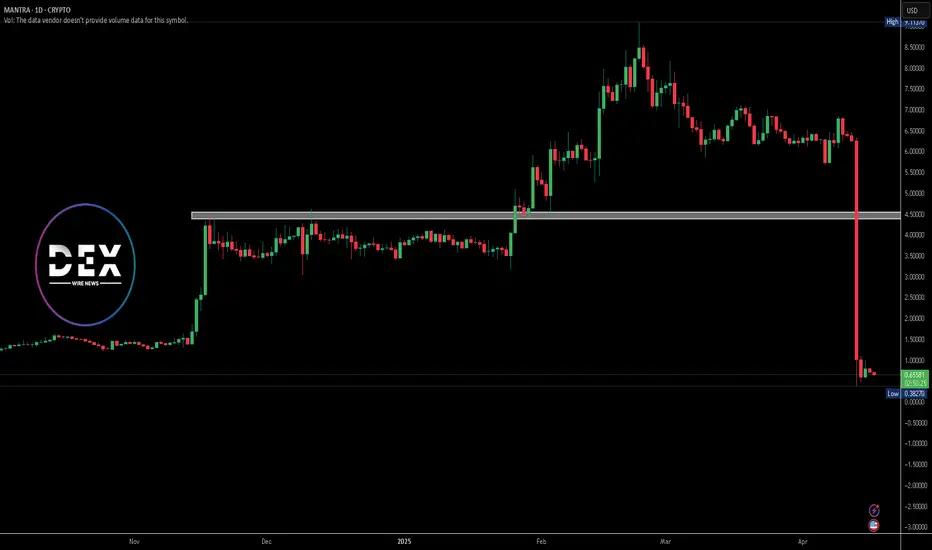
MantraDAO Easy 810% Target —Sell High, Buy Low!Just as selling and profit taking happens naturally when prices trade high near a new All-Time High, buying also happens naturally at support.
OMUSDT was trading at a new All-Time High in February 2025 and smart traders and holders took profits. This taking profits results in a long-term higher low and a new buy-opportunity.
Always remember, never buy when prices are high up or after a strong bullish wave. Why? Because whales tend to sell when prices are high. Only buy when prices are low.
OMUSDT is trading pretty low right now compared to February 2025. We had 96% correction, but the correction bottom is still a very strong higher low compared to the start of the bullish cycle and wave. After the correction is over, which in this case is early May, we will have a new growth wave.
Easy target can be seen on the chart as 810%.
It can go higher and this is a new All-Time High. We are going with the easy target for this one. An easy trade.
Namaste.
Mantra

Where Can We Rebuy OM? (1W)After the heavy drop, it became evident that a bearish trend had started, and the price is now seeking high-liquidity (buy) zones.
Based on the chart, the green zone stands out as the best area for a potential rebuy — it could launch the price upward by 100% to 500%.
Reaching this zone may take several weeks or even months.
A weekly candle closing below the invalidation level would invalidate this outlook.
For risk management, please don't forget stop loss and capital management
Comment if you have any questions
Thank You

After a -90% Dump, MANTRA(OM) Finds Support!!!Today, I want to analyze the MANTRA ( BINANCE:OMUSDT ) projec t for you, which fell by more than -90% on April 13 .
What is MANTRA(OM)?
MANTRA (OM) is a DeFi + RWA (Real World Assets) focused project aiming to bring real-world assets like real estate and bonds on-chain. Built with the Cosmos SDK, it’s developing a purpose-built layer-1 chain to facilitate tokenization and institutional adoption of RWAs.
The main crash reasons:
Massive forced liquidations on exchanges
90% of the token supply reportedly held in a single wallet
Rumors of a rug pull (which the team denied)
Team Response:
MANTRA’s team has launched an internal investigation
Plans for buybacks and token burns are underway
They reassured the community that team tokens remain locked and untouched
-----------------------------------
Technical Analysis:
Now let's take a look at the MANTRA(OM) chart on the 1-hour timeframe .
After the fall on April 13, MANTRA(OM) reacted to the Heavy Support zone($0.45-$0.20) and started to rise again (upward correction) .
From the perspective of Elliott Wave theory , MANTRA(OM)'s big fall can be considered as a main wave 3 , and it seems that MANTRA(OM) is completing a main wave 4 . The main wave 4 could be a Double Three Correction(WXY) . Since the momentum of the main wave 3 was high, there is a possibility that main wave 5 will be a Truncated type .
I expect MANTRA(OM) to start rising from the Potential Reversal Zone(PRZ) and rise to at least $0.76(+30%) ( First Target ) and then attack the Resistance zone($1.10-$0.84) ( Second Target(+60%) ).
Do you think the MANTRA(OM) project can return to its good days?
Note: If the MANTRA(OM) falls below $0.500(Round Number), we can expect further declines.
Please respect each other's ideas and express them politely if you agree or disagree.
MANTRA Analyze (OMUSDT), 1-hour time frame.
Be sure to follow the updated ideas.
Do not forget to put a Stop loss for your positions (For every position you want to open).
Please follow your strategy and updates; this is just my Idea, and I will gladly see your ideas in this post.
Please do not forget the ✅' like '✅ button 🙏😊 & Share it with your friends; thanks, and Trade safe.

OM Token Plunges 92% as MANTRA Initiates InvestigationOn April 13, MANTRA’s native token, OM, experienced a dramatic 92% drop in price, plummeting from over $7 to just $0.66. The sharp fall occurred around 18:28 UTC during a period of low market activity. This sudden crash erased most of OM’s recent gains, bringing the weekly loss to -89.73%. As of now, OM trades at $0.6591 with a daily decline of 9.68%. The token holds a market capitalization of $634.76 million, with 24-hour trading volume at $387.43 million, reflecting a 42.99% drop.
MANTRA’s CEO, John Patrick Mullin, addressed the incident, clarifying that the collapse did not stem from any internal activity. He blamed the crash on “reckless forced closures” by centralized exchanges. Although no exchange was named, Mullin expressed concerns over the influence and decision-making power of these platforms, particularly during low liquidity windows such as Sunday evenings.
In response to the unexpected decline, MANTRA launched an internal investigation to identify the root causes and verify the token’s current circulating supply. To restore investor confidence, the project also announced a token buyback and burn program. These actions aim to support holders and reinforce OM’s long-term stability.
Technical Analysis
The OM/USDT chart reveals aggressive selling pressure signaling panic selling. After peaking near $9.11, the price sharply reversed, erasing months of gains. The absence of any meaningful volume during the crash suggests that liquidity dried up rapidly, leading to cascading liquidations. The price now hovers around a potential psychological support zone, but sustained recovery will depend on renewed demand and market confidence.
Phemex Analysis #73: Pro Tips to Trade OM Upon the 90% CrashMANTRA (OM) experienced a dramatic price crash of over 90% last Sunday (April 13th). While many initially suspected a "rug pull" event, similar to what happened with Luna and FTX, OM Founder JP Mullin attributes the massive sell-off to forced liquidations at an exchange, triggering a panic sell-off. While the exact cause of this 90% crash is still unconfirmed, this volatility presents significant trading opportunities.
We suggest that traders use smaller time frames, such as 1-hour or 15-minute charts, to identify more trading opportunities in this volatile situation.
Here are possible scenarios on the 15-minute chart:
Possible Scenarios
1. V-Shaped Recovery
If strong buying pressure emerges and quickly pushes the price back up to pre-crash levels, it could signal a V-shaped recovery. This would indicate that the market has absorbed the sell-off and buyers are back in control.
Pro Tips:
Watch for large green candles with significant volume on the 15-minute chart, that rise above $0.89 or $1.0.
Consider entering a long position on the breakout above key resistance levels ($0.89 & $1.0).
Place a stop-loss order below a recent swing low to protect against a reversal.
2. Consolidation and Accumulation.
The price may consolidate in a range after the crash, as the market tries to find a new equilibrium. This consolidation phase could represent a period of accumulation, where buyers are slowly absorbing the remaining supply.
Pro Tips:
Identify key support and resistance levels within the consolidation range, which is $0.89 to $0.73 or $1.0 to $0.55.
Consider range-bound trading strategies, such as buying near support and selling near resistance.
Alternatively, use Phemex Grid Bots to capitalize all the small price movement during the accumulation phase.
3. Further Decline
If the selling pressure continues or new negative information emerges, the price could decline further. This scenario would be characterized by continued large red candles and a lack of significant buying interest.
Pro Tips:
Monitor key support levels ($0.73, $0.55 & $0.45); a break below these levels could trigger further selling.
Consider exiting any long positions to avoid further losses.
Be cautious about entering new long positions until a clear bottom has been established.
Consider shorting opportunities if the price breaks down through significant support, but manage risk carefully.
Conclusion
The 90% crash in MANTRA (OM) has created a highly volatile trading environment. While the cause of the crash remains debated, the current market conditions offer substantial trading opportunities. By analyzing price action on smaller time frames, such as the 15-minute chart, and considering the scenarios outlined above, traders can potentially profit from both upward and downward price movements. However, it is crucial to exercise caution, manage risk effectively, and stay informed about any new developments related to MANTRA (OM).
Pro Tips:
Elevate Your Trading Game with Phemex. Experience unparalleled flexibility with features like multiple watchlists, basket orders, and real-time adjustments to strategy orders. Our USDT-based scaled orders give you precise control over your risk, while iceberg orders provide stealthy execution.
Disclaimer: This is NOT financial or investment advice. Please conduct your own research (DYOR). Phemex is not responsible, directly or indirectly, for any damage or loss incurred or claimed to be caused by or in association with the use of or reliance on any content, goods, or services mentioned in this article.

Is Mantra OM The Next Luna?Hello, Skyrexians!
This Monday was calm until the huge drop on BINANCE:OMUSDT has not interrupted us. In 1 hour price dropped more than 80% and now Mantra's holders are panicking is this coin scam or not. It's almost useless to have any strong technical analysis, but as we know this coin dropped because of rug pull. In case of Luna scam we have seen the infinite coins printing, so its price became 0. OM only has the negative news without any algorithmic issues.
We can only apply Fibonacci levels on the log scale and we can see that there is a chance that this is only the wave A inside 2. If $0.2 will be held we can have a chance for the scenario on the chart, otherwise it's scam!
Best regards,
Skyrexio Team
___________________________________________________________
Please, boost this article and subscribe our page if you like analysis!

Breaking: MANTRA coin ($OM) Nosedived Nearly 100% Today MANTRA, a Security first RWA Layer 1 Blockchain, capable of adherence and enforcement of real world regulatory requirements that is Built for Institutions and Developers, offering a Permissionless Blockchain for Permissioned applications saw its native token Mantra Coin ( CRYPTOCAP:OM ) plummeted 94% today amidst falling out of a bearish symmetrical triangle.
The bloodbath came as a shock as days ago it was sitting on a market cap of $6 Billion and major deals were iterated, including a $1 Billion tokenization pact with DAMAC.
However, the main trigger was an allegedly suspicious 3.9M CRYPTOCAP:OM deposited (linked to team wallets) to OKX, fueling sell-off fears.
Key Allegations
Team controls ~90% supply – raising manipulation concerns.
Undisclosed OTC deals – tokens reportedly sold at 50% discounts.
Exchange liquidations – forced closures worsened the crash.
However, Binance CEO Said:
"OM CRYPTOCAP:OM 90% price crash was due to massive cross-exchange liquidations, tokenomics changes, and large token dumps".
In response to an X post, the Mantra team said:
"we want to assure you that MANTRA is fundamentally strong. Today’s activity was triggered by reckless liquidations, not anything to do with the project. One thing we want to be clear on: this was not our team. We are looking into it and will share more details about what happened as soon as we can."
Technical Outlook
As of the time of writing, CRYPTOCAP:OM is down 28.6% according to the 4 hour price chart. the asset is showing signs of a reversal but the diamond hands are weak prior the extreme token sell-off as hinted by the RSI at 11.51, this is extremely oversold with a possible reversal lurking around the corner, should the team figure out the cause of the bloodbath, CRYPTOCAP:OM might reclaim $1 zone and then possibly the $5 price point.
With the market cap presently $697 million, CRYPTOCAP:OM has enough strength for a bounce back after the mainstream crypto market might have digest the news.
MANTRA Price Live Data
The live MANTRA price today is $0.719974 USD with a 24-hour trading volume of $2,499,155,492 USD. MANTRA is down 88.55% in the last 24 hours. The current CoinMarketCap ranking is #81, with a live market cap of $697,898,136 USD. It has a circulating supply of 969,337,399 OM coins and the max. supply is not available.

The Spring of OM: Wyckoff Signals a Rebirth After the CrashMANTRA ( BYBIT:OMUSDT.P ) Technical Analysis: Post-Crash Recovery and Wyckoff Accumulation Insights
TradingView
On April 13, 2025, MANTRA (OM) experienced a significant price drop, declining approximately 88% within 24 hours. This sharp downturn was attributed to a combination of factors, including market-wide volatility and potential large-scale sell-offs. Despite this abrupt decline, technical indicators suggest that OM may be entering a Wyckoff Accumulation Phase, presenting potential investment opportunities.
Understanding the Recent Price Movement
Following the crash, OM's price stabilized around $0.70, with a 24-hour trading volume exceeding $2.3 billion. The Relative Strength Index (RSI) and Commodity Channel Index (CCI) indicators both entered oversold territories, indicating a potential for price reversal.
CoinMarketCap
CentralCharts
Wyckoff Accumulation Phase Analysis
The Wyckoff Method identifies specific phases in market cycles, with the Accumulation Phase characterized by large investors ("smart money") buying assets at lower prices. Key features of this phase include:
Selling Climax (SC): A sharp price decline with high volume, as seen in OM's recent drop.
TradingView
Automatic Rally (AR): A quick rebound following the SC, indicating initial buying interest.
Secondary Test (ST): Price revisits the SC level to test support, often with lower volume.
Spring: A false breakout below support levels to shake out weak holders, potentially observed in OM's price action.
Mudrex
Sign of Strength (SOS): A strong price increase with higher volume, signaling the end of accumulation.
Currently, OM's price behavior aligns with the early stages of this accumulation pattern.
Investment Considerations
For investors considering entry points:
Risk Tolerance: Given the recent volatility, only risk capital should be used.
Technical Confirmation: Await confirmation of the SOS phase before significant investment.
Volume Analysis: Monitor trading volumes for signs of increased institutional interest.
Understanding the Wyckoff Accumulation Phase can provide insights into potential market reversals.

OMUSD - Monthly Channel IndicatorOn the monthly chart this dump is shown as just a retest of the Gaussian Channel indicator which price is still above.
Very big move which could shake a lot out.
If you are long on this Monthly you should not be very worried. Unless the intensity of the downward move is too much.
Monthly chart.

OMUSD - Big DumpA massive move downwards on this Weekly timeframe
I think still however support can be found and the overall upward phase on the longer term trend line can resume
Could be a massive buy the dip scenario
Reminds me in some ways of the LUNA crash however
I would wait till the the price label point is hit before entering on this long timeframe

Mantra $OM Welcome to crypto! Why did this happen?CRYPTOCAP:OM just embarrassed the entire RWA space.
90% wiped. Billions gone. All in under an hour.
This wasn’t random — it was coming.
The CRYPTOCAP:OM disaster explained
It started with one wallet.
A massive deposit of 3.9 million CRYPTOCAP:OM hit OKX.
That alone raised eyebrows — but when people realized who it belonged to, things got serious.
The wallet was reportedly linked to the team.
And here’s the kicker:
The OM team controls around 90% of the total token supply.
Team OM pumped price last year
When they move tokens, people notice — and for good reason.
This wasn’t the first red flag.
The CRYPTOCAP:OM community had already been losing trust:
– Quiet changes to tokenomics
– Delayed airdrops
– Alleged price manipulation via market makers
It was all bubbling under the surface.
So when the OKX deposit happened… panic set in.
The market saw it as the beginning of a dump.
And they were right.
Selling pressure started building — fast.
But things spiraled because of one more thing: OTC deals.
There were rumors the team made private token deals at huge discounts —
Some investors reportedly got in at 50% off or more.
That created a perfect storm.
Once CRYPTOCAP:OM dropped below those discounted prices, OTC buyers started cutting losses.
Retail followed. Fear kicked in.
Everyone was racing for the exit.
The chain reaction was brutal.
– Sell-offs
– Stop-losses triggered
– Leverage liquidations
– Liquidity vanished
All in under 60 minutes.
The market collapsed.
Over SEED_TVCODER77_ETHBTCDATA:6B in value gone.
It wasn’t just a price crash — it was a full ecosystem wipeout.
And the worst part?
Most holders had no idea it was coming.
If you’re in crypto, let this be a lesson.
⚠️ Be cautious with tokens where:
– A few wallets control the supply
– Promises get delayed
– The price feels “too stable”
– The team lacks transparency
DYOR isn’t optional anymore.
Final thoughts:
The RWA sector is one of crypto’s most promising narratives.
But events like this?
They damage credibility across the board.
This wasn’t just a rug. It was a trust collapse.
#RWA deserves better.
Thank you, Real World Asset Watchlist
Best regards EXCAVO

Trading opportunity for OMUSDTBased on technical factors there is a Sell position in :
📊 OMUSDT
🔴 Sell Now or by Breakout
🪫Stop loss 6.7000
🔋Target 5.0000
📏 R/R 2,2
💸RISK : 1%
We hope it is profitable for you ❤️
Please support our activity with your likes👍 and comments📝

OM | MANTRA | Bullish Cycle OVER?MANTRA has made leaps and strides towards a new ATH, whilst the rets of the market was trading lower for the past few weeks.
But it seems the buying pressure has run out, if we take a look at the technical indicators.
Interestingly enough, if we take a look at OM through the Weekly timeframe and we pull up the Fibonacci extension, the current cycle ended at exactly 2.618 - a significant marker in the Fib zones.
It is said that, after reaching 2.618, a retracement to 0.786 is probable. This would put us roughly at the major previous resistance zone before the ATH breakout:
The Moving Averages is another great place to watch for possible bounce zones:
After this correction (which could go even lower) the price could potentially bounce back, as it gears up for a new ATH. I'd be looking to buy from the 0.786 and lower, possibly as low as the $2 mark.
________________________
OKX:OMUSDT

Can #OM Bulls Save the Day or Not? Bears Ready For a Showdown Yello, Paradisers! Is #OM gearing up for a massive breakdown, or will the bulls step in to save the day? Let's analyze the #Mantra's latest trade setup:
💎#OMUSDT is flashing clear warning signs of weakness after forming a classic bearish divergence on the 8H timeframe. While price made higher highs, the oscillator showed lower highs, signaling a loss of bullish momentum. This is a textbook setup for an impending reversal unless buyers step in aggressively.
💎The key level to watch is the $7.48 support zone—a critical area that bulls must defend. If OM closes a candle below this level, expect a sharp drop toward the $5.00 support, with an ultimate downside target of $3.17 if the selling pressure intensifies.
💎On the flip side, the bearish setup gets invalidated above $9.26. If bulls manage to break this resistance with strong volume, we could see #OM pushing higher. However, until that happens, the bias remains bearish, and lower levels look far more likely.
The market is at a crucial tipping point—will #OMUSD crash or bounce? Let us know your thoughts in the comments. Are you shorting, or do you see a surprise rally coming? Let’s discuss.
MyCryptoParadise
iFeel the success🌴

OMUSDT(MANTRA) Updated till 15-02-25OMUSDT(MANTRA) Daily timeframe range. this thing is in absolute roll. outperforming many alts out there right now. breaking 8.2912 will push it to price discovery and new high. even its cools down a bit if it stay above 6.4765 the push will continue.

OM's Meteoric Rise: Time to Buy the Dip or Short the Top?OM has been on an astronomical journey, soaring from $0.0173 on 12 October 2023 to an all-time high of $6.485 on 7 February 2025 – a jaw-dropping +37,494% increase in just 484 days. Currently ranked 26 with a market cap of $5.5B, OM’s meteoric rise has everyone asking: Is OM topping out, or is there still more upside? Could a significant correction be on the horizon? Let’s dive into the technicals and explore our trade setups with high conviction, backed by a wealth of confluence.
Market Structure & Historical Context
Between mid-November 2024 and the end of January 2025, OM traded within a 70-day range, oscillating between $4.4 and $3.3. The Point of Control (POC) for this range is around $3.87, marking a critical level where price action has repeatedly converged. This trading range provides the backdrop for our analysis, highlighting both key support and potential resistance zones that may dictate OM's next move.
Key Support Zones & Confluence
A multitude of technical indicators converge around the $3.87 level, making it a crucial support area:
1.) Fibonacci Retracement Confluence:
Taking the Fibonacci retracement from the low at $3.173 (25 January 2025) to the recent high, the 0.786 retracement level lands at $3.8818—just a hair above our POC.
2.) Channel Median Line:
The median line drawn through the highs and lows of the 70-day trading range reinforces the significance of this area.
3.) Moving Averages:
The weekly 21 EMA/SMA currently sits between $3.63 and $3.31, and as they trend higher, we can expect them to approach $3.9 in the coming week, offering additional support.
4.) Trend Indicator (Beta):
On the 4-hour timeframe, my new upcoming Trend Indicator highlights bullish momentum edging around $3.75, further consolidating support.
5.) Fibonacci Extension:
The 1.271 Fibonacci extension from the previous low at $4.4 places a key level at $3.8329, adding yet another layer of confluence.
Collectively, these factors create a robust support zone, suggesting that any retracement towards this level might serve as an attractive entry point for long positions.
Resistance Levels & Trade Setups
Resistance Analysis
OM has repeatedly faced strong resistance near the $6 mark:
Rejection Patterns:
The chart reveals multiple rejections around $6, with a notable Swing Failure Pattern (SFP) at $6.295 that confirmed bearish pressure.
Short Trade Opportunity:
Previously, the rejection at $6.295 offered a low-risk short trade: risking about 3% for a potential gain of 17% to the Fibonacci retracement level of 0.618 (approximately $5.1965), which was nearly reached.
Potential Trade Setups
Short Trade Setup
With OM encountering strong resistance around $6 and historical rejections at key levels, a breakdown could spark further downward movement.
Entry & Stop Loss:
Entry: Initiate a short position if price fails to break decisively above $6.
Stop Loss: Set a 5% stop loss above the previous SFP.
Targets & Risk/Reward:
Targets: Consider targets at $4.7 (yielding approximately +22%) or $4.0 (around +34%).
Risk/Reward: This setup offers an impressive risk/reward ratio of 4:1 to 6:1.
Long Trade Setup
The multiple layers of support around $3.87 present an attractive opportunity for long entries should the price retrace, despite the overall bullish structure. Historically, OM has bounced off its 21 daily EMA/SMA, as marked by previous green box zones on the chart.
Entry Strategy & Laddering:
Entry: Look for long entries if price pulls back to the support zone.
Laddered Positions: Consider scaling in with positions between $4 and $3.75. This dollar-cost averaging (DCA) approach will help optimise your entry over the pullback.
Stop Loss & Target:
Stop Loss (SL): Set your stop loss below $3.58 to account for volatility while protecting against a breakdown.
Take Profit: Target the $4.5 level as your primary take profit.
Risk/Reward:
With laddered entries between $4 and $3.75, this setup provides an approximate risk/reward ratio of 2:1, though the exact ratio will depend on your specific DCA entry points.
Final Thoughts
Only execute shorts with clear confirmation from order flow analysis.
Conversely, a pullback towards the support zone presents an appealing long opportunity for those confident in OM’s enduring momentum.
As always, it’s essential to monitor price action closely and adjust your strategy as new data unfolds.
Okay. Wrapping up this analysis. Wishing you all profitable and successful trades! =)

The key is whether the price can be maintained above 5.7948
Hello, traders.
If you "Follow", you can always get new information quickly.
Please click "Boost" as well.
Have a nice day today.
-------------------------------------
(OMUSDT 1M chart)
The chart was broken by a sharp rise.
The point to watch is whether the BW(100) indicator or HA-High indicator is formed on the 1M chart.
-
(1D chart)
It formed an important support and resistance zone by moving sideways in the Fibonacci ratio range of 0(3.1730) ~ 0.382(4.4436).
Therefore, if it falls below this range, I think it would be better to stop trading and wait and see.
-
The high boundary zone is formed in the 4.8752-5.3288 range.
Accordingly, if it falls without support near 5.7948, the key is whether it will be supported near 4.8752-5.3288.
-
The strong support zone is near 3.7312.
-
Thank you for reading to the end.
I hope you have a successful trade.
--------------------------------------------------
- Big picture
I used TradingView's INDEX chart to check the entire range of BTC.
(BTCUSD 12M chart)
Looking at the big picture, it seems to have been maintaining an upward trend following a pattern since 2015.
That is, it is a pattern that maintains a 3-year uptrend and faces a 1-year downtrend.
Accordingly, the uptrend is expected to continue until 2025.
-
(LOG chart)
As you can see from the LOG chart, the uptrend is decreasing.
Accordingly, the 46K-48K range is expected to be a very important support and resistance range from a long-term perspective.
Therefore, we expect that we will not see prices below 44K-48K in the future.
-
The Fibonacci ratio on the left is the Fibonacci ratio of the uptrend that started in 2015.
In other words, it is the Fibonacci ratio of the first wave of the uptrend.
The Fibonacci ratio on the right is the Fibonacci ratio of the uptrend that started in 2019.
Therefore, this Fibonacci ratio is expected to be used until 2026.
-
No matter what anyone says, the chart has already been created and is already moving.
How to view and respond to this is up to you.
When the ATH is updated, there are no support and resistance points, so the Fibonacci ratio can be used appropriately.
However, although the Fibonacci ratio is useful for chart analysis, it is ambiguous when used as support and resistance.
This is because the user must directly select the important selection points required to create Fibonacci.
Therefore, since it is expressed differently depending on how the user specifies the selection points, it can be useful for chart analysis, but it can be seen as ambiguous when used for trading strategies.
1st : 44234.54
2nd : 61383.23
3rd : 89126.41
101875.70-106275.10 (Overshooting)
4th : 134018.28
151166.97-157451.83 (Overshooting)
5th : 178910.15
-----------------

Public trade #21 - #OM price analysis ( MANTRA )One of the few coins with a normal market cap is #OM, which had not drop yesterday
This means that MM is probably tasked with holding and pushing the price of OKX:OMUSDT higher.
🤑 And who are we to go against him?)
We will try to bribe #MANTRA into our investment portfolio and copytrading, it may turn out to be a good trade
_____________________
Did you like our analysis? Leave a comment, like, and follow to get more

OMUSDT 1DOM ~ 1D
#OM If you pay attention to this chart, this chart is synonymous with accumulation by big players. If you have Conviction on this coin. Buy from here with a target of 20%++

Why OM Could Decline to $2 in the Short TermThe recent surge in OM token's price has been impressive, but market dynamics suggest potential risks of a short-term correction. Several factors could contribute to a decline in the price, possibly reaching the $2 level:
1. Overvaluation and Profit-Taking
The OM token has experienced a rapid and substantial price increase in a relatively short period. Such exponential growth often leads to overvaluation, where the market price outpaces the token's intrinsic value or utility.
Early investors and traders may begin to take profits, especially after significant gains, creating selling pressure that could drive the price downward.
2. Market Sentiment and Speculation
A large portion of OM's recent price movement may be driven by speculative trading rather than fundamental developments. If market sentiment shifts or a negative event occurs, speculative traders could exit their positions en masse.
A decline in trading volume or a reduction in bullish sentiment could exacerbate this effect.
3. Potential Lack of Immediate Utility
While OM is positioned as a significant player in the DeFi and RWA (Real World Asset) tokenization space, its current utility and adoption might not yet fully justify its market cap.
Investors might reassess the token's value relative to its actual use cases and market penetration, leading to a price adjustment.
4. Trend in Bitcoin (BTC)
Bitcoin, as the leading cryptocurrency, often sets the tone for the broader market. Currently, BTC is experiencing a downward trend, with selling pressure and weaker buying interest dominating the market.
A falling BTC price historically triggers corrections in altcoins, as investor confidence wavers and capital flows out of higher-risk assets like OM.
If BTC continues its bearish trend, it could significantly impact OM, amplifying existing selling pressure and pulling its price lower toward $2.
5. Broader Market Trends
Cryptocurrencies are highly correlated with broader market trends. In addition to BTC’s downtrend, other macroeconomic factors such as interest rate hikes, regulatory developments, or reduced liquidity in risk assets could further weaken the cryptocurrency market.
Combined with OM’s recent price surge, these conditions make the token more vulnerable to corrections.
6. Technical Indicators Suggest Overbought Conditions
Technical analysis tools such as the Relative Strength Index (RSI) may indicate that OM is currently in overbought territory. Historically, such conditions are followed by price corrections.
Support levels near $2 could become the next logical target if resistance levels above the current price fail to hold.
7. Increased Competition
The DeFi space and RWA tokenization market are becoming increasingly competitive, with several projects vying for dominance. New partnerships, technological advancements, or announcements by competitors could divert attention and investment away from OM.
Conclusion
While OM has shown strong potential as a DeFi and RWA tokenization platform, the combination of overvaluation, speculative trading, BTC’s ongoing downtrend, technical indicators, and external market factors creates a compelling case for a potential short-term price correction. A decline to $2 would represent a natural retracement, providing an opportunity for the token to establish a more sustainable base for future growth. Investors should approach with caution and consider both the risks and opportunities in their investment strategies.

MANTRA and DAMAC to Tokenize $1 Billion in Real-World AssetsIn a groundbreaking collaboration, blockchain company MANTRA has partnered with UAE-based property conglomerate DAMAC to tokenize over $1 billion worth of real-world assets (RWA). This ambitious initiative highlights the growing trend of blockchain adoption for streamlining traditional investment processes and enhancing accessibility for investors globally.
Partnership Insights
MANTRA, a layer-1 blockchain designed specifically for tokenized real-world assets, is set to transform DAMAC’s extensive portfolio, which spans real estate development, hospitality, and data centers. By leveraging blockchain technology, this partnership aims to:
- Streamline Investments: Tokenization simplifies traditional investment mechanisms, offering faster settlements and broader accessibility.
- Enhance Transparency: Investors gain access to a secure and transparent method of participating in diverse financial opportunities.
- Expand Market Accessibility: Both retail and institutional investors can explore DAMAC’s portfolio with unprecedented ease.
The specifics of which DAMAC properties will be tokenized are expected to be disclosed in the coming weeks, with offerings slated to begin in early 2025. This marks a pivotal step in integrating blockchain technology into mainstream industries, aligning with DAMAC’s history of embracing innovation—from accepting cryptocurrency payments in Bitcoin (BTC) and Ethereum (ETH) to planning a $20 billion investment in U.S. data centers.
Tokenization’s potential is immense, with industry projections estimating the RWA market could grow to trillions of dollars by the end of this decade. Reports from McKinsey, BCG, 21Shares, and Bernstein underscore the transformative potential of this technology, with significant efficiency gains and expanded investment opportunities.
MANTRA’s Strategic Growth
MANTRA’s focus on the Middle East region underscores its commitment to revolutionizing traditional financial systems. Earlier this year, it announced plans to tokenize $500 million worth of assets for Dubai-based real estate developer MAG Group. The network’s mainnet launch in October and subsequent native token ( NASDAQ:OM ) growth further solidify its position as a leader in blockchain innovation.
NASDAQ:OM has experienced a remarkable 200% market capitalization growth over the past three months, now standing at $3.6 billion according to CoinGecko. This growth reflects increasing investor confidence in MANTRA’s capabilities and vision.
Technical Analysis of NASDAQ:OM
As of this writing, NASDAQ:OM is trading at a slight decline of 1.34%, forming a symmetrical triangle pattern. This technical setup is often indicative of a potential breakout in either direction:
- Bullish Scenario: A breakout above the upper trendline could trigger a significant rally, pushing NASDAQ:OM to new highs.
- Bearish Scenario: Conversely, a breakdown below the lower trendline could lead to a selling spree, with prices potentially retesting lower support levels.
The confined trading range highlights the importance of closely monitoring price movements for any decisive action. Traders should look for increased volume and momentum as potential confirmation signals for a breakout or breakdown.
Broader Implications
This partnership between MANTRA and DAMAC is more than just a business deal; it is a testament to the growing adoption of blockchain in traditional industries. By tokenizing real-world assets, the collaboration aims to:
- Democratize investment opportunities for a global audience.
- Enhance operational efficiencies across industries.
- Cement the UAE’s position as a leader in blockchain and crypto innovation.
Conclusion
The MANTRA-DAMAC collaboration represents a bold step forward in the tokenization of real-world assets. With a solid foundation in both technical and fundamental aspects, NASDAQ:OM is poised for substantial growth, making it a token to watch in the coming months. As the blockchain ecosystem continues to mature, this partnership could set the stage for broader adoption of tokenized investments worldwide.

TradeCityPro | OM: Upward Momentum and Airdrop Anticipation👋 Welcome to TradeCityPro!
In this analysis, I will examine the OM coin, which is associated with the MANTRA network. This coin is about to start its airdrop rounds in a few days.
📅 Daily Timeframe: High Upward Momentum and Readiness for the Next Leg In the daily timeframe, we are observing a very strong and powerful upward trend. Over the past year, this coin has grown more than 5000% and has garnered significant attention from the crypto community and enthusiasts.
🔍 Currently, a curved upward trend line has emerged in the latest cycle, starting after the price bottomed out at $0.6352 and corrected to $1.6071 before starting a new upward move reaching $4.2374.
✨ The price has touched this upward trend line several times and now, having reached the resistance at $4.2374, has formed a ranging box between this resistance and $3.4144, potentially undergoing reaccumulation. Breaking above $4.2374 could significantly impact the further price increase of this coin.
🚀 If the ceiling breaks, the next price targets based on Fibonacci would be around $10 and $20, technically feasible as the price has not corrected significantly and has maintained market momentum. However, reaching a $20 target would require OM to enter the top 10 market cap, surpassing cryptocurrencies like AVAX, SUI, and TON, which is a challenging task.
🧩 The RSI oscillator is ranging between 40.35 to 59.93, and breaking either of these areas will significantly impact the market trend. A break below 40.35 could increase the likelihood of a correction down to the $2 area, around the 0.5 and 0.618 Fibonacci levels. Breaking above 59.93 would increase the likelihood of surpassing $4.2374.
⏳ 4-Hour Timeframe: Futures Triggers In this timeframe, we see a long-term 47-day box, which is very clean and has well-defined ceilings and floors between $3.4144 and $4.3140. Breaking either of these areas would provide a good position.
📉 For a short position, breaking $3.1440 is suitable with the next supports at $2.5442 and $2.2264, near the 0.5 and 0.618 Fibonacci levels of the daily timeframe.
📈 For a long position, breaking $4.3140 is the only long trigger for now, and no target can be set for this movement until a new structure is formed.
🔑 The market volume is nearing its lowest point, increasing the likelihood of breaking one of these areas each day.
📝 Final Thoughts
This analysis reflects our opinions and is not financial advice.
Share your thoughts in the comments, and don’t forget to share this analysis with your friends! ❤️

Trading opportunity for OMUSDTBased on technical factors there is a Sell position in :
📊 OMUSDT
🔴 Sell Now
🪫Stop loss 4.71
🔋Target 1 3.01
🔋Target 2 2.44
🔋Target 3 1.75
💸RISK : 1%
We hope it is profitable for you ❤️
Please support our activity with your likes👍 and comments📝
