Euro jumps to 5-month highThe euro has posted strong gains on Wednesday. In the North American session, EUR/USD is trading at 1.1121, up 0.72%.
The US dollar is under pressure this week as we're seeing a risk-on mood in global markets. The week between Christmas and New Year's is normally quiet, with a very light data calendar. However, investors are anticipating the Federal Reserve to cut rates early next year and this sentiment has sent equity markets higher while weighing on the US dollar. The euro is powering higher, with gains of 2.1% in December and 2.9% in November against the retreating US dollar.
Federal Chair Powell surprised the markets when he pencilled in three rate cuts for next year. Investors had braced themselves for Powell to push back against rate cut expectations, a script he has followed for months. This time, however, Powell jumped on the bandwagon although Fed members have since urged the markets to tamper their expectations of up to six rate cuts next year. The markets have priced in an initial rate cut in March, with over 150 basis points in cuts for all of 2024 according to the CME's FedWatch tool.
There is a similar disconnect between the markets and the European Central Bank. The markets are looking at six rate cuts next year, perhaps as early as March, while the ECB has tried to dampen these expectations. ECB President Lagarde stated last week that members had not discussed a rate cut at the December meeting, at which the central bank held the cash rate at 4.0% for a second straight time. I expect that markets in both the US and Europe will remain much more bullish about rate cuts than the central banks.
It's a light data calendar between Christmas and New Year's in the US. The Richmond Manufacturing Index decelerated to -11 today, down from -5 in November and missing the market consensus of -6. On Thursday, unemployment claims are expected to drop to 205,000, down from 210,000 a week earlier.
EUR/USD is testing resistance at 1.1072. Above, there is resistance at 1.1130
1.0982 and 1.0924 is providing support
Manufacturing

New Zealand dollar climbs ahead of NZ Manufacturing SalesThe Japanese yen has surged on Thursday. In the North American session, USD/JPY is trading at 144.00, down a massive 2.25%. Earlier, the yen dropped as low as 143.79 per dollar, which marked the yen's highest level since August 10.
The yen has posted its biggest one-day jump of the year against the dollar on Thursday after Bank of Japan policy makers provided clear hints that the central bank is planning a major shift in monetary policy. Governor Kazuo Ueda said earlier on Thursday that the BoJ would face an "even more challenging" situation at the end of the year and in early 2024 regarding monetary policy guidance and said the BoJ would have to decide which interest rates to target once it ends negative rates.
Ueda's hint that negative rates might soon end followed comments from BoJ Deputy Governor Ryozo Himino on Wednesday. Himino discussed the potential consequences if the BoJ were to raise rates into positive territory.
The BoJ is generally tight-lipped about its plans, and these comments from senior BoJ officials were unusual. The markets have interpreted the remarks as signals about a potential shift in policy, which has sent the yen soaring on Thursday. The BoJ meets next on December 18-19, and the comments from Ueda and Himino have turned the meeting "live", as the markets will be watching for a change in policy at the meeting. At previous meetings, tweaks in policy have sent the yen sharply higher and even speculation of a move can send the yen soaring, as evident today.
The US releases nonfarm payrolls, one of the most important economic releases, on Friday. The ADP employment report isn't considered an accurate indication of job growth but is still closely watched, as it is released just two days prior to the nonfarm payrolls report.
ADP didn't show much change in November, dropping to 103,000 compared to a downwardly revised 106,000 in October. However, this was well below the consensus estimate of 130,000. Nonfarm payrolls are expected to rise to 180,000, after an October gain of 150,000. If the nonfarm payrolls report misses the estimate, the US dollar will likely lose ground in Friday's North American session.
.
USD/JPY has breached support levels at 145.96 and 144.70. The next support level is at 143.69, followed by 142.73
There is resistance at 148.93 and 150.74

Macro Monday 18~Durable Goods SignalsMacro Monday 18
Using New Orders for Durable Goods to Anticipate Market Direction
This week we are using the Manufacturers New Orders for Durable Goods Survey data (“Durable Goods”) to help anticipate price movements on the S&P500. The 30 month moving average for Durable Goods can act as a threshold level for buy and sell signals for the S&P500 whilst also providing advance warnings of recession and/or capitulation events. This has been clearly illustrated in the chart.
Durable Goods Explained
Durable goods orders is a broad-based monthly survey conducted by the U.S. Census Bureau that measures current industrial activity which proves to be is useful as an economic indicator for investors. Durable goods orders reflect new orders placed with domestic manufacturers for delivery of long-lasting manufactured goods (durable goods) in the near term or future.
A high durable goods number indicates an economy on the upswing while a low number indicates a downward trajectory.
Durable goods orders tell investors what to expect from the manufacturing sector, a major component of the economy, and provide more insight into the supply chain than most indicators. This can be especially useful in helping investors understand the earnings in industries such as machinery, technology manufacturing, and transportation.
What’s Included in Durable Goods?
Durable goods are expensive items that last three years or more. As a result, companies purchase them infrequently. Examples include machinery and equipment, such as computer equipment, industrial machinery, and raw steel, as well as more expensive items, such as steam shovels, tanks, and airplanes—commercial planes make up a significant component of durable goods for the U.S. economy. Many analysts will look at durable goods orders, excluding the defense and transportation sectors as large once off orders can often skew the figures.
Durable goods orders data can often be volatile and revisions are not uncommon, so investors and analysts typically use several months of averages instead of relying too heavily on the data of a single month. In our chart we have found the 30 month moving average to be particularly apt as a threshold level
The Chart
In the chart we have the Durable Orders metric in blue and the S&P500 in baby blue. The 30 month moving average on Durable Goods (Dark Brown Line) is used as a threshold level for buy and sell signals.
When the blue line for new orders of Durable Goods definitively passes the 30 month moving average (Dark Brown Line) this provides the buy or sell signal based on whether it moves above or below the average.
Main Findings
1. When Durable Goods Orders(blue) fall below the 30 month moving average(brown) this is sell signal
2. When Durable Goods Orders(blue) break above the 30 month moving average(brown) this is a buy signal
3. Declining durable goods and/or a fall below the 30 month moving average has offered advanced warning of recession and/or capitulation.
Sell Signal Record
(Blue line crossing below Dark Brown Line)
▫️ In Oct 2000 five months before the Dot.Com Crash which commenced in Mar 2001, the Durable Goods Moving Average provided a sell signal offering an five month advanced warning of recession.
▫️ In Dec 2007 the Great Financial Crisis (“GFC”) commenced and whilst New Orders for Durable Goods had not passed below the moving average before the recession it did pass the moving average mid recession signalling an advance warning of the major capitulation event of the GFC crash. Once again Durable Goods was of great utility in avoiding unnecessary losses.
▫️ A sell signal triggered in Oct 2014 and whilst there was no crash, the S&P500 price oscillated sideways for >24 months post signal and only increased in value by 9%. During this 24 month period capital would have been better allocated somewhere offering a better than 9% return.
▫️ In Feb 2019 one year before the COVID-19 Crash the Durable Goods Moving Average provided an advanced sell/recession signal, and whilst the S&P500 did rally c.13.5% after the signal over the subsequent 12 months, the S&P500 ultimately fell 23% thereafter in a matter of months taking back all those gains and more.
Buy Signal Record
(Blue line crossing above Dark Brown Line)
▫️ As you can see from the chart the buy signals provide a great confirmation of trend, that price on the S&P500 will likely continue in an upwards trajectory.
▫️ For the four buy signals confirmed we had 50 months of upwards price pressure on the S&P500 on the first two occasions and on the latter two 18 months and 15 months of upwards price action.
▫️ Taking the four aforementioned buy signals, an the average return was 60.5% f(max return possible from a buy signal the market high).
▫️ The performance from a buy signal to sell signal was an average of 43% across the four instances.
The chart demonstrates that using the 30 month moving average for Durable Goods New Orders can very useful in determining market trend.
At present we are well above the 30 month moving average and appear to be trending upwards. We can continue to monitor this chart and watch for a cross of the 30 month moving average as an additional confirmation of a change to a bearish trend for the S&P500 when it happens. For now this is just another chart to help us identify bearish/bullish trend changes by using the economic data from Manufacturers New Orders for Durable Goods.
As always folks, stay nimble
PUKA

Euro takes a tumble after ECB's hikeThe euro has steadied on Friday. In the European session, EUR/USD is trading at 1.0665, up 0.20%.
The European Central Bank's rate decision went right down to the wire on Wednesday. It was unclear whether the central bank would hike or hold, with strong reasons to support each position. In the end, the ECB opted to hike, choosing the fight against inflation over the threat of recession.
The ECB raised its key interest rate to a record high of 4.0%, but the euro responded with sharp losses. The reason? The ECB rate statement signalled that the rate-tightening cycle is likely over, which sent the euro and eurozone bond yields lower and European stocks higher. EUR/USD fell 0.80% on Wednesday and dropped as low as 1.0631, its lowest level since March.
ECB policy makers have been grappling with a dilemma, which made the rate decision so difficult to call. Inflation is running at a 5.3% clip, more than double the target rate of 2%, but high borrowing costs and the slowdown in China have weighed heavily on eurozone growth. In the eurozone, the services sector has been weakening and manufacturing continues to contract. Germany, the traditional locomotive of the eurozone, is likely in recession and is struggling with an inflation rate of 6.1%.
Against this background of high inflation and sluggish growth, the ECB opted for a 'dovish hike', with the rate statement noting that rates have likely reached the peak level. Lagarde didn't shed any light on the ECB's rate path, but the futures markets brought forward expectations of a rate cut to June 2024, compared to September 2024 before the rate decision.
Lagarde stated at a follow-up press conference that it's too early to say that rates have not peaked, but the markets beg to differ and are already looking ahead to rate cuts, which indicates some dissonance between the stances of the central bank and the markets.
In the US, the week wraps up with two tier-1 events. The Empire State Manufacturing Index, which plunged to -19 in August, is expected to improve to -10 points. UoM Consumer Sentiment is expected to dip to 69.1, down from 69.5 and inflation expectations are projected to remain unchanged at 3.5%.
EUR/USD is testing resistance at 1.0654. Next, there is resistance at 1.0732
There is support at 1.0609 and 1.0531

Continental CON Long term bullish cycleOur probability indicator has observed Long Term BOS (Break-of-Structure) on Daily TF.
Essentially what that means is that we closing in on bearish cycle for XETR:CON and new bullish leg is forming for longterm continuation of new bullish cycle.
We expect further bearish correction to 68.30 - 64.80 zone ( Current Inverse H&S pattern support zone ) where conditions for perfect LONG entry occur.
Take-Profit should be set within High resistance zone 114.50 - 139.30

GBP/USD ends slide, employment report nextGDP/USD has started the week in positive territory, after a two-day slide that saw the pound lose 1.5%. In the North American session, GBP/USD is trading at 1.2514, up 0.54%.
On the economic calendar, it's a fairly quiet start to the week. There are no releases out of the UK. In the US, the Empire State Manufacturing Index slid to -31.8, versus 10.8 prior and an estimate of -2.5 points. This was the lowest level in three years and pointed to a sharp contraction. Orders and inventories fell sharply, and the report was another indication of the sorry state of the manufacturing sector.
The US releases retail sales on Tuesday, with the markets expecting an improvement in the April data. The headline reading is expected to improve to 0.7%, up from -0.6%, and the core rate is projected to rise to 0.4%, up from -0.4%. If the data is within expectations, it would indicate that consumers are still spending, despite a drop in consumer confidence.
Friday's GDP release pointed to a UK economy in trouble. March GDP came in at -0.3%, and Q1 growth posted a meagre gain of 0.1%. The economy might manage to avoid a recession, but the BoE is projecting practically zero growth in 2023. The labour market has remained robust in the UK, despite the weak economy and the bite of rising interest rates. However, cracks are appearing - unemployment claims rose by 28,200 in April, and are expected to rise by 31,200 in the April report, which will be released on Tuesday.
The Bank of England will be keeping a close eye on wage growth, a driver of inflation. The estimate for average earnings including bonuses for January-March stands at 5.8%, versus 5.9% in the previous release.
GBP/USD is putting pressure on resistance at 1.2524. The next resistance line is 1.2604
1.2369 and 1.2289 are the next support levels

GBP/USD - Another strong week for the British poundThe British pound is poised to post its fifth successive winning week. During this time, the GBP/USD has sparkled, rallying almost 500 points.
This week's UK releases have not been as positive as the pound's upswing. GDP was flat in February on a monthly basis, down from 0.4% in January and unable to hit the estimate of 0.1%. Manufacturing Production was also flat and Industrial Production came in at -0.2%.
Inflation remains in double digits, despite the Bank of England's aggressive rate policy, which has raised the benchmark cash rate to 4.25%. The combination of high inflation and rising interest rates has created a cost-of-living crisis and is weighing on businesses as well. To make things even worse, the country has been hit by widespread strikes in the public sector, as workers protest the drop in real income due to soaring inflation. An IMF forecast released this week indicated that the UK economy is projected to be the worst performer in the G20, which includes Russia.
The economic situation isn't pretty, and the government and the BoE are under strong pressure to right the ship, and fast. Finance Minister Hunt has said he'll cut inflation in half and a recession can be avoided, but it's hard to share his optimism.
This week pointed to further deceleration in inflation levels in the US. Headline CPI fell to 5.9%, down from 5.0%, although the core rate nudged up to 5.6%, up from 5.5%. The Producer Price Index declined to 2.7%, down sharply from 3.4%, and the core rate eased to 3.4%, down from 4.8%.
Will the drop in inflation be accompanied by a decline in consumer spending? The markets are bracing for a soft retail sales report for March. Headline retail sales is expected to fall by 0.4% y/y and the core rate is projected to decline by 0.3% y/y. A weak release could push the US dollar lower, as there will be more pressure on the Fed to consider pausing its rate hikes at the May meeting.
GBP/USD touched resistance at 1.2537 earlier. The next resistance line is 1.2656
There is support at 1.2405 and 1.2282

Nike Inc. (NKE) bullish scenario:The technical figure Falling Wedge can be found in the daily chart in the US company Nike Inc. (NKE). Nike Inc. is an American multinational corporation that is engaged in the design, development, manufacturing, and worldwide marketing and sales of footwear, apparel, equipment, accessories, and services It is the world's largest supplier of athletic shoes and apparel and a major manufacturer of sports equipment, with revenue in excess of US$46 billion in its fiscal year 2022. The Falling Wedge broke through the resistance line on 17/03/2023. If the price holds above this level, you can have a possible bullish price movement with a forecast for the next 6 days towards 123.99 USD. According to experts, your stop-loss order should be placed at 115.87 USD if you decide to enter this position.
Nike is expected to report a rise in third-quarter revenue and grow its market share through 2023, helped by major rival Adidas' split with designer and rapper Kanye West which caused the German company to lose about $600 million in quarterly sales.
Nike is also expected to get a boost from higher sales of its Jordan Retros and some newer launches as the world's No. 1 sportswear maker stays ahead of rivals through its innovative product lines.
Risk Disclosure: Trading Foreign Exchange (Forex) and Contracts of Difference (CFD's) carries a high level of risk. By registering and signing up, any client affirms their understanding of their own personal accountability for all transactions performed within their account and recognizes the risks associated with trading on such markets and on such sites. Furthermore, one understands that the company carries zero influence over transactions, markets, and trading signals and cannot be held liable nor guarantee any profits or losses.

no real problem with tsla continuationits not the most liekly scenario, but people are freaking out when if you look at the technicals this way bulls still have a lot of room to work with.

what would a turnaround in tsla look likeim using the same lines i did when i was short. im just switching directions. this is a companion post to related idea. all ma and oscillators are also bullish here, leading to the conjecture continuation is likely along trend lines and the following swing based strategy using these support and resistance is feasable.

tsla longs fighting uphill battlebulls are in control of this move but lack the follow through necessary to make a convincing move to the upside look like a change of weekly momentum. weve made a daily bounce that retraced enough to say a lower low is set, but havent made a higher low or confirmed the move with a trip above the last bearflag area/value area high. weve also started forming a topping out proccess 4hr as indices futures fail to climb over a top like 4037 es1!, and this has happened every leg of the way fown for stocks making me think we need to at least revisit the dotted line, and if we break through it id look for the lower horizontal. if we support in the mid range and move higher, especially if indices are breaking out with multiple sectors green, or if we get immediate continuation id still be long.

Sanofi S.A. (SAN.pa) bearish scenario:The technical figure Channel Up can be found in the daily chart in the French company Sanofi S.A. (SAN.pa). Sanofi S.A. is a French multinational pharmaceutical and healthcare company. Sanofi engages in the research and development, manufacturing and marketing of pharmacological products, principally in the prescription market, but the firm also develops over-the-counter medications. The corporation covers seven major therapeutic areas: cardiovascular, central nervous system, diabetes, internal medicine, oncology, thrombosis, and vaccines (it is the world's largest producer of the last through its subsidiary Sanofi Pasteur). The Channel Up broke through the support line on 24/01/2023. If the price holds below this level, you can have a possible bearish price movement with a forecast for the next 26 days towards 86.54 EUR. According to experts, your stop-loss order should be placed at 92.90 EUR if you decide to enter this position.
French drugmaker Sanofi SA plans to launch a drug for rare bleeding disorder hemophilia A this year, Chief Executive Officer Paul Hudson told CNBC in an interview last week.
The U.S. Food and Drug Administration last year accepted the marketing application for the therapy, which is being developed in collaboration with Swedish drugmaker Sobi, and is expected to decide on an approval status by Feb. 28.
Hemophilia A is an inherited bleeding disorder in which the blood does not clot normally. About 400 babies are born with this condition every year, although the exact number of people affected is not known, according to government data.
Risk Disclosure: Trading Foreign Exchange (Forex) and Contracts of Difference (CFD's) carries a high level of risk. By registering and signing up, any client affirms their understanding of their own personal accountability for all transactions performed within their account and recognizes the risks associated with trading on such markets and on such sites. Furthermore, one understands that the company carries zero influence over transactions, markets, and trading signals, therefore, cannot be held liable nor guarantee any profits or losses.

AUD/USD slides after soft Aussie job reportThe Australian dollar has extended its slide on Thursday. AUD/USD is trading at 0.6884 in Europe, down 0.82%.
Australia's December employment report was weaker than expected, sending the Australian dollar sharply lower. The headline reading showed a loss of 14,600 in total employment, which may have soured investors. The release wasn't all that bad, as full-time jobs showed gains of 17,600, with part-time positions falling by 32,200. The unemployment rate remained at 3.5%, but this was a notch higher than the forecast of 3.4%.
On the inflation front, recent releases point to inflation moving higher. November CPI rose to 7.3%, up from 6.9%, and the Melbourne Institute Inflation Expectations climbed to 5.6%, up from 5.2%. We'll get a look at the all-important quarterly inflation reading next week. Inflation came in at 1.8% q/q in Q3, and an acceleration in Q4 would force the Reserve Bank of Australia to consider raising rates higher and for longer than it had anticipated. The cash rate is currently at 3.10%, and I expect the RBA will raise it to 3.50% or a bit higher, which means we are looking at further rate hikes early in the year.
The US dollar seems to take a hit every time there is a soft US release, and this week has had its share of weak data. The Empire State Manufacturing Index sank to -32.9, while headline and core retail sales both fell by -1.1%. PPI came in at -0.5%. All three releases were weaker than the November readings and missed the forecasts, indicating that cracks are appearing across the US economy, as the bite of higher rates is being felt.
The markets are clinging to the belief that softer numbers will force the Fed to ease up on its pace of rate hikes and possibly end the current rate-cycle after a 25-bp increase in February. The Fed has done its best to dispel speculation that it will pivot, but I expect the US dollar to lose ground if key releases are weaker than expected.
AUD/USD is testing support at 0.6893. Below, there is support at 0.6810
0.6944 and 0.7027 are the next resistance lines

lets talk about a broader turn around in technologytechnology has led the market down. semiconductors have led technology. this stock has exhibited particular rate of change and other bullish volume based oscillations. bil williams ma, vwma, ema, trama as well as displaced ma are also bullish along trend lines. this leads me to a swing vased strat for continuation following the concordant supports, resistances and resulting ghost feed. this goes for stock like NVDA, and the broader market too. i am selling as spx approached 4035-4037, and i am hedging on pullbacks in taiwan semiconductor by buying SOXS and scalping for a few pennies at a time. im long the broader market with TQQQ on breaks of resistance or support on daily higher lows.

GBP/USD drifting, UK GDP nextThe British pound is drifting for a third straight day. In the European session, GBP/USD is trading at 1.2161, down 0.09%. We could see stronger volatility from the pound before the weekend, with the release of the US inflation report and UK GDP on Friday, both of which are market movers.
There is guarded optimism ahead of the US inflation report. Inflation is projected to drop in December, which would be music to the market's ears. The forecast for headline inflation stands at 6.5%, following the November gain of 7.1%. The core rate, which is more important, is also expected to ease, with a forecast of 5.7% in December, compared to 6.0% in November. The inflation release should result in volatility from the US dollar. If inflation, particularly the core rate, falls as expected or more, the US dollar will likely lose ground, as speculation will increase that the Fed may have to pivot from its hawkish stance and ease up on the pace of rates. Conversely, if inflation does not fall as much as expected, it would vindicate the Fed's hawkish position, which the markets may have to grudgingly accept.
There remains a dissonance between the Fed and the markets, despite warnings by the Fed that the markets are underestimating Fed rate policy. The Fed has insisted that further rate hikes are coming, while there have been market players who are expecting a "one and done" hike in February which will wrap up the current rate cycle. The markets have priced in a peak terminal rate below 5% as well as rate cuts late in the year, while the Fed has been signalling a peak rate of 5-5.25% or even higher.
In the UK, there are no major releases on Thursday, but Friday will be busy, highlighted by monthly GDP and Manufacturing Production. The markets are braced for soft numbers, which could send the pound lower. GDP for November is expected to contract by 0.2% m/m, following a gain of 0.5% in October. Manufacturing Production for November is forecast to come in at -4.8% y/y, after a -4.6% reading in October.
GBP/USD is putting pressure on 1.1832 and could test this line today. The next support level is 1.1726
There is resistance at 1.1913 and 1.2026

US Weekly Fundamental Recap (RE ALIGNMENT)Let try this again, hard to get this lined up nicely...
This week we saw some interesting indicators start to decline.
In industry: More volatile PMI manufacturing saw further pull below 50 while PMI services have now just crossed the threshold. PMI services has only crossed below 50 during a few periods in the last 25 years.
Labor markets Labor statistics continue to remain fairly static. They are expected to weaken as the federal funds rate continues to inch higher, at least slightly, while easing is still moderately applied.
Thoughts
Zooming out to a broader look ahead I believe we will be back to visit 2019 lows, at a minimum. Best case we see a retest of a long supporting moving average at a point CPI Y/Y and banking rates are both heading in the right direction. If this were to play out there would be an addition 30-35% pullback in the NAS/US500 while these metrics return from their hopeful extremes. Worse-er case, we lose the monthly 100 EMA and slip back to erase 9-12 years of "industry" gains (or to present a wonderful buying opportunity @ ~85% discount!).
The timing is everything with this one, when do we approach that price area. Sooner is not better for its strength IMO. If we see confluence between the NAS Monthly 100EMA, CPI / rates sub 4%, bond bounce back, US dollar off its bully run yadda yadda - all in.
If we get there too soon; before rates have stabilized or begun their decline, CPI is continuing to gap target significantly, the DXY is on the rise / holding ect - that EMA will become a good resistance for my short entry.
Happy trading - stay agile

US Weekly Fundamental Recap & macro thoughtsThis week we saw some interesting indicators start to decline.
In industry: More volatile PMI manufacturing saw further pull below 50 while PMI services have now just crossed the threshold. PMI services has only crossed below 50 during a few periods in the last 25 years.
Labor markets Labor statistics continue to remain fairly static. They are expected to weaken as the federal funds rate continues to inch higher, at least slightly, while easing is still moderately applied.
Thoughts
Zooming out to a broader look ahead I believe we will be back to visit 2019 lows, at a minimum. Best case we see a retest of a long supporting moving average at a point CPI Y/Y and banking rates are both heading in the right direction. If this were to play out there would be an addition 30-35% pullback in the NAS/US500 while these metrics return from their hopeful extremes. Worse-er case, we lose the monthly 100 EMA and slip back to erase 9-12 years of "industry" gains (or to present a wonderful buying opportunity @ ~85% discount!).
The timing is everything with this one , when do we approach that price area. Sooner is not better for its strength IMO. If we see confluence between the NAS Monthly 100EMA, CPI / rates sub 4%, bond bounce back, US dollar off its bully run yadda yadda - all in.
If we get there too soon ; before rates have stabilized or begun their decline, CPI is continuing to gap target significantly, the DXY is on the rise / holding ect - that EMA will become a good resistance for my short entry.
Happy trading - stay agile

Green in your DM Desktop Metals pond fishing 3D printer“I would not be a Moses to lead you into the Promised Land, because if I could lead you into it, someone else could lead you out of it.”
“A privately owned world can never be a free world and a society based upon warring classes cannot stand.”
Desktop Metal, Inc. engages in the manufacture of additive manufacturing solutions accessible to engineering, design, and manufacturing applications.
It operates through the following geographical segments: Americas, Europe Middle East, and Africa, and Asia Pacific.
The firm offers 3D printing machines.
It was founded by Ric Fulop, Emanuel Sachs, Rick Chin, A. John Hart, Yet Ming Chiang, Christopher A. Schuh, and Jonah Myerberg in October 2015 and is headquartered in Burlington, MA.

so is it the bottom in tesla?if we get continuation on hourly uptrend we could complete or confirm daily bull reversal. these are levels and patterns i am watching for based on sss and nadaraya watson. tsla is close to breakout levels, and is testing weekly mid range short term.

10/23/22 HONHoneywell International Inc. ( NASDAQ:HON )
Sector: Producer Manufacturing (Industrial Conglomerates)
Market Capitalization: 123.158B
Current Price: $182.81
Breakout price trigger: $185.85
Buy Zone (Top/Bottom Range): $182.00-$169.55
Price Target: $200.40-$203.00 (1st), $221.20-$226.00 (2nd)
Estimated Duration to Target: 161-170d (1st), 323-351d (2nd)
Contract of Interest: $HON 3/17/23 190c, $HON 1/19/24 200c
Trade price as of publish date: $8.20/contract, $17.10/contract

This Week in the Markets (October 3-7)October 3 (Monday)
German Manufacturing PMI
UK Manufacturing PMI
October 4 (Tuesday)
US ISM Manufacturing PMI
RBA Interest Rate Decision
October 5 (Wednesday)
US JOLTs Job Openings
UK Composite PMI
US ADP Employment Change
October 6 (Thursday)
US ISM Non-Manufacturing PMI
Australia Trade Balance
UK Construction PMI
Eurozone Retail Sales
Canada Ivey PMI
October 7 (Friday)
US Nonfarm Payrolls
Canada Unemployment Rate
What You Need to Know This Week:
🔸 The RBA Interest Rate Decision is expected to remain at 2.35%
🔸 Estimates have the Nonfarm Payrolls to add 250,000 jobs into the market.
🔸 No major earnings report this week.
More information on Mitrade website.

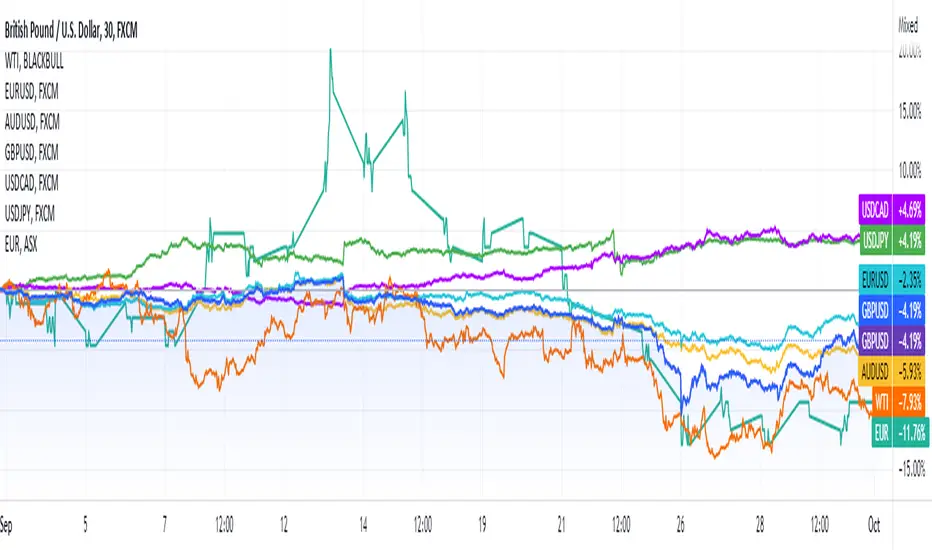
Brazil to enter the next round of the presidential electionEUR/USD ▶️
GBP/USD 🔼
AUD/USD 🔽
USD/CAD 🔼
XAU ▶️
WTI 🔽
A fine margin in the results has denied an outright victory in the Brazilian presidential election, both former and current presidents will go head to head in the next round. While the people are divided by their choice of leader, potential unrest lies ahead if the final result sparks controversies.
As an oil producer and commodity exporter, this could further disrupt the global supply chain. WTI oil futures declined to $79.49 a barrel and just surged to $81.67. Despite experiencing considerable fluctuations, recession fears kept gold prices mostly steady at $1,660.98 an ounce.
After rebounding from 0.9744, the Euro then closed to 0.9799 against the US dollar, and GBP/USD went higher to 1.116. Later today, both Germany and the UK will provide their manufacturing PMI readings for September, the market expects the manufacturing sectors would not change in terms of performance.
Tomorrow morning, the Reserve Bank of Australia is going to announce its interest rate decision, current estimates anticipated a 50-basis point increase to 2.85%. Meanwhile, AUD/USD recovered from a low of 0.6397 to 0.6402, recording a loss of over 100 pips. USD/CAD closed at a high of 1.3826, and the US manufacturing PMI will be available early tomorrow.
More information on Mitrade website.
BAT (BATS.l) bearish scenario:The technical figure Rising Wedge can be found in the UK company British American Tobacco plc (BATS.l) at daily chart. British American Tobacco plc is a British multinational company that manufactures and sells cigarettes, tobacco and other nicotine products. The company, established in 1902, is headquartered in London, England. As of 2019, it is the largest tobacco company in the world based on net sales The Rising Wedge has broken through the support line on 06/07/2022, if the price holds below this level you can have a possible bearish price movement with a forecast for the next 27 days towards 3 194.00 GBp. Your stop loss order according to experts should be placed at 3 645.00 GBp if you decide to enter this position.
The board of British American Tobacco p.l.c. has announced that it will be increasing its dividend on the 17th of August to UK £0.54. The announced payment will take the dividend yield to 6.0%, which is in line with the average for the industry. While it is always good to see a solid dividend yield, we should also consider whether the payment is feasible. The last payment made up 73% of earnings, but cash flows were much higher. This leaves plenty of cash for reinvestment into the business.
The next year is set to see EPS grow by 11.5%. Assuming the dividend continues along recent trends, we think the payout ratio could be 69% by next year, which is in a pretty sustainable range.
Risk Disclosure: Trading Foreign Exchange (Forex) and Contracts of Difference (CFD's) carries a high level of risk. By registering and signing up, any client affirms their understanding of their own personal accountability for all transactions performed within their account and recognizes the risks associated with trading on such markets and on such sites. Furthermore, one understands that the company carries zero influence over transactions, markets, and trading signals, therefore, cannot be held liable nor guarantee any profits or losses
