2025 Is a Big Year for Bitcoin Miners—Who’s Winning the Hash War
Bitcoin’s resurgence in 2025 has reignited the mining race. The halving came and went, hashprice bounced from the abyss, and a fresh wave of capital is pouring into the space. So we figured: time to catch you up on who’s making real moves and pulling ahead — both in market cap and megawatts.
⚡ CleanSpark (CLSK): The Sharpshooter
If Bitcoin mining were a sport, CleanSpark would be the athlete that trains all year, eats clean, and shows up for every match. No drama, just execution.
In 2025, CleanSpark continues to grow fast — but smart. It’s acquiring distressed sites, upgrading facilities with immersion cooling, and pushing its fleet beyond 50 EH/s. Its Tennessee expansion (a deal scooped up for pennies on the dollar) was classic CLSK: low cost, renewable-powered, and ready to scale.
In Q1 2025, CleanSpark posted $162.3 million in revenue, up a blistering +120% YoY, and delivered $246.8 million in net income, or $0.85 per share. It's one of the few miners that’s profitable and expanding — at the same time.
The stock is up 25–30% YTD, trading around $12. While it’s been volatile like the rest of the sector, CLSK remains the benchmark for cost-effective, execution-focused Bitcoin mining. If you’re looking for a fundamentals-backed growth story, this is it.
🏗️ Iris Energy (IREN): The AI-Ready Dark Horse
Iris Energy may have flown under the radar in past cycles, but in 2025 it’s turning heads — not just because of Bitcoin, but because of data infrastructure.
While IREN runs a lean BTC mining operation powered by 100% renewable energy in Australia and Canada, the real story is its pivot toward modular data centers. It’s one of the few miners actively positioning itself for GPU workloads and AI compute as a hedge against mining volatility.
The upside? Flexibility. If BTC mining margins compress again, IREN has the facilities and roadmap to reconfigure its power-hungry machines for AI hosting. The market likes the optionality. The stock’s up ~70% this year and may still be cheap if the data center thesis catches on.
🔥 BitFuFu (FUFU): The Challenger
BitFuFu came in hot after its 2024 IPO — vertically integrated, Bitmain-backed, and global from day one. It’s the largest cloud mining provider in the mining space. It provides cloud mining, sells miners, hosts them, runs its own mining pool (BitFuFuPool), and operates a global fleet clocking over 36 EH/s under management.
While others focused on HPC & AI business, BitFuFu doubled down on mining scale and infrastructure. It aims to own over 1 GW of power capacity and launched its own mining operating system.
The post-halving reality has been rough. Q1 2025 revenue came in at $78 million, down 46% YoY, with self-mining revenue dropping 70.7%. But the company has a track record of being profitable every year since founded, plus its P/S is only 1.6, well below other mining giants such as Mara and Riot.
Watch this one. Especially if BTC pushes above $150K.
🐋 Marathon Digital (MARA): The Goliath, Still Standing
Marathon is the largest public miner by market cap — and has been the face of institutional mining exposure for years. It’s also the most debated name in the game.
On one hand, MARA controls a monster fleet with over 75 EH/s expected by year-end, global mining operations from the U.S. to the UAE, and a budding software business for managing hashrate.
On the other, critics argue it’s bloated, overly reliant on third-party infrastructure, and too slow to pivot in a fast-moving landscape.
Still, when Bitcoin’s hot, Marathon runs. The company holds a large BTC treasury of over 50,000 BTC, is adding immersion-cooled sites, and remains a proxy trade for many traditional investors wanting in on mining without picking niche plays.
Love it or hate it, MARA isn’t going anywhere. And if BTC moons in Q4, it’ll be one of the first tickers to feel the heat.
🧊 Cipher Mining (CIFR): The Quiet Killer
Cipher isn’t flashy. It doesn’t dominate headlines or make bold predictions. What it does do: mine Bitcoin efficiently, at low cost, with minimal dilution and maximum discipline.
Based in Texas, CIFR locked in long-term power contracts at enviably low rates and steadily grew its fleet past 13.5 EH/s. It has some of the best cost-per-BTC metrics in the industry and avoids unnecessary spending or debt.The Texas-based miner produced 602 BTC in Q1, and benefits from low power contracts and disciplined growth.
The market loves it: CIFR is up ~35% YTD, trading at $6.52. It’s becoming a favorite among investors who want hash exposure with less volatility and more transparency. The monthly production updates are clear, consistent, and confidence-building.
👀 Trends to Watch in H2 2025
1. Hashprice Rollercoaster: Hashprice (BTC earned per TH/s per day) has bounced from $39 post-halving lows to nearly $60. If BTC rallies again, miners with fixed-cost power will reap the upside.
2. GPU Hosting Pivot: With AI demand surging, some miners are repurposing infrastructure to host GPUs — think IREN.
3. M&A Season: Expect smaller players with weak cash flow to get scooped up.
4. Regulatory Shifts: Crypto Week laws passed in the U.S. provide more clarity. But ESG pressure and power usage scrutiny will remain part of the narrative.
💭 Final Thought
Bitcoin mining stocks aren’t just about Bitcoin anymore.
They’re about infrastructure. Data. Energy. Efficiency. Optionality. And in 2025, the winners will be those who can balance raw hashpower with strategic foresight.
Whether you’re team CLSK, FUFU, IREN, MARA, or CIFR — the landscape is shifting fast. And with BTC momentum building again, this might just be the beginning.
So — which miner are you backing this cycle?
MARA

MARA: shoulders done, now walk toward the targetOn the daily chart, MARA completed a textbook inverse Head & Shoulders reversal with a clear breakout above the descending trendline. A corrective pullback followed, and the price is now heading into the key buy zone at 15.21–15.77 - aligning with the 0.72 and 0.79 Fibonacci retracements, and the upper boundary of the broken channel. This is the area to watch for a potential continuation of the bullish impulse.
Volume on the breakout was above average, confirming strong buyer interest. The EMAs are trending below the price, supporting the upward structure. The first target is located at 21.57 (previous resistance), with a potential extension to 28.77 (Fibonacci 1.618).
Fundamentally, MARA remains highly correlated with BTC and crypto sentiment. As interest returns to crypto-related assets due to ETF flows and possible Fed easing, mining stocks like MARA gain attention. Recent reports also show improved production efficiency and lowered costs - a tailwind for bulls.
Tactically, the best setup would be a confirmed reaction from the buy zone — whether a strong candlestick formation, volume surge, or reclaim of a key level. If that happens, aiming for 21.57 and 28.77 becomes a solid plan.
The pattern played out - now it's time for the market to walk the talk.

MARA Is Waking Up And Looks Promising For The Crypto MarketMARA Is Waking Up And Looks Promising For The Crypto Market, as it can send the price even higher this year from a technical and Elliott wave perspective.
Marathon Digital Holdings with ticker MARA nicely and sharply recovered away from the strong support after a completed projected higher degree abc correction in wave B/2. So, similar as Crypto market, even MARA can be forming a bullish setup with waves »i« and »ii« that can soon extend the rally within wave »iii« of a five-wave bullish cycle within higher degree wave C or 3, especially if breaks above 21 first bullish evidence level. It could be easily supportive for the Crypto market if we consider a positive correlation.

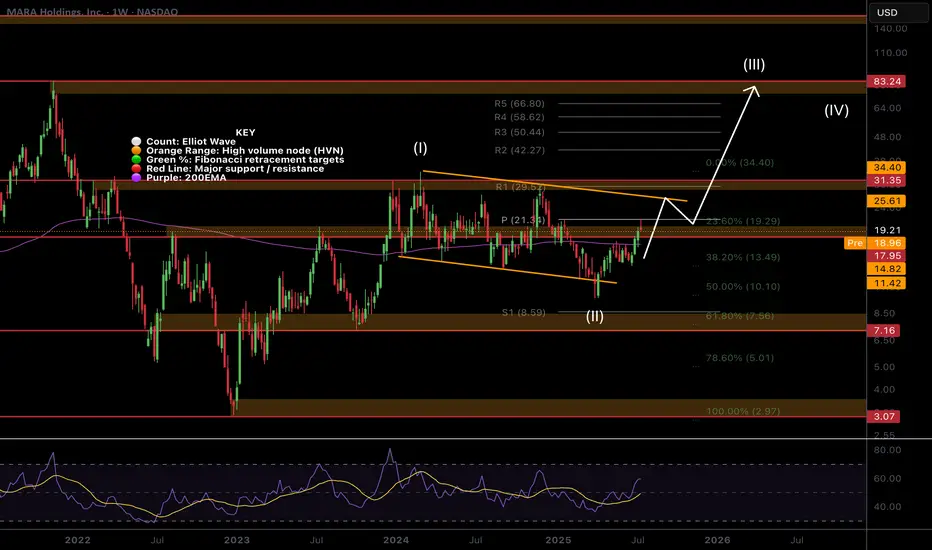
$MARA Hits the Weekly PivotNASDAQ:MARA path has been grinding higher clearing the High Volume Node (HVN) resistance where it is sat as support.
The weekly pivot rejected price perfectly so far but if the count is correct and Bitcoin doesn't dump I expect this continue strongly towards the descending orange line resistance as my partial take profit target.
Once that line is broken i am looking at terminal bull market targets of $80 but will of course take profit at key areas along the way.
Wave 2 swung below the descending support and recovered at 0.5 Fibonacci retracement potentially kicking off wave 3.
Safe trading
$MARA at Resistance!NASDAQ:MARA continues its rally and has come into the High Volume Node resistance target and R2 daily pivot.
Daily 200EMA was tested as support after price smashed through. I expect continuation to the upside $24 target at the R5 daily pivot after some consolidation at this resistance.
Analysis is invalidated way below wave 2 at $13
Safe trading

Mara Holdings, Inc. —122 2025 New All-Time HighUltra-bullish with new all-time high in sight, MARA hit the lowest price in April 2025 since November 2023.
Good evening my fellow reader, are you a stock trader?
MARA is preparing for a major rise and this opens up an easy trade. A LONG trade.
Needless to say, a "cryptocurrency mining company" is bullish as the Cryptocurrency market turns bullish. No bull market since 2021 and the chart is perfect for a new all-time high.
The previous bull market lasted 602 days and produced 23,593.92% total growth. This time the growth won't be the same, there is nothing like the first bull market, but it will still be very strong. It is likely that the MARA stock will hit all three targets on this chart (49, 73 and 97) and go beyond.
A new all-time high can be 97 followed by 122. I think these levels can be hit easily as part of the bull market bull run. Months and months of continued growth will produce so much bullish momentum that prices will go off the chart.
Namaste.

$IREN has the lowest all-in cost of mining a single coinNASDAQ:IREN is mining a single bitcoin at $40,000 all-in costs. When bitcoin appreciates to $150-200k, the miners with their rigs, land, infrastructure, balance sheet, hardware etc will be repriced higher. Thats the gain I would like to capture with this entry here at $9 a share.
This phenomenon will be seen throughout the entire sector, all miners will appreciate from here.

$MARA - $30 Call Option for September 19, 2025Enter close to the trend retest, stop loss behind the trend line, profit targets at support, gap, or Fibonacci levels such as $20, $25, and $30.

OptionsMastery: MARA Inverse H&S!🔉Sound on!🔉
📣Make sure to watch fullscreen!📣
Thank you as always for watching my videos. I hope that you learned something very educational! Please feel free to like, share, and comment on this post. Remember only risk what you are willing to lose. Trading is very risky but it can change your life!

MARA Holdings Options Ahead of EarningsIf you haven`t bought MARA before the recent rally:
Now analyzing the options chain and the chart patterns of MARA Holdings prior to the earnings report this week,
I would consider purchasing the 13usd strike price Calls with
an expiration date of 2025-5-30,
for a premium of approximately $1.38.
If these options prove to be profitable prior to the earnings release, I would sell at least half of them.

Bitcoin: The Robot Taxi Driver We Didn’t NeedWhy Blockchain Is Driving the Future Without It
In the 1990 sci-fi classic Total Recall, Arnold Schwarzenegger’s character hails a futuristic taxi only to be greeted by “Johnny Cab”—a creepy, clunky robot driver that awkwardly talks while struggling to navigate.
Back then, audiences imagined a future where robotic taxi drivers would be commonplace. But instead, we got something far superior: fully autonomous, self-driving cars that render robot drivers unnecessary.
The same is happening with Bitcoin. It was revolutionary, sure—but much like Johnny Cab, it’s outdated, inefficient, and rapidly becoming irrelevant in a world driven by advanced blockchain technology.
Bitcoin: The Nostalgic First Step
When Bitcoin burst onto the scene, it felt groundbreaking—just like the idea of robot taxi drivers in the Total Recall era. It gave us a new way to transact, free from centralized banks. People were thrilled, seeing it as the future of money.
But here’s the problem: Bitcoin was never the endgame. It was merely the proof-of-concept—like Johnny Cab showing that, yes, you can put a robot behind the wheel… but does that mean we should?
As financial systems evolved, Bitcoin’s shortcomings became glaringly obvious:
✅ Slow transaction speeds
✅ High fees
✅ Lack of scalability
✅ Energy inefficiency
Meanwhile, blockchain technology—the real revolution—kept advancing, proving that we don’t actually need Bitcoin any more than we needed Johnny Cab.
Enter Blockchain: The Self-Driving System
Self-driving cars didn’t need robot taxi drivers, and blockchain doesn’t need Bitcoin.
Blockchain is the foundation—an autonomous, self-sustaining system that underpins everything from finance to supply chains to digital assets.
In fact, precious metals, equities, and commodities are all moving toward digitization—but not through Bitcoin. Instead, they’re being integrated directly into blockchain-based ecosystems that offer seamless, smart contract-driven transactions.
The result?
💨 Faster
💡 More efficient
🛠️ Scalable & adaptable
Bitcoin, on the other hand, is stuck in the past. It’s clunky, expensive, and increasingly unnecessary—just like a robot taxi driver frantically punching buttons while self-driving cars smoothly navigate the streets.
Why Bitcoin Will Be Left Behind
Much like how we skipped the “robot taxi driver phase” and went straight to autonomous vehicles, the financial world will soon skip Bitcoin entirely as blockchain technology takes over.
Everything digital is moving toward streamlined, automated systems—systems that don’t require Bitcoin as an intermediary.
So the real question isn’t, “Will Bitcoin survive?”
It’s: “Why would we even need it?”
Just like Johnny Cab in Total Recall, Bitcoin might be fun to look back on—but it’s not the future.
Blockchain is the self-driving car. Bitcoin is the unnecessary robot driver.
And in a world that values efficiency, guess which one we’re leaving behind? 🚗💨
INDEX:BTCUSD CRYPTO:BTCUSD NASDAQ:COIN NASDAQ:MSTR NASDAQ:MARA TVC:GOLD TVC:SILVER TVC:DXY SP:SPX NYSE:BLK NASDAQ:TSLA NYSE:GME INDEX:ETHUSD CRYPTO:XRPUSD CRYPTO:ADAUSD

Bitcoin Hype vs. Reality: A Breakdown of Bitcoin DelusionBitcoin enthusiasts often dream of mass adoption, corporate treasuries, and state-backed investments driving its price to astronomical levels. But let’s examine the actual numbers behind these claims.
🔹 The $1M Bitcoin Fantasy
Many believe Bitcoin will reach $300K, $500K, or even $1M. But what does that actually require?
💰 Bitcoin’s current circulating supply is approximately 19.5 million coins.
💰 At $830K per coin, the total market cap would be $16 trillion—which is:
✅ More than China’s entire GDP ($6T)
✅ 5x the market cap of Apple, Microsoft, Amazon, Google & Tesla combined
To put this into perspective, the entire global crypto market cap is currently around $2.99 trillion. Expecting Bitcoin alone to hit $16 trillion is beyond unrealistic.
🔹 Why Government & Corporate Adoption Won’t Skyrocket Price
Bitcoin believers often cite governments and corporations buying Bitcoin as proof it will moon. But here’s the reality:
⚠️ State & corporate purchases are OTC (Over-The-Counter) deals—they do not impact market prices like retail speculation.
⚠️ Governments negotiate strategically, they don’t impulsively buy at public prices to pump the asset.
⚠️ Treasury holdings do not guarantee higher prices—they only serve as reserves, not market drivers.
State adoption might increase legitimacy, but it won’t magically push Bitcoin past gold or global GDP levels.
🔹 Bitcoin’s Volatility vs. Gold’s Stability
Bitcoin is often compared to gold as a store of value, but its history tells a different story:
📉 Bitcoin has crashed over 80% multiple times—far from a stable asset.
📉 Extreme volatility makes it unreliable for wealth preservation.
📉 Liquidity issues create uncertainty, making it impractical for widespread adoption as money.
Gold, by contrast, has proven stability for centuries, with intrinsic value, industrial use, and universal acceptance.
🔹 Bitcoin Will NOT Absorb the Global Economy
Some claim Bitcoin will replace fiat, surpass gold, and absorb trillions in wealth. But the economic reality is:
❌ Bitcoin remains speculative, driven by market sentiment, not intrinsic value.
❌ No nation will abandon fiat for Bitcoin—they will regulate, integrate, but never replace sovereign currency.
❌ Bitcoin lacks industrial utility—gold has actual use in electronics, medicine, and aerospace.
🔹 The Crypto Dream vs. Financial Reality
Crypto thrives on believers, feeding them narratives that sound appealing but don’t match real-world economic fundamentals.
Bitcoin is not overtaking gold.
Bitcoin is not absorbing global wealth.
Bitcoin is not making every holder a millionaire.
Numbers don’t lie, but ignoring them won’t change reality. When the hype fades, speculative investors will face the harsh truth: Bitcoin is not a guaranteed path to riches—it’s a high-risk, volatile asset that operates in an unpredictable market.

The Bitcoin Illusion: Why $300K or $1M Is a Pipe DreamBitcoin enthusiasts love throwing around wild price predictions—$300K, $1M, even $5M per BTC—as if these numbers are inevitable. But let’s break down the math and expose the delusion behind these claims:
Bitcoin at $300K or $1M? Let’s Do the Math
- $300,000 is a number pulled out of thin air by Michael Saylor and Robert Kiyosaki, either deliberately misleading or financially illiterate. They fail to grasp that this would require a market cap of $6 trillion.
- $1 million, as Cathy Wood foolishly claims, would require Bitcoin’s market cap to exceed $20 trillion—more than the entire GDP of the United States.
- The idea that Bitcoin will magically absorb trillions in global wealth is pure delusion.
Now, let’s put this into perspective:
- Bitcoin reaching $100K was relatively easy because it required a market cap of just $2 trillion—a fraction of global liquidity.
- But pushing Bitcoin to $300K or beyond requires trillions more, which is mathematically impossible without a massive influx of new capital—capital that simply does not exist.
Your $100K to $1M Fantasy—Let’s Run the Numbers
- Some Bitcoin holders believe their sub-$100K investment will make them multimillionaires.
That's a lie and delusional:
- If you bought 100k worth of Bitcoin at 83K per BTC, it would need to hit $830K per coin for you to even reach $1M.
- That’s not financial genius—it’s blind faith in an impossible scenario.
You’re Living in "The Matrix" of Crypto Lies
- You’re not stacking wealth—you’re stacking HOPIUM.
State Adoption Won’t Skyrocket the Price
- Even if six U.S. states were considering Bitcoin treasuries, those purchases would be OTC (over-the-counter)—meaning they wouldn’t significantly impact market price.
- Governments negotiate deals strategically; they don’t flood markets like retail investors hoping for price surges.
The End of Bitcoin’s Accumulation Phase
Bitcoin’s early adopters—the billionaires who pumped it up—have already made their money. The accumulation phase is over.
- To push Bitcoin higher, these whales would need to inject substantial amounts of new capital—but they are overleveraged and drowning in debt.
- Borrowed money must be repaid, and we're already past Bitcoin’s peak mainstream adoption which means there are no new waves of buyers to sustain the illusion.
- Bitcoin is now entering a distribution phase, where early holders cash out, leaving retail investors holding the bag.
The Rise of ETFs and Real Investments
The world is moving on. Investors are waking up to the fact that:
- ETFs offer real projects with actual purpose, unlike Bitcoin.
- ETFs pay dividends, generate revenue, and contribute to real economic growth.
- Newer crypto projects—like Stamps, art collections, gaming tokens, and smart contracts—are gaining traction and pulling capital away from Bitcoin.
Bitcoiners will get left behind, holding worthless, declining bags of old-school crypto, while the future thrives in better technologies.
The Harsh Reality: Bitcoin’s Future Is Bleeding Out
Bitcoin isn’t the future—it’s a fading illusion.
- The crypto cartel thrives on believers, feeding them fantasy while they cash out.
- The idea that Bitcoin will replace fiat, become the global payment rail, and make every holder rich is a marketing illusion designed to keep people holding bags.
- The longer people ignore reality, the harder the crash will be for them.
Many think they’re ahead of the curve, but they’re just loyal believers in an unsustainable illusion. When this unravels, it won’t be Bitcoin’s future collapsing—it will be theirs.

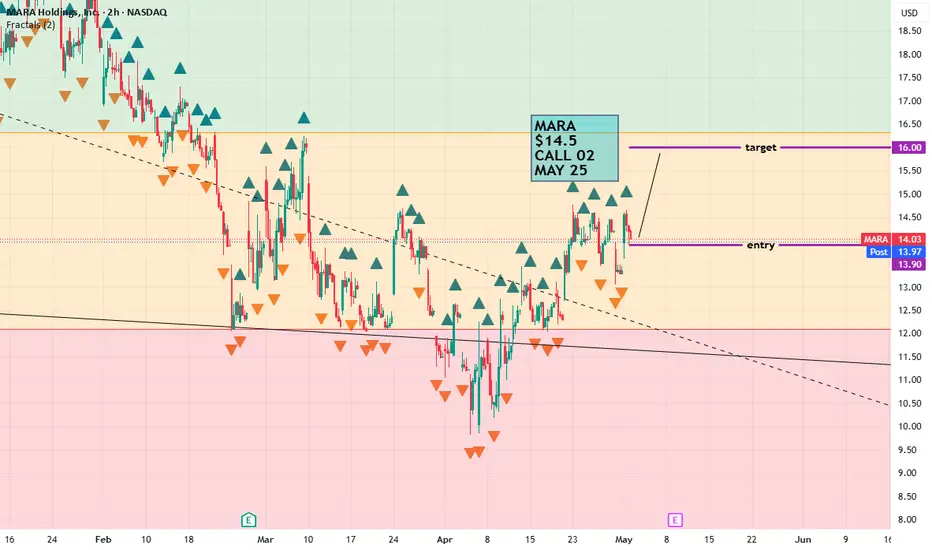
$MARA $14.5 call *This is not financial advice, so trade at your own risks*
*My team digs deep and finds stocks that are expected to perform well based off multiple confluences*
*Experienced traders understand the uphill battle in timing the market, so instead my team focuses mainly on risk management
!! This chart analysis is for reference purposes only !!
If you want to see more, please like and follow us SimplyShowMeTheMoney
$MARA still going to go under $10Even though NASDAQ:MARA has bounced, we're still not completed with the correction.
So far, we've only completed 4/5 waves down and the last leg should take us to the supports below.
I think the most likely target is at $7.64, but other two support levels possible as well.
Let's see where we end up.
Those levels will mark a great buying opportunity for the future.

MARA Holdings, Inc.: Your Altcoin ChoiceThis is obviously not an Altcoin but it was requested in the Altcoin Choice session that we did recently, so here is the analysis.
MARA Holdings, Inc. (MARA) . It looks good.
A long-term higher low has been established. MARA produced a low first in October 2023. This was followed by a series of swings and waves. Reaching the later part of 2024, the action turned full bearish and now in April 2025 MARA Holdings seems to be ready to go bullish again. And here the stock printed a higher low.
A long-term higher low will lead to a long-term higher high. The last peak happened in February 2024 at 34.09. The next higher high at 42.86 is an easy one and should happen in 2025. It can definitely go higher but I am no stocks expert so can't dig any deeper for you.
In support of these signals, I looked for the RSI and found a small bullish divergence. It is only a month old but it is still a bullish divergence and it is valid. The reading on the RSI is also good and supports a new wave of growth. It seems Crypto and the stock market are now one.
Trading volume is standard and average and does not support our bullish bias, but it doesn't negate either. Average volume with no change on the upside or downside supports a neutral market. A market on autopilot. If there was a bearish move this bearish move is not strong as it is not supported by volume. So the early reversal signals can be good as there is nothing to hold the bearish wave. Things can change, but we are not talking about that, we are looking at the chart and what it currently says.
The chart is saying that MARA can start to grow in the coming weeks and days. If this growth develops, it can last months and end up in a new high, a higher high based on the long-term.
Thank you for reading and for your continued support.
Namaste.

MARA ($MARA) Q4—$214.4M HAUL STUNS MARKETMARA ( NASDAQ:MARA ) Q4—$214.4M HAUL STUNS MARKET
(1/9)
Good Morning, TradingView! MARA Holdings ( NASDAQ:MARA ) smashed Q4 ‘24 with $ 214.4M revenue, up 37% YoY 🌍 Bitcoin hoard hits $ 3.94B—let’s unpack this mining beast! 💰
(2/9) – REVENUE SURGE
• Q4 Take: $ 214.4M, 37% up from $ 156.8M 📈
• Net Income: $ 528.3M, 248% leap 🌟
• BTC Price: 132% boost adds $ 119.9M 💸
NASDAQ:MARA ’s cashing in—halving? What halving?
(3/9) – BLOCKS BUZZ
• Blocks Won: 703, up 25% from 562 🚗
• Hashrate: 53.2 EH/s, 115% jump 🔧
• EPS: $ 1.24, beats $ 0.32 loss call 🌞
NASDAQ:MARA ’s grinding—blocks stack, stock pops!
(4/9) – BTC HOARD
• Stash: 45,659 BTC, $ 3.94B haul 🌍
• Growth: 197% since Jan ‘24—22,065 bought 💼
• Bitdeer: $ 532M loss—ouch 😕
NASDAQ:MARA ’s stacking—rival’s stumbling!
(5/9) – RISKS IN SIGHT
• Costs: $ 127.4M energy, up 70% ⚠️
• Volatility: BTC swings sting 🐻
• Halving: $ 64.2M output hit 🔒
NASDAQ:MARA ’s hot—can it dodge the chill?
(6/9) – SWOT: STRENGTHS
• Haul: $ 214.4M, profit beast 💪
• Blocks: 25% more—mining grit 🏋️
• Hoard: $ 3.94B BTC—stack king 🌱
NASDAQ:MARA ’s tough—built to last!
(7/9) – SWOT: WEAKNESSES & OPPORTUNITIES
• Weaknesses: Energy costs bite 🙈
• Opportunities: BTC price, AI pivot—zing 🌏
Can NASDAQ:MARA vault past the snags?
(8/9) – NASDAQ:MARA ’s $ 214.4M Q4, what’s your vibe?
1️⃣ Bullish, $ 20+ stacks up 😎
2️⃣ Neutral, Solid, risks linger 🤷
3️⃣ Bearish, Costs clip it 😞
Vote below! 🗳️👇
(9/9) – FINAL TAKEAWAY
NASDAQ:MARA ’s $ 214.4M Q4 and $ 3.94B BTC pile stun—mining hauler Costs creep, but grit shines—gem or bust?

MARA Holdings Options Ahead of Earnings If you haven`t bought the dip on MARA:
Now analyzing the options chain and the chart patterns of MARA Holdings prior to the earnings report this week,
I would consider purchasing the 13usd strike price Calls with
an expiration date of 2025-6-20,
for a premium of approximately $2.37.
If these options prove to be profitable prior to the earnings release, I would sell at least half of them.


Sellers are interested to bring price down, near to 8 USDBased on the weekly charts, if MARA closed below 18.5 USD on Friday then i am assuming that it will touch 8 USD very shortly.

MARA Long After perfectly executing the last MARA trade, we are back for another one.
Backtest of support and 200MA after breaking out of the bullish dragon.
Resolution of bullish divergence on the oscillators.

MARA - Is it finally time for a BIG MOVE?!NASDAQ:MARA
The biggest lesson I've learned about Crypto sympathy plays is that CRYPTOCAP:BTC & others will run a lot and they will run a little.
As you see we could get a Volume GAP fill up to $25 if crypto continues higher.
Not financial advice

Bullish Analysis for MARA Holdings, Inc. (MARA) 🔥 1. Strong Crypto Correlation
Bitcoin Surge: Bitcoin is trading near $105,000, directly boosting MARA’s profitability as a leading Bitcoin mining company.
Trump’s Pro-Crypto Policies: With Trump re-entering office next week, expectations for pro-crypto regulations are fueling optimism in the crypto sector.
💰 2. Operational Expansion
Data Center Growth: MARA’s acquisition of two data centers in Ohio has increased operational capacity by 70%, positioning the company for long-term growth.
Natural Gas Power Project: MARA’s pilot project for power generation reduces costs and adds sustainability, a competitive edge in mining operations.
⚡️ 3. Growth Potential
Bitcoin Reserves: MARA holds 40,435 BTC, valued at $4.2 billion, providing significant asset backing.
Market Position: MARA is diversifying into AI and high-performance computing, expanding its revenue streams beyond Bitcoin mining.
📈 4. Technical and Price Action
Support: The price is firmly respecting the long-term uptrend support, and the recent bounce off this level confirms the start of a new bullish wave.
Momentum: RSI and Stochastic Oscillator show increasing bullish momentum, signaling further upside potential.
🔹 Price Targets:
🎯 $23 (+15.0%)
🎯 $27 (+35.0%)
🎯 $30 (+50.0%)
₿ 5. Crypto Sector Leadership
MARA remains one of the most influential Bitcoin mining companies, perfectly positioned to benefit from the ongoing crypto market rally and favorable macroeconomic policies.
💡 Conclusion
With Bitcoin’s rise, Trump’s supportive policies, operational expansion, and bullish technical indicators, MARA offers a compelling opportunity for strong returns. 🌟
