Graphic and fundamental analysis of Marathon (MARA)1. Graphical Analysis
Since the all-time high, the price has dropped 99% on March 16, 2020 in the pandemic crisis.
It then rose 23000% reaching the peak on November 15, 2021, exactly one year ago.
However, it was insufficient to recover the historic maximum.
It is now in a definition region.
It needs to break the psychological resistance of $10 and after $20 to re-up in a macro trend.
2. Fundamental Analysis
2.1. Earns per Share
"EPS stands for earnings per share. Investors use EPS to measure how much money a company makes for every outstanding share the company has. Diluted EPS is slightly different in that it measures the earnings per share for a company if all convertible securities (such as preferred stocks, convertible debt instruments, stock options and warrants) were used to calculate the metric.
Diluted earnings per share provides a picture of the true shareholder base and how the company's earnings are distributed. Diluted EPS is an important metric for shareholders because it determines the profit shareholders will receive in a scenario that includes all securities from preferred stocks to stock options and warrants."
The fundamental indicator remains stable below zero, only reiterating the absence of profit most of the time.
2.2. Net Income
"Net Income shows how much money a company earns after expenses. Net Income represents the amount of money a company earns after all operating expenses, interest, taxes and dividends on preferred shares have been paid for. If Net Income is negative, it means that a company spent more money than it earned In other words, they lost money.
Net income shows investors if a company is profitable or not. When a company can earn more money than it spends, it’s net income is positive. These profits can potentially be distributed to shareholders through dividends, buybacks, or investment back into the company. However, it's important to remember that companies use different methods to determine Net Income depending on their location and earnings report."
The good news is that the damage is reduced.
2.3. Net Debt
"Net Debt represents the amount of debt that would remain after a company had paid off as much debt as possible with its liquid assets. This financial metric shows how well the company can handle its current obligations and if it has the ability to take on more debt in the future.
Net Debt can be calculated as Total Debt minus Cash & Short Term Investments".
The remaining debt got worse.
2.4. Free Cash Flow
"Free Cash Flow (FCF) represents the cash that a company generates as a result of its activities, excluding on expenses assets. Free Cash Flow is sometimes considered the hardest financial metric to fake because of its calculation and for that reason, it's a popular financial metric in the investor community.
Free Cash Flow signals a company's ability to pay debts and dividends, repurchase shares and contribute to business growth."
The value fluctuated from 20 million to 2 million, but at least it remains positive.
2.5. Total Equity
"Total Equity is what's left after subtracting total liabilities from total assets. It represents the amount that belongs to the joint-stock company. It includes Shareholders' Equity and Minority Interest.
Total Equity is important because it represents the value of the investor's share in the securities or company. Investors who own shares in a company are usually interested in the equity of the company represented by their shares."
The value did not undergo a small downward swing.
2.6. P/E Ratio
"The Price to earnings ratio measures the market price of a stock relative to its earnings per share. This metric shows how much profits are willing to pay for the company the company generates.
A high price to earnings ratio and a low price to earnings ratio can mean different things. Some investors believe that a high price to earnings ratio means a company is becoming expensive and possibly overvalued. A low price to earnings ratio may mean that a company is undervalued or cheap. Of course, this is not always true as sometimes a company has a high price to earnings ratio because it is growing fast and expected to grow into its high price to earnings ratio."
The value did not suffer major fluctuations. It remains stable below zero, reflecting the absence of profit.
2.7. P/CF Ratio
"Price to operating cash flow is the ratio of the share price to operating cash flow. Essentially, Price to operating cash flow measures how much money a company generates relative to its share price.
Price to cash flow is considered to be a more indicative investment measurement metric than Price to earnings per share because cash flows cannot be manipulated as easily as incomes. Some companies seem unprofitable due to large non-cash expenses, even if they have positive cash flows."
The value has remained relatively stable and positive since March 2021.
Marathondigital

MARA - Inverted Cup and Handle Pattern We expect that the price will be decrease. The price of the MARA is forming a potential inverted cup and handle pattern. RSI is overbought and shows us that it is selling time.
Entry, stop-loss, and target levels are in the chart.

September 30, 2022 - Marathon Digital Holdings, Inc. - MARA - This is a quick update on my investment in Marathon Digital Holdings, Inc. -
This video shares my experience trading MARA as a retail investor.
The markets have shown to be quite volatile in the past weeks and many people are speculating that due to inflation, negative GDP growth and the FED's policies along with the repercussions of COVID lock down and the UKRAINE war with RUSSIA has led to an unstable stock market and higher energy and food costs to the average individual around the world.
To combat this, I think it is a great skill to learn how to make $ trading stocks, crypto, ETF's and options.
Of course, there are risks involved and this is not financial advice.
I am simply providing my experience trading MARA - note I have already made profits in the past on this stock, and I started investing in MARA at $6.50.
Please smash the boost button if you like this content and I will continue providing updates on my position.


The MARA-ETH relationship goalsA good buddy gave some heads up about MARA, and we had a short discussion about MARA. He mentioned that MARA and Crypto had some relationship and I was a little skeptical that MARA would be close enough in relation to crypto, and also wondered if there was any relationship, what might it be.
So, from purely a technical perspective, I pulled up MARA and overlaid ETHUSD on the weekly chart. Some adjustment requires for the overlay and it appeared that my buddy was perhaps onto something! Honestly, I have not enough research into MARA, but for what it is worth, it appears that MARA leads ETHUSD, in a somewhat casual open relationship IMHO (pun not intended).
You see, as MARA rallies, it does this ahead of ETHUSD. And it also appears to lead in the downside aspects too. Both have about 1-2 week lead.
Currently, it does appear that MARA is in bearish stance, with a bearish candle last week that closed a gap. Technical indicators apparently struggle to mitigate the bearishness.
In the daily MARA chart, the recent rally is oer, with a solid gap down end of last week. Technical indicators also support a bearish stance, with more downside expected.
Immediate support levels are about 12, and then 8.50. Resistance is clearly at 14.
Given this casual relationship, if it is sufficiently robust to hold, we might co-relate that ETHUSD is having some downside risk for the rest of August, and into early September, with a possible bounce off later in September, perhaps on the back of The Merge?
I would keep an eye out on MARA... just to see if this relationship achieves some longer term goals.
Tell me what you think, and if this makes sense to you too?

Marathon effort required to invalidate the bearish threatMarathon Digital Holdings - Short Term - We look to Sell at 15.05 (stop at 19.95)
An overnight negative theme in Equities has led to a lower open this morning. We have a Gap open at 15.05 from 18/08/2022 to 19/08/2022. Broken out of the channel formation to the downside. Further downside is expected although we prefer to set shorts at our bespoke resistance levels at 15.05, resulting in improved risk/reward.
Our profit targets will be 5.10 and 4.50
Resistance: 15.05 / 18.88 / 19.43
Support: 10.08 / 8.04 / 5.20
Disclaimer – Saxo Bank Group. Please be reminded – you alone are responsible for your trading – both gains and losses. There is a very high degree of risk involved in trading. The technical analysis, like any and all indicators, strategies, columns, articles and other features accessible on/though this site (including those from Signal Centre) are for informational purposes only and should not be construed as investment advice by you. Such technical analysis are believed to be obtained from sources believed to be reliable, but not warrant their respective completeness or accuracy, or warrant any results from the use of the information. Your use of the technical analysis, as would also your use of any and all mentioned indicators, strategies, columns, articles and all other features, is entirely at your own risk and it is your sole responsibility to evaluate the accuracy, completeness and usefulness (including suitability) of the information. You should assess the risk of any trade with your financial adviser and make your own independent decision(s) regarding any tradable products which may be the subject matter of the technical analysis or any of the said indicators, strategies, columns, articles and all other features.
Please also be reminded that if despite the above, any of the said technical analysis (or any of the said indicators, strategies, columns, articles and other features accessible on/through this site) is found to be advisory or a recommendation; and not merely informational in nature, the same is in any event provided with the intention of being for general circulation and availability only. As such it is not intended to and does not form part of any offer or recommendation directed at you specifically, or have any regard to the investment objectives, financial situation or needs of yourself or any other specific person. Before committing to a trade or investment therefore, please seek advice from a financial or other professional adviser regarding the suitability of the product for you and (where available) read the relevant product offer/description documents, including the risk disclosures. If you do not wish to seek such financial advice, please still exercise your mind and consider carefully whether the product is suitable for you because you alone remain responsible for your trading – both gains and losses.

Mara SAFER Way DOTM Puts 2 OutcomesThe Trifecta Income play is designed to either generate income or gets the stock assigned to you at a lower cost.
YOU SHOULD ONLY USE THIS TECHNIQUE ON STOCKS YOU WANT TO HOLD FOR LONG TERM.
Pay attention to the company as you do not want get a stock that is in a declining industry like KODAK when digital cameras came out.
We do this by selling a DOTM put, that immediately generates income at the expense of our buying power. In this case, we are selling the:
MARA Jan 2023 $5 PUT
for a net credit of $1.38/share or $138/contract, and a reduction in buying power of $362 per contract.
Assuming that the MARA closes remains above $5 through Jan 2023, our return is:
$5 share price / $ 1.38 credit = 27.6%
We can do this because the have a target support zone from 4.5 to 5.5 with a target resistance zones of 15.
There are two possible outcomes:
1) MARA closes above $5 by expiration in which case we keep the entire credit for a return of 27.6%
2) MARA closes below $5 at expiration in which case we get assigned at $5. Because of the credit our cost basis for the stock is $5 - less the credit received $1.38 for a cost basis of $3.62 which is below our target support zone of $4.5.
Net result, we have a safety of margin from the current stock price of $9.78 - $3.62 (assignment cost) of $6.16, which means we have a safer entry at reduced cost using this safer trade structure.
Hope it helps
Marc

MARA Breakout $ Target we going to see a huge momentum up if we held above our current support above the 13.30$ , we going to have 2 profit taking around 17.40$ , and the 19.60$.
NASDAQ:MARA

the cleanest chart ever, for a 100% Well, this is one of those stocks that you have to own, just in a week increased the value in 80% and the chart is very clean and following the crypto trend, btw the symmetrical triangle in bitcoin chart is the start of a bull trend in bitcoin.

MARA: 21% gain on Friday!Marathon Digital Holdings
Short Term
We look to Buy at 7.59 (stop at 6.31)
We look to buy dips. This stock has recently been in the news headlines. Trading volume is increasing. Yesterday's move higher brings an end to the run of consecutive lower highs. Previous resistance, now becomes support at 7.50.
Our profit targets will be 11.16 and 14.99
Resistance: 11.17 / 20.00 / 31.30
Support: 7.50 / 5.30 / 3.50
Disclaimer – Saxo Bank Group. Please be reminded – you alone are responsible for your trading – both gains and losses. There is a very high degree of risk involved in trading. The technical analysis, like any and all indicators, strategies, columns, articles and other features accessible on/though this site (including those from Signal Centre) are for informational purposes only and should not be construed as investment advice by you. Such technical analysis are believed to be obtained from sources believed to be reliable, but not warrant their respective completeness or accuracy, or warrant any results from the use of the information. Your use of the technical analysis, as would also your use of any and all mentioned indicators, strategies, columns, articles and all other features, is entirely at your own risk and it is your sole responsibility to evaluate the accuracy, completeness and usefulness (including suitability) of the information. You should assess the risk of any trade with your financial adviser and make your own independent decision(s) regarding any tradable products which may be the subject matter of the technical analysis or any of the said indicators, strategies, columns, articles and all other features.
Please also be reminded that if despite the above, any of the said technical analysis (or any of the said indicators, strategies, columns, articles and other features accessible on/through this site) is found to be advisory or a recommendation; and not merely informational in nature, the same is in any event provided with the intention of being for general circulation and availability only. As such it is not intended to and does not form part of any offer or recommendation directed at you specifically, or have any regard to the investment objectives, financial situation or needs of yourself or any other specific person. Before committing to a trade or investment therefore, please seek advice from a financial or other professional adviser regarding the suitability of the product for you and (where available) read the relevant product offer/description documents, including the risk disclosures. If you do not wish to seek such financial advice, please still exercise your mind and consider carefully whether the product is suitable for you because you alone remain responsible for your trading – both gains and losses.

Mara the same? Marathon Digital Holdings
Short Term - We look to Sell at 11.03 (stop at 12.16)
Preferred trade is to sell into rallies. Trend line resistance is located at 11.00. There is scope for mild buying at the open but gains should be limited. The bias is still for lower levels and we look for any gains to be limited.
Our profit targets will be 8.62 and 5.19
Resistance: 11.00 / 12.00 / 20.00
Support: 8.80 / 5.20 / 1.50
Disclaimer – Saxo Bank Group. Please be reminded – you alone are responsible for your trading – both gains and losses. There is a very high degree of risk involved in trading. The technical analysis, like any and all indicators, strategies, columns, articles and other features accessible on/though this site (including those from Signal Centre) are for informational purposes only and should not be construed as investment advice by you. Such technical analysis are believed to be obtained from sources believed to be reliable, but not warrant their respective completeness or accuracy, or warrant any results from the use of the information. Your use of the technical analysis, as would also your use of any and all mentioned indicators, strategies, columns, articles and all other features, is entirely at your own risk and it is your sole responsibility to evaluate the accuracy, completeness and usefulness (including suitability) of the information. You should assess the risk of any trade with your financial adviser and make your own independent decision(s) regarding any tradable products which may be the subject matter of the technical analysis or any of the said indicators, strategies, columns, articles and all other features.
Please also be reminded that if despite the above, any of the said technical analysis (or any of the said indicators, strategies, columns, articles and other features accessible on/through this site) is found to be advisory or a recommendation; and not merely informational in nature, the same is in any event provided with the intention of being for general circulation and availability only. As such it is not intended to and does not form part of any offer or recommendation directed at you specifically, or have any regard to the investment objectives, financial situation or needs of yourself or any other specific person. Before committing to a trade or investment therefore, please seek advice from a financial or other professional adviser regarding the suitability of the product for you and (where available) read the relevant product offer/description documents, including the risk disclosures. If you do not wish to seek such financial advice, please still exercise your mind and consider carefully whether the product is suitable for you because you alone remain responsible for your trading – both gains and losses.

At bottom of bullish wedge Target 120'sBottom of the bullish wedge, I think we're in a great buy area, hard to believe but I think Bitcoin still has it's blowoff top and Bitcoin Miners will outpeform Bitcoin and the better stock to buy.

Another short on Marathon. MARAGoals 24, 22, 19. Invalidation at 34 .
We are not in the business of getting every prediction right, no one ever does and that is not the aim of the game. The Fibonacci targets are highlighted in purple with invalidation in red. Fibonacci goals, it is prudent to suggest, are nothing more than mere fractally evident and therefore statistically likely levels that the market will go to. Having said that, the market will always do what it wants and always has a mind of its own. Therefore, none of this is financial advice, so do your own research and rely only on your own analysis. Trading is a true one man sport. Good luck out there and stay safe

MARA: Short the Resistance? Marathon Digital Holdings - Short Term - We look to Sell at 32.15 (stop at 37.41)
We look to sell rallies. The medium term bias remains bearish. Previous resistance located at 32.00. The bias is still for lower levels and we look for any gains to be limited. The daily chart technicals suggests further upside before the downtrend returns.
Our profit targets will be 19.56 and 16.44
Resistance: 32.00 / 40.00 / 55.00
Support: 20.00 / 18.00 / 16.00
Disclaimer – Saxo Bank Group. Please be reminded – you alone are responsible for your trading – both gains and losses. There is a very high degree of risk involved in trading. The technical analysis, like any and all indicators, strategies, columns, articles and other features accessible on/though this site (including those from Signal Centre) are for informational purposes only and should not be construed as investment advice by you. Such technical analysis are believed to be obtained from sources believed to be reliable, but not warrant their respective completeness or accuracy, or warrant any results from the use of the information. Your use of the technical analysis, as would also your use of any and all mentioned indicators, strategies, columns, articles and all other features, is entirely at your own risk and it is your sole responsibility to evaluate the accuracy, completeness and usefulness (including suitability) of the information. You should assess the risk of any trade with your financial adviser and make your own independent decision(s) regarding any tradable products which may be the subject matter of the technical analysis or any of the said indicators, strategies, columns, articles and all other features.
Please also be reminded that if despite the above, any of the said technical analysis (or any of the said indicators, strategies, columns, articles and other features accessible on/through this site) is found to be advisory or a recommendation; and not merely informational in nature, the same is in any event provided with the intention of being for general circulation and availability only. As such it is not intended to and does not form part of any offer or recommendation directed at you specifically, or have any regard to the investment objectives, financial situation or needs of yourself or any other specific person. Before committing to a trade or investment therefore, please seek advice from a financial or other professional adviser regarding the suitability of the product for you and (where available) read the relevant product offer/description documents, including the risk disclosures. If you do not wish to seek such financial advice, please still exercise your mind and consider carefully whether the product is suitable for you because you alone remain responsible for your trading – both gains and losses.

Mara is queued for lift offwith BTC making a strong recovery the past 3 days breaking from its bearish trend this next week 2/7 - 2/11 will be a large week for miners such as NASDAQ:MARA NASDAQ:RIOT and NASDAQ:HIVE . Key indicators of this will be BTCs strength and overall market stability. with MARA down 35% as of 2/3 and BTC continuing to show moderate strength and stability in its recovery we can expect these tickers to play catch up to BTCs leaps.
I currently hold 2/11 $22.50 Calls that i am expecting to 3x this week as we see the rise begin again from year lows.

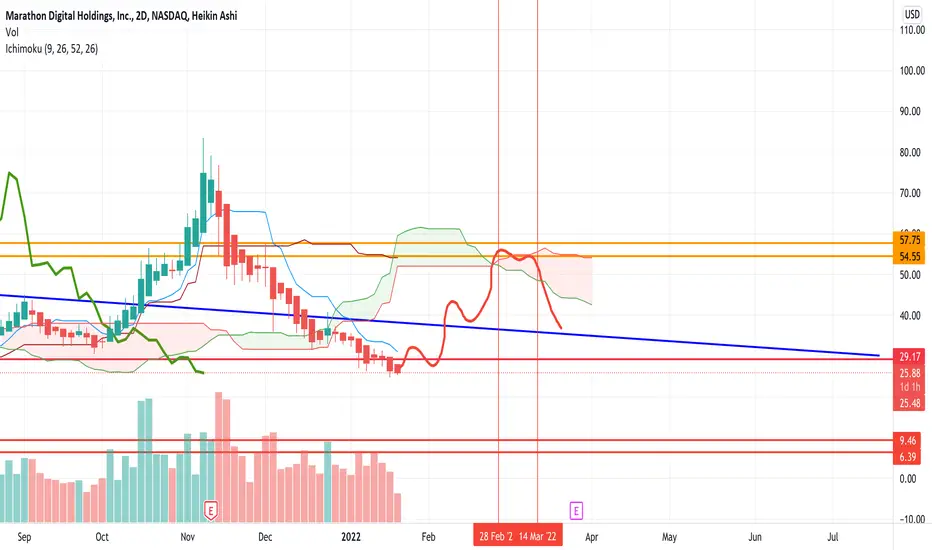
$MARA looks like it bottomed, can it push to $50+?$MARA looks to be forming a bottom here in the $25 range. I expect next week will start a move up.
I think we'll likely move up to retest the 50% retracement level at $54 and reject there (potentially a little higher at $57).
Let's see how it plays out over the coming weeks/months.
MARA: Further Downside Ahead? Marathon Digital Holdings - Short Term - We look to Sell at 33.35 (stop at 38.33)
We look to sell rallies. Previous support, now becomes resistance at 32.00. 20 1day EMA is at 34.00. The bias is still for lower levels and we look for any gains to be limited.
Our profit targets will be 21.26 and 19.75
Resistance: 32.00 / 40.00 / 50.00
Support: 25.00 / 20.00
Disclaimer – Saxo Bank Group. Please be reminded – you alone are responsible for your trading – both gains and losses. There is a very high degree of risk involved in trading. The technical analysis, like any and all indicators, strategies, columns, articles and other features accessible on/though this site (including those from Signal Centre) are for informational purposes only and should not be construed as investment advice by you. Such technical analysis are believed to be obtained from sources believed to be reliable, but not warrant their respective completeness or accuracy, or warrant any results from the use of the information. Your use of the technical analysis, as would also your use of any and all mentioned indicators, strategies, columns, articles and all other features, is entirely at your own risk and it is your sole responsibility to evaluate the accuracy, completeness and usefulness (including suitability) of the information. You should assess the risk of any trade with your financial adviser and make your own independent decision(s) regarding any tradable products which may be the subject matter of the technical analysis or any of the said indicators, strategies, columns, articles and all other features.
Please also be reminded that if despite the above, any of the said technical analysis (or any of the said indicators, strategies, columns, articles and other features accessible on/through this site) is found to be advisory or a recommendation; and not merely informational in nature, the same is in any event provided with the intention of being for general circulation and availability only. As such it is not intended to and does not form part of any offer or recommendation directed at you specifically, or have any regard to the investment objectives, financial situation or needs of yourself or any other specific person. Before committing to a trade or investment therefore, please seek advice from a financial or other professional adviser regarding the suitability of the product for you and (where available) read the relevant product offer/description documents, including the risk disclosures. If you do not wish to seek such financial advice, please still exercise your mind and consider carefully whether the product is suitable for you because you alone remain responsible for your trading – both gains and losses.

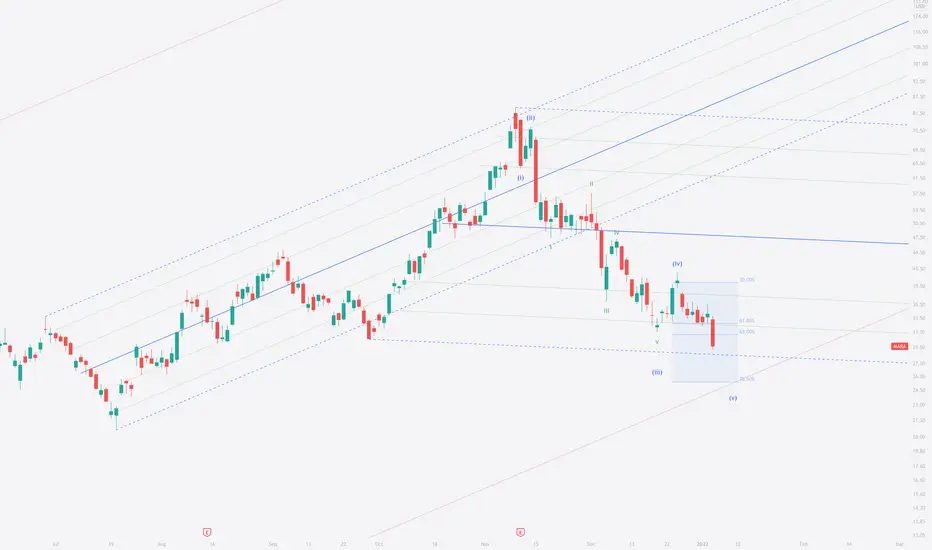
MARA, 6 Jan: Almost a Buy.MARA has lost -65% since November. Let’s take a look if we can pick up the stock from the bottom.
Elliott:
The count suggests that a 5-wave move is about to complete. This can be interpreted as wave C of a larger degree.
Geometry:
If the pitchfork is drawn correctly, we may have a potential support at the lower boundary. The 4th extension of the upward facing channel is a bit lower at 25, which is the same level as the 78.6% retracement.
Oscillators:
The Stochastic is oversold and due to move up. The RSI shows a bullish divergence.
Correlations:
For MARA to move up, we need:
Bitcoin to bottom out and start a new bullish sequence.
DXY to not break the current resistance and drop lower.
How to trade it:
The idea is to test long positions as MARA approaches the potential supports, and build further long exposure when price makes a higher high that breaks the downward trend. It is possible to trade RIOT for diversification. The idea is invalidated if Bitcoin shows no signs of recovery.
Marathon Digital $MARA measured against the VIXThe favour of Bitcoin mining companies has been growing together with the increased adoption and recognition of CRYPTOCAP:BTC worldwide. Big whoop. See the accumulation/distribution since the May earnings report.
What's interesting here is how tightly it follows the VIX . For the purpose of emphasis on this, the VIX chart at the top is inverted .
At the moment a falling wedge is forming, if the VIX stays at this level, MARA should work its way back to 0.382 fib level and look to retest the resistance level.
Merry Christmas and a Happy New Year!
🎄🎅🎄

Marathon Digital Analysis 09.12.2021Hello Traders,
welcome to this free and educational analysis.
I am going to explain where I think this asset is going to go over the next few days and weeks and where I would look for trading opportunities.
If you have any questions or suggestions which asset I should analyse tomorrow, please leave a comment below.
If you enjoyed this analysis, I would definitely appreciate it, if you smash that like button and maybe consider following my channel.
Thank you for watching and I will see you tomorrow!

MARA overcookedMARA is looking slightly overcooked. There is potential to short/buy puts and ride down till it fills the gap up. It could have a further downside but is highly unlikely unless BTC sells off. RSI extremely overbought, MACD in nose bleed territory

IT'S HAPPENING! BULL AUTUMN AHEAD IN CRYPTO LAND!As discussed at length a couple of months ago, we've been keeping a close eye on the internal strength relationship between Marathon Digital Holdings (an American Bitcoin mining company) and the Bitcoin spot price.
As we can see, the soon four year long reversed head and shoulders pattern has now gotten a technical breakout. As long as this DOESN'T turn into a fakeout, we can safely conclude that Bitcoin is in for an autumn rally!
Why then is that?
Well, just as Coca Cola won't lower their prices on their tooth-acid nightmare should the price of sugar skyrocket, neither would Marathon itself trend whilst Bitcoin is dumping.
Based on the near 4-year long technical build-up, there is A LOT of upwards pressure amidst a north-bound breakout, like now. Hence, we can naturally conclude that Bitcoin is either ready to truly move, or at least to continue consolidating with time, as in a price-based correction, above THIS key horizontal support zone.
We have recently discussed how Bitcoin could be in for a nasty flat down to $22,000-25,000. Is that entirely nullified then?
Yes and no. As long as this internal breakout in Marathon versus Bitcoin (NASDAQ:MARA/BITSTAMP:BTCUSD) DOESN'T turn into a fakeout, then yes: the flat threat is cancelled.
If, however, we were to see a soon-to-come break below the technical neckline, then you can bet the farm Bitcoin will go down there.
As for now, given the immense risk to reward, I have put all of my eggs into Cardano, Ethereum, Marathon Digital Holdings and Polkadots - all of which are some of the strongest technical prospects right now.
With that said, I WILL release EVERYTHING upon a break down below the neckline. And the reason is simple: fakeouts tend to move highly aggressively in the opposite direction. In such case, you can take the low to mid 20 000s targets to the bank.

A reasonable path for MARA to get too 100On the back of the crypto run I think the miner stocks have some good plays as well, especially those with options.
