THE Confirmation For New Bitcoin All-Time HighsBitcoin is being difficult as always. Yet, despite its sudden twists and turns, we've called every major reversal thus far since the April peak.
Naturally, technical analysis is all based on probabilities. We don't KNOW where the price is going. The best thing we can do is to produce the most likely case and then add onto it as more pieces of the technical puzzle are being laid in our favor.
Now, is Bitcoin bound for the low $20 000s to complete its high likelihood zigzag? ...
... Is it range bound here for some time to follow? ...
... or is it ready for new all-time highs?
Normally, these are simple questions with difficult answers - that is, difficult if you restrict yourself to the Bitcoin chart only.
What then do I mean by that? Well, lo and behold, for I hereby present to you technical proof of when we can know for certain whether Bitcoin is ready for new all-time highs. Here's how ...
Marathon Digital Holdings, Riot and Hut 8 are all Bitcoin mining companies, whose respective stock developments are in direct relation to that of Bitcoin's spot price. We will therefore take a look at Marathon versus that of Bitcoin!
To access this chart, please enter: NASDAQ:MARA/BITSTAMP:BTCUSD in the search box up to your left.
Literally, what this shows is the internal strength relations between the Marathon stock and Bitcoin's spot price.
This chart is on the weekly:
What first meets the eye is a big reversed head and shoulders formation at which we've been rejected no less than four times by the neck line.
On top of that, we have a clear sideways range of which the upper resistance is the same as the H&S neck line.
Now, if you were to have bought Marathon instead of Bitcoin in April last year, you would have had 1 650% more profits. That's how significantly Marathon has rallied amidst Bitcoin's bullish run.
But what then is the deal with all of this? Reversed head and shoulders, a sideways range ... sure, we get it! Now what?
At first glance this may seem irrelevant. But once we dig deep, it in fact holds all the answers we need.
If Bitcoin were to begin trending in a truly bullish fashion, we can safely expect Marathon to vastly outperform Bitcoin's spot price. This would mean that we'd eventually see a technical outbreak both from the sideways range AND the reversed head and shoulders pattern. And given how strong this level of resistance has been historically (and equally so as support at the very beginning) we can expect a violent move once the price breaks! For the more times a support or resistance is being tested, the stronger a reaction is to be technically expected.
Given that Marathon won't rally unless Bitcoin does, and given the pent up powers that will be released upon a technical breakout between Marathon versus Bitcoin, unless it results in a fakeout, we can safely anticipate Marathon to outperform that of Bitcoin by around 280-350%.
This means that if Bitcoin were to quadruple from here, as in reaching $170 000, we can expect Marathon to ultimately amount to $500-600.
If, on the other hand, Bitcoin were to roll over and lose its bulls versus bears gatekeeper support between $41,000-42,700 (as discussed in detail previously here on TradingView) then we can safely expect Marathon to further under perform versus that of Bitcoin. In such case, a retest of the diagonal line would be a likely indication of Bitcoin having bottomed out. This would be THE ideal place to ladder in longs. If that diagonal support were to break, then the next level of support is the horizontal one, at a -50% under performance for Marathon. If that one breaks, then we have a long standing bear market on our hands.
I will base every Bitcoin decision from here on on this very chart.
I hope this has helped you bring full clarity to Bitcoin and how and when we'll know whether it's ready for new all-time highs.
All the best,
LLT
Marathondigital

MARA Daily TimeframeSNIPER STRATEGY (new version)
It works ALMOST ON ANY CHART.
It produces Weak, Medium and Strong signals based on consisting elements.
NOT ALL TARGETS CAN BE ACHIEVED, let's make that clear.
TARGETS OR ENTRY PRICES ARE STRONG SUPPORT AND RESISTANCE LEVELS.
ENTRY PRICE BLACK COLOR
TARGETS GREEN COLOR
STOP LOSS RED COLOR
DO NOT USE THIS STROTEGY FOR LEVERAGED TRADING.
It will not give you the whole wave like any other strategy out there but it will give you a huge part of the wave.
The BEST TIMEFRAMES for this strategy are Daily, Weekly and Monthly however it can work on any timeframe.
Consider those points and you will have a huge advantage in the market.
There is a lot more about this strategy.
It can predict possible target and also give you almost exact buy or sell time on the spot.
I am developing it even more so stay tuned and start to follow me for more signals and forecasts.
START BELIEVING AND GOOD LUCK
HADIMOZAYAN

MARA Daily TimeframeSNIPER STRATEGY
This magical strategy works like a clock on almost any charts
Although I have to say it can’t predict pullbacks, so I do not suggest this strategy for leverage trading.
It will not give you the whole wave like any other strategy out there but it will give you huge part of the wave.
The best timeframe for this strategy is Daily, Weekly and Monthly however it can work any timeframe above three minutes.
Start believing in this strategy because it will reward believers with huge profit.
There is a lot more about this strategy.
It can predict and also it can give you almost exact buy or sell time on the spot.
I am developing it even more so stay tuned and start to follow me for more signals and forecasts.

MARA possible moveMara has had a rough few month but is starting to show power again alongside the rise of Bitcoin. If Bitcoin continues to rise and exceeds 50.000 dollars Mara will have strength to break the major resistance in 39.69 dollars.

Marathon Digital Holdings WeaknessMarathon is displaying one sign of weakness after another. It just broke out of its ascending channel, which disqualified both the lower bullish red RSI buy signals that we got recently, both on the hourly and the daily chart. This is bad news. Real bad. Especially so as it now leaves the daily RSI in a much weak position, one that paves the way for further drops to the downside.
Additionally, what we thought to be an initial ABC Elliott correction seems to rather be a 12345 correction. If Bitcoin were to drop down towards the low to mid 20 000s, then Marathon should stand a good chance of hitting its 5th wave target around the horizontal support at $14,00-14,50.

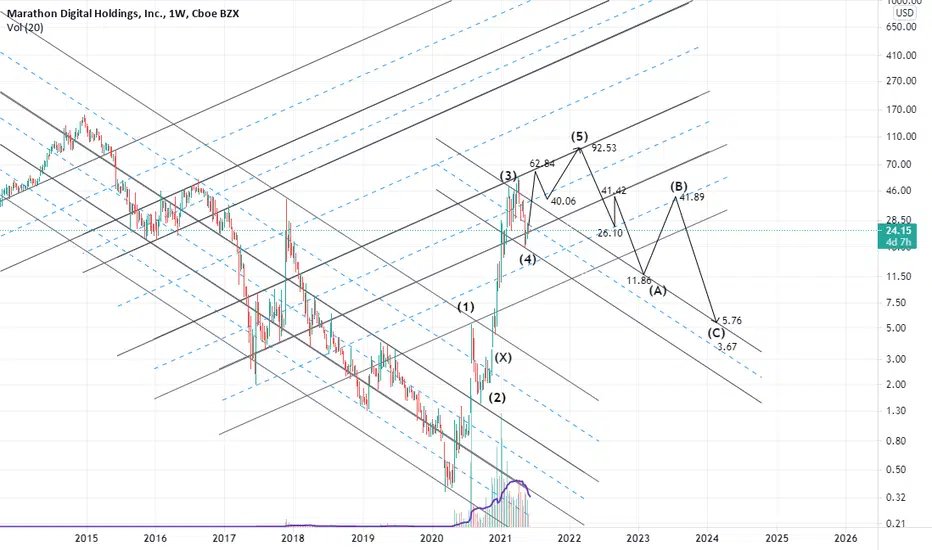
the 5th wave of Elliott is starting with a $92 targetcypher harmonic pattern:
3-4=0.38 X-3
4-5=1.42 3-4=$92
tp1=0.78 4-5=$26
tp2=1.27 4-5=$11.86
tp3=0.78 X-3=$5.76
tp4=2 4-5=$3.67
Quick ChartCup and Handle? With more volume, potential breakout. Heck, nowadays everything is a potential breakout LOL


MARA Marathon Digital Holdings $70 option callsInvestors in Marathon Digital Holdings, Inc. MARA need to pay close attention to the stock based on moves in the options market lately. That is because the Apr 16, 2021 $70.00 Call had some of the highest implied volatility of all equity options today. (zacks.com)
The indicators are still looking bullish on the daily, despite today`s correction.
So is MARA a still a buy???
Market Cap 3.879B
I am looking forward for your opinion to make a decision myself.
If you missed my comparison to EBON:
If you missed my hashrate comparison with DMG blockchain:
If you are also interested to test some amazing BUY and SELL INDICATORS that i use, which give the signal at the beginning of the candle, not at the end of it, just leave me a message.
