Gold and DXY - What does 94+ imply? "Look for the arch in March"Gold has been in consolidation since the summertime highs. The fundamental picture for gold is the same and strengthening. Lots of noise about the rising dollar and the 'end-of-days' for precious metals.
While there are many obvious cases for Gold fundamentals, we are often presented with the binary view (ST speculator noise) where DXY and GOLD have an inverse relationship. Instrumental correlation with gold in fact changes over time, for example since 2019 TLT and US10Y have been much more closely correlated with GOLD, but we won't dismiss the psychological impact of a rising DXY. So here is where I think we are based on past patterns.
Looking for a rising DXY in a gold bull market phase takes us back to 2010, analogous to where we are now assuming (somewhat) symmetrical bull markets. This window shows a period of initial decline into support and then strengthening along with the DXY. This 181-day window for this phase to play out can be applied to where we are now with some success. From an initial turn-up of the DXY and the simultaneous drop from highs, we bottom this first decline in early March at NOV LOW levels.
This test of NOV 30 LOWS in EARLY MARCH (1764 around the ~5th?) tests the 10yr arc support, before a similar rise of equal value brings us back to testing the summer highs and beyond. The DXY can continue to rise, which may initiate the sell-off into support before resuming the up-trend in spring into summer. I think this early March bottom is supported by the similar NOVEMBER/MARCH 2012 (Yellow) resistance tests at the same level, now flipped to support. I'm not a big believer in seasonality for gold, as much as I would say, CORN, but the NOV/MAR 1764 symmetry is noted!
One concern with this may be that 94 on the DXY (above the yellow horizon in the lower pane) is a much higher, more psychological level than was present in 2010. A rise from current levels into and through 94 is marked out in purple April 2018 window by a similar selloff and eventual resumption.
This is the most I've felt like writing here, maybe my presentation skills need to catch up with my thinking. But let's sum up by saying:
"LOOK FOR THE ARCH IN MARCH" - March 5th 1764 support, bull off double bottom to test highs in July
BONUS: This model gives an initial PT for OCT 2022 of 2648. But let's get through March first.
Zoom out, chill out. Peace.
March

XRP looking to test the march 2020 support level?It looks like we are heading to test the march 2020 support level. Hopefully, I'm wrong. If not, we may start a reversal to the upside in order to test the June 2019 resistance.
This is not financial advice. You are responsible for your own money.

FCPO MAC 2021 UptrendFCPO still an uptrend, the price today failed to break the lower line of the parallel channel.


Bitcoin targets for January and March 2021If this channel that I have proves to be consistent with previous 2017 bull pattern then I am giving two points as possible short term highs and lows. For the month of January I have a possible high of over $34k and in March we can set our first lower high at around $21k going into the first quarter of 2021.

Alcista hasta 67.00Se evidencia un pull back, en 61.429 donde rompio la banda de Bollinger inferior, el stocasticos y el RSI dando. Un stop loss recomendado si abrimos en este precio (64.672) es al menos hasta 62.280 cuando mucho, pues es el soporte mas reciente en la escala de tiempo.
En el Take profit, si debemos estar atentos, debido a la inestabilidad del mercado a corto plazo dudo que llegue a precios tipo 70.00 a 73.00, por lo que is estan operando en scalping les recomiendo un Take profit en 67.645 hasta 68.00

SPX MARCH CORONAVIRUS LONG POS...Guess I am not the only with this kind of analysis... What do you think?

TSLA - Optimal Buy Date = March 2020 per youtube brschultz TSLA My 2nd presentation on youtube (on Dec 11) when i shorted TSLA at about $360 - the momentum model suggests optimal buy point for TSLA will be March 2020. Thus they have the highest opportunity to go bankrupt into March 2020. If they survive this next 12-15 months then it will be time to buy... momentum trends to 2020... a long time away.


Update to Cardano 60% off saleThis is just an "Attempt" to predict future price movement. I see a buy in today and a sell in X days or something for let's say a 60% ROI!
X days = ?
Please comments for me.
Thank you.

BTCUSD on Monthly Chart. How much red?On a quick look we can see that the raise of BTC was so high out of BB and way overbought on RSI that it was expected to go down a lot. On monthly chart, BTC just hit the 0.618 fibb level but there is no sign of great support here. A stronger support seems at 0.786 fibb level at around 4300. If BTC drops to that level we might see it raising again in March.

gold still bullish but ?hi all
it looks like that the pair will test 1170's Area at half of march the start rally . rsi on daily and weekly and monthly still strong.
safe trading
1520 maybe on 2018

Connors' Price Action Analysis // EURUSD ShortHi traders.
EURUSD is currently forming a strong short, its very expected to stay short for the next 3 or 7 hours as next week, which can make us profit between 200 pipettes.
I will be updating this chart as time goes by. It'll surely be a good trade. Stay tuned!

EURGBP: butterfly pattern SetupReason to entry:
-butterfly pattern
-in flag/consolidation pattern
-RSI oversold
-pinbar candle
Entry:
-1618 completion
-1272 completion
Exit:
-retest of flag (32.8 retracement)
-breakout the flag will make target even higher
Void if:
-failed pattern
Remember that market always right!
Manage your trade well!

USDJPY: Butterfly Pattern SetupReason to entry:
-Butterfly pattern
-Strong resistant at 1272 completion
-in wedge/consolidation pattern
-harmonic move
-RSI overbought and divergence
Entry:
1272 completion or
1618 completion
Exit:
-38.2 retracement
-618 retracement
-retest of structures
Void if:
failed pattern
Remember that market always right!
Manage your trade well!

Connors' Price Action Analysis // Germans' MoneyHi traders.
EURUSD is currently forming a strong short around the 338, its very expected to stay short for the next 3 or 7 hours, which can make us profit between 200 pips. because thats what I aim for. I care about pips, not profits as most traders do. Its what brings me money in long term.
I will be updating this chart as time goes by. It'll surely be a good trade. Stay tuned!

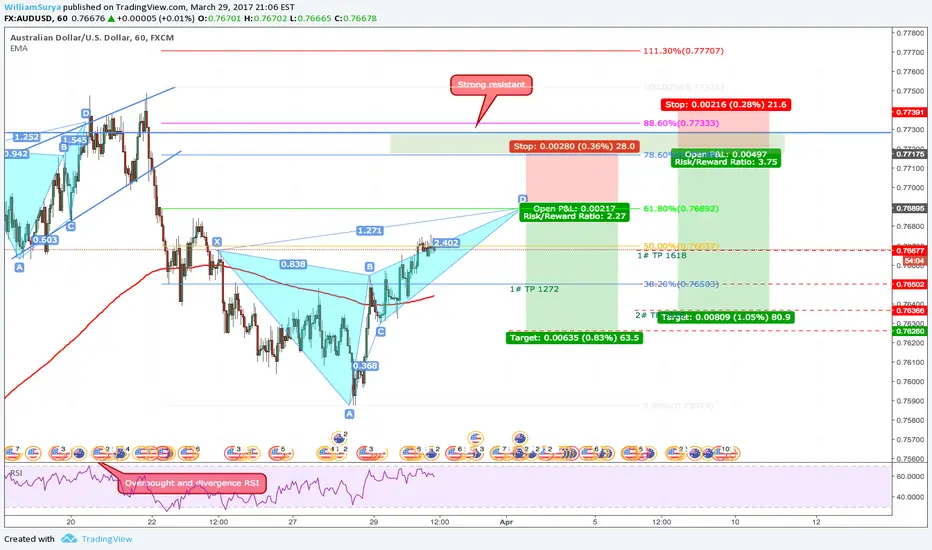
AUDUSD: Butterfly Pattern SetupReason to entry:
-Butterfly pattern (as consolidation)
-Oversold RSI
-Strong structure at ~1618
-Fib Confluence (2) at 2 entries
-wait for candle confirmation
Entry:
1272 butterfly or
1618 butterfly or
at resistant area
Exit:
38.2retracement
61.8retracement
Void if:
Failed pattern
Remember that market always right!
Manage your trade well!
Connors' Price Action Analysis // USDJPY Long #2Hi traders.
USDJPY is currently forming a strong long, its very expected to stay short for the next 3 or 7 hours at the moment, which can make us profit between 200 pips. because thats what I aim for. I care about pips, not profits as most traders do. Its what brings me money in long term.
I will be updating this chart as time goes by. It'll surely be a good trade. Stay tuned!

Connors' Price Action Analysis // EURUSD Short #2Hi traders.
EURUSD is currently forming a strong short, its very expected to stay short for the next 3 or 7 hours, which can make us profit between 200 pips. because thats what I aim for. I care about pips, not profits as most traders do. Its what brings me money in long term.
I will be updating this chart as time goes by. It'll surely be a good trade. Stay tuned!

NZDUSD: Butterfly Pattern as Rebound SetupReason to entry:
-Butterfly pattern
-strong support at 1618 completion (also as descending triangle support trendline)
-previous structure have strong rejection at completion point
-always wait for RSI confirmation
Entry:
1272 butterfly completion.. or
1618 butterfly completion
Exit:
-382 retracement
-618 retracement
Void if:
-failed pattern or premature reversal
-if price breakdown the descending triangle support, reverse position as continuation
Remember that market always right!
Manage your trade well!

EURUSD: Butterfly Pattern SetupReason to entry:
-butterfly pattern
-strong up trendline as support
-Oversold RSI
Entry:
-1272 completion or
-1618 completion
Exit:
-if price action failed and form a consolidation, it's time to exit.
-target at 38.2 and 61.8 retracement of butterfly
Void if:
-failed pattern
Remember that market always right!
Manage your trade well!

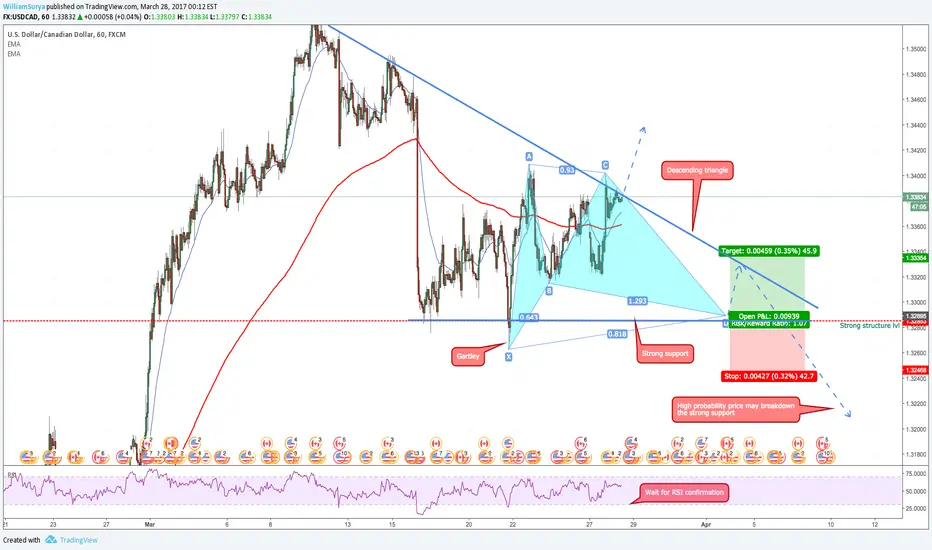
USDCAD: Gartley's Pattern Setup in Descending TriangleThis trade intended just for capitalizing the bounce before breakdown to the downside!
High probability price may break strong support(weak USD and descending triangle as the reason)!
Reason to entry:
-Gartley's pattern
-descending triangle
-strong support at gartley completion
Wait for RSI and candle confirmations
Entry:
-Gartley's completion
-triangle breakdown to downside
Exit:
-retest of triangle resistant (gartley's) or 38.2% retracement
-after that, price may goes down and breakdown from triangle (high probability sell setup)
Void if:
-price goes up before touched gartley's completion
-failed gartley's
Remember that market always right!
Manage your trade well!