CRYPTO TOTAL MARKET CAP EXCLUDE BTC into January 2023CRYPTO TOTAL MARKET CAP EXCLUDE BTC into January 2023. This of course with BTC hitting projected $250k or more. If we see a super cycle Bitcoin price of $533,000 then there would be no reason why the total Altcoin market cap can't be over $2 Trillion.
Market-cap

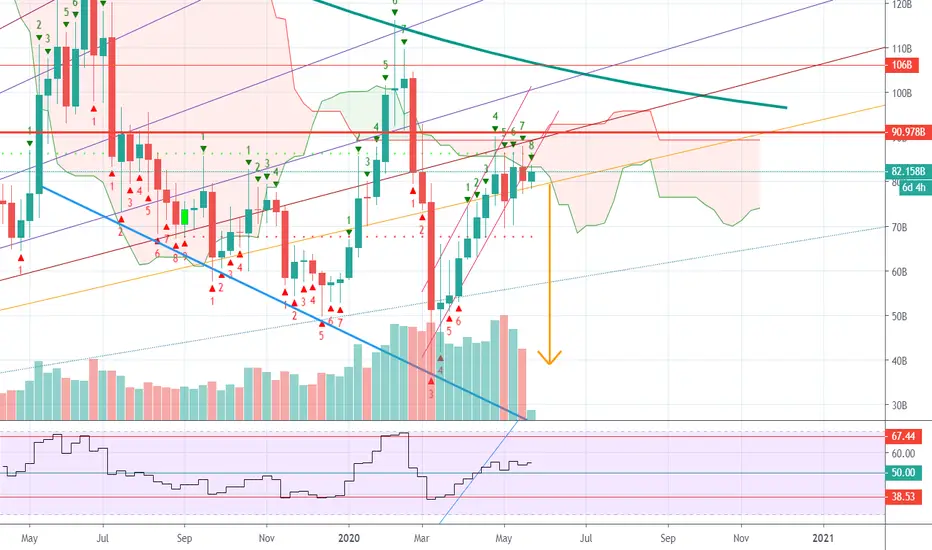
GDLC is getting hammeredGDLC is getting hammered
but
this might be the bottom of the trend.
I t could drop further and if it does i will buy it up -

Grayscales 'index fund of crypto" GDLC moving down to .618 Grayscales 'index fund of crypto"
GDLC moving down to .618 target
this will fall down until :
1. The end the month
2. After Jackson Hole talk
3. maybe even labor day.
I am buying from$19 down to $10 if t gets that low - just not sure when this turn around exactly but it will not stay this low for long.
I am a painter and these are my pictures- not investing advice

Total Market.cap ready to go UP!!!Interesting RSI going down but OBV consolidation and holding it support!!!

Total2, 2 more weeks of sideway action then dumpNext week TD count will print a 9.Price broke out of rising channel. Candles are being squeezed between support and the ichimoku cloud. So, in two weeks we should see a drop in Total2.
ETH market cap steadily fallingReached the resistance of downward channel and the weekly ichimoku cloud.

Total2 market cap looks ready to tankregistered 9 on the TD count and RSI dropped below slanted support. Still can go up to 85 billion to make a bearish divergence, so wait for the breakout of the channel. Ichi twist tempting price to fall through it.
Alts market cap dumping is synergistic with BTC dominance rising.

Crypto Market Cap on the rise with upcoming Golden CrossTotal Market cap of all crypto is 270 Billion as Im looking at the chart on 2/6/20. We surpassed the previous resistance of 250 Billion on January 28th...and now our next resistance is at 300 Billion...but we are also forming a golden cross and looking back at history, when the previous golden cross occurred April 19th 2019 we went on a 130% upward tare in market cap from approximately 160 Billion to around 388 Billion....Bitcoin went from approximately 5200 to 13800 per coin during that time. It looks like a new golden cross is forming....could we make a similar jump upwards? I think we could, so many things are aligning. Upcoming halving + golden cross = huge potential
For you that don't understand what "golden Cross" means here is a quick explanation:
"In the trading world, a Golden Cross occurs when the 50 day moving average rises above its 200 day average. This is typically a telltale sign of bullish sentiment for a stock, reinforced by high trading volumes. Technical traders will often buy stocks in the moments following a Golden Cross and sell when the trend reverses into a Death Cross."
Remember trading is a risky businesses. Protect your capital at all times! It is a probability game, no amount if technical analysis make price movements a guarantee. Pick your spots, place your stop loss. Good luck!

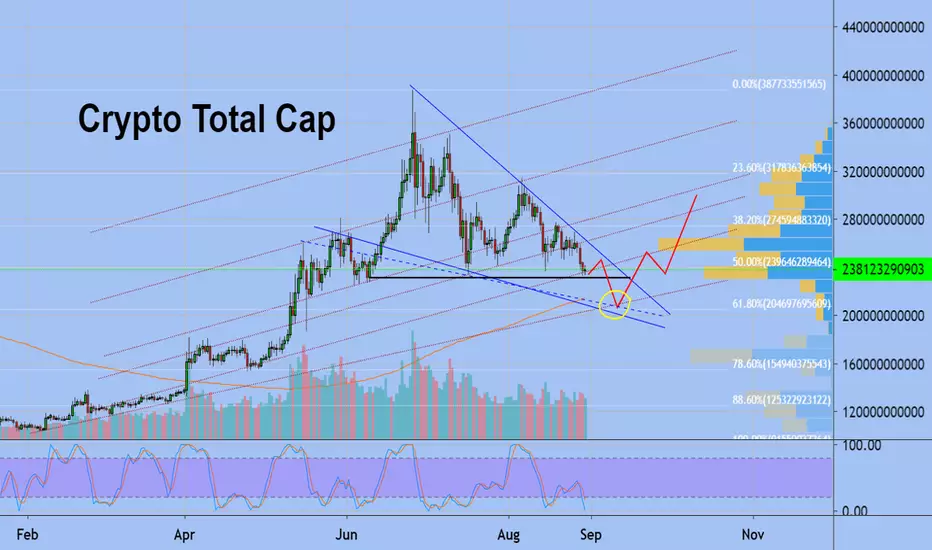
(Crypto Market Cap) Falling Wedge Breakout with High VolumeHey all, I haven't done an idea in a while so I figured I would publish this one. Check out the falling wedge on the total crypto market cap... Such a clear breakout on huge volume. I can't wait to see what's going to happen. This is an amazing bull opportunity I think.
If you don't know about wedges look up falling wedge, it's a bullish formation. Plus we had record volume on the breakout of the wedge.. If that wasn't enough, we dropped almost exactly 61.8% of the previous rally before doing this. Super bullish! We have already pushed up above the 50% fib (223B), seeing resistance at the 61.8% fib (254B). If we break above that level I think it's all systems go to 350B, maybe even 500B.
Of course, the total market cap isn't exactly tradeable and doesn't necessarily follow the same rules as a market that is tradeable.. But if you ask me, technical analysis is still very relevant.
That's all for now, please consider sharing if you got value out of this analysis. And don't forget to leave a thumbs up and follow.
I do technical analysis as a hobby. I like to learn more about markets and share my ideas with other people. But when it comes to real trading, I have algorithms to watch the markets for me 24/7. If you want more info, see my signature.
Cheers!

XRP don't be fooled, it will dump.Three exponential decays in money supply preceded by pumps in all of its history. And the peaks are also exponentially decaying. It is like radio active waste that gets recharged by fiendish wall street algo bots. If tradingview had curve fitting functions we can get a more precise picture of timing, peaks and bottoms.
I am just posting this, because of all the excitement around XRP at the moment. Total2 alt cap is rising, yes, because it is in a bear flag. It will drop soon, and XRP will go down with all the cryptos, including BTC, Because BTC market cap is also dropping. Investors are moving money out of cryptos.
No moon or Alts season, before we see the money comeback and re-accumulation patterns.
Just my 2 cents. In fact i currently hold $20 of XRP. maybe I should sell them and buy myself lunch.

Crypto Total Market CapWe moving in up trend channel with support level at 200 bln
We are near the level of support that we are likely to break down. And again, the exchanges will earn on the
liquidation of large orders, which will cause a snowball. liquidation by a market order - and touch other orders are liquidated. And the panic sale will return to the market. Usually after such sales and large liquidations, the market turns around. I think this is the scenario that will be implemented
But what will we be in 2 months?
A new big telegram player with the TON project, its founder Pavel Durov, and a huge telegram community will come to the market.
I think that this coin will be in the top 5 by capitalization in a year.
And this announcement will be a new impetus for the entire crypto community.
In addition, I see that two exchanges are starting from bitcoin.com and blockchain.com
Draw conclusions
Best regards
Your EXCAVator;)
Crucial pivot point : Altcoins are in trouble if no higher highComparison of a same bubble structure between the Silver bubble and the total market cap of crypto (exl. Btc)
If alts don't produce a higher high around here, then new lows are to be expected, with a slow and long decling of several years.
Of course maybe a few alt coins will probably survive this pattern and will show a more bullish pattern than shitcoins and other alt coins, but this is a very important warning, as this bubble structure is so far 100% identical.
Humans reproduce the same patterns on charts as our behaviour and nature does not change, and will never change.
I am absolutely not against Alts beeing destroyed, as a large majority of them is a cancer to this space, and the crash of the majority of alts would educate the market in the way of driving dumb speculators into bitcoin maximalists, which is not worse.
A little zoom in shows the Smma totally blocked the upmove of the altcoins market cap :
Daily shows a golden cross, but the moving averages are already pointing to the downside, so i don't exclude a bearish cross to happen.
Last note about the Silver chart that produced the exact same bottoming pattern as the Bitcoin chart of 2015:


TotalMarketCap Analysis - Xcluded BTC .. Insane signals?Hello i want to share my view on the TMC chart.
First of all, keep in mind. That this is the chart for the TOTAL MARKET CAP, without BITCOIN included.
Look at the first break on the 50MA, MarketCap went litteraly crazy!
We are close to break the next 50MA, but we got huge resistance here.
If total MarketCap, surpasses the 50MA, bitcoin will go very bullish.
Thank you!

Total Market Cap: ObservationsStarted paying attention to the total market cap in the beginning of the month, to see if it could give any insight into the moves of the coins before they happened. For the most part, it does not give any great insight ahead of time, rather it displays how the entire market moves as a whole. I noted the bitcoin fall from 6k in a yellow text box, as that took place around November 15th 2018, and is highlighted by a dramatic fall on this chart.
Right now, The total market cap is sitting on support around $115 billion, shown in a blue line, and this support is looking weak as it was invalidated the other day, but has bounced since. There was since an ascending triangle that broke down, marked in the purple line, and overall the general structure down here is bearish. Support below this is around the $100 billion meme market cap, which I think eventually we will go below at some point throughout 2019.

SPX Looking WeakSo upon looking at several factors I believe the price of stocks are fully priced atm, and that 2900 was the top for the SPX, I believe the bottom will be around 1580 or 1800 and will take about a year for us to reach the bottom, so by the year 2020 we will see bullish momentum again and that is when I will be looking to enter stocks again. Right now in my opinion the best asset to hold is bitcoin and gold,
Reason for 2900 being the top,
1. End of 5 wave count based on elliot wave analysis
2. Stocks are overpriced based on Marketcap over GDP
3. Time analysis, we have been in a bull market for 10 years
4. Stocks look similar to the late 1930's

RIPPLE WILL CRASH IN 35 DAYS!This fractal is getting spooky. We are only 15 days in to this mirror image!
In 35 Days i reckon we see blood shed on the market.
$XRP

88Fib = 88% Total market cap = $80Million?? Is it possible?As an investor if crypto myself and more recent analysis for potential entry points on the new bull cycle i had been noticing alot of my analysis targeting the 88 fib retracements. im quite surprised to see the market retrace so far but then again this is volatile crypto. as i was conducting my analysis the thought crossed my mind, what if the total market cap also reduced by 88% from its peak? wouldnt that be approx 80mil? Currently we sitting around 350mil. what would the market look like if total market cap reduced to 80mil? is it possible? does it makes sense to happen? at thus stage it doesnt make sense to me however if across the crypo market coins reduce to 88fib, shouldnt market cap also match? im hoping this doesnt happen bht we should also be aware of the other side of the equation. i mean an 88fib retracement across the board would provide some absolute awesome entries however what would appear like the end of crypto at that stage? Like to know any thoughts on the subject and if any . i am totally bullish across the crypto market hiwever im also looking at the current cycle unbiased and trying to see where/how far this bear cycle extremes can really go to.
