Market Direction using SPY historical trend patternsFrom a technical perspective, there hasn't been a definitive signal indicating a trend reversal for the SPY 500. Back in May to October 2023, the SPY exhibited a clear "M" pattern or double top, experiencing a drop of approximately 5%, retracing back, and then dropping around 10%, forming the M pattern.
If we compare this M pattern with the current price action, we observe a striking resemblance in the market behavior, as the price retraces from a similar percentage drop of around 5%. The question arises: Is the market genuinely recovering, or are we merely witnessing the formation of another M-shaped pattern!
Market

Monthly BTC chart I analyzed a lot of fractals and came to the conclusion that you see on the chart now, that the next month - May as well as April will be red for bitcoin, and only after that growth is possible. Be objective bitcoin has been growing for 7 months, now the first month will be red, and most likely the next month will also be red.
It may be hard for altcoins, but keep your bags tight if you have good entry points.
Keep researching the market, there are many promising projects and directions AI, RWA, DePin, GameFi, DEX Derivatives, Social, and others
When the market is red, it's time to learn
All the trades I show in my portfolio are updated using the API
We are 16 months away from the end of the bull market
If the post gets 100 likes I will post a more detailed chart of the current correction
Best regards EXCAVO
√√√√∑çç√√ç√ç≈√√√ç√∫˜˜∆˙˙˙©©∆˙©∂ƒ∆©∆˙ƒ©˙ƒ˙ƒ©ƒ∆¥†ƒ˙´†¥¨ˆˆ∆∆∆˚˜µ∫∫∫˙ƒ©åßß∂ƒ©˙∆˚∆˚¬¬…≥≤≤µµ˜˜∫∫√√ççç≈≈

✏️ Weekly Report: Weak Bounce & Weak $META MARKET OVERVIEW
A weak bounce in the market this week, which lifted stocks modestly off their lows though most stocks are struggling to recover a significant portion of their recent losses.
Tonight, Meta Platforms ( NASDAQ:META ) is adding more downside pressure on growth stocks after it announced weak guidance numbers and the stock collapsed $75 lower in afterhours trading.
Let’s start the charts with Nasdaq-100 above (QQQ)
––––––––––––––––––––––––––––––––––––––––––––––––––––
NASDAQ:META
NASDAQ:SMTC
Constructive pattern. Closed just above the $33 buy point, however I would like to see more volume pick up from here.
NASDAQ:MSFT
The stock needs strong earnings today to get past $431 would be a place to open a position. However, slicing through the support level at $395 is a sell short point for aggressive traders
GOOGL
Massive weekly Cup with Handle base. Earnings are coming today. Technical buy place is $160.25 if earnings are good and we have good volume.
NASDAQ:KLAC
This company reports earnings tomorrow. A move above the $687 is a buy point. However, weak earnings below $680 is a logical short.
NASDAQ:NVDA
Bounced to the 50D SMA (red) and turned down. Aggressive play for the intraday traders is a move over the $880 on a strong volume.
NYSE:GS
GS is just a little bit extended over the proper buy point. If the market starts rallying this could be a good short trade. I would be extra tight with stops here (around $414 level) if I was to play this.
BINANCE:BTCUSD
Bitcoin is performing a tight pivot. Over the blue line is a technical buy point (if we have good volume too)

NASDAQ, expect a top to be built at 18kHello everyone,
I've been watching NASDAQ closely as I expect to end an elliot wave count around the 18k area.
If the level will be reached soon the chance for a correctional move is high, where we could anticipate in.
To make it short, the psychological level of 18.000 will be very interesting, but there is also the channel trendline above, that should form strong resistance. I usually work with several positions, the cyan tringle area will be used for shorting.
I will keep you updated about further actions.

Gold Shows Sell Signals Amidst DowntrendStay informed with our latest analysis of the XAUUSD market! Gold prices are currently trading around $2400, exhibiting a downtrend with sell signals. Recent price action has breached key support levels, with technical indicators like moving averages and RSI indicating selling pressure. Explore potential trading opportunities with our detailed analysis now!

MANTAUSDTi using market ST so we have ascending ch we think market can move the downside until 90R let us see the result

SPY MARKET CRASH! 250 PRICE TARGET? I hope you guys enjoyed the video! Feel free to comment down below if you have any questions!

🗓️Weekly Report: Probabilities are stacking to the lowGENERAL MARKET REVIEW
The stock market kicked off the day on a high note, with stocks initially experiencing gaps upwards and a brief period of appreciation. Nonetheless, these early gains were short-lived, as the market faced significant downturns for the remainder of the session.
In today's trading, both the S&P-500 and Nasdaq indices have fallen through their 50-day moving average markers amid substantial trading volumes, signaling a bearish outlook. This further reinforces the notion that holding cash remains the superior strategy.
We'll begin our chart analysis with a look at the Nasdaq-100 ( NASDAQ:QQQ ) and S&P-500 ( SP:SPX )
SPX-500
––––––––––––––––––––––––––––––––––––––––––––––––––––––––––––
META
Sliced today and looks like it is heading to the 50D SMA. Could see a bounce but it is very much market dependent
––––––––––––––––––––––––––––––––––––––––––––––––––––––––––––
NVDA
Carving out a nice base with earnings coming on 22APR (Wednesday). The next buy point is above the $974 level on high volume, however I will look to play a pivot breakout before hand near the danger point, so that I would look to hold into earnings (IF I GET CUSHION)
––––––––––––––––––––––––––––––––––––––––––––––––––––––––––––
SMTC
Down just fractionally today. It is setting a Bull Flag Pattern. If it breaks the lower side of the channel I d cut it loose.

04/14/2024 - Weekly Watchlist - Video IdeaWeekly Watchlist video idea by @NoFomoCharts
04/14/2024, 08:30PM EST Video Idea.
Technical Analysis & Educational Chart Videos.
Follow, Comment, Boost, or Cheer to support. Thank you!
All content is Not financial advice.

Nifty Short, Medium & Long Term View- 15-Apr-24 to 19-Apr-24Nifty Short, Medium & Long Term View- 15-Apr-24 to 19-Apr-24
Nifty closed at 22519 (22513) and touched low & high of 22435 & 22782
Nifty touched new high last week and reduced 1 % due to global cues on last day.
Global tension caused mild drop in last working day of market. Depends the situation market will react next week. Expecting a mild fall till 22000 and may raise afterwards.
RSI and stochastics levels was marginally down last week(57% & 71% Respectively).
Refer to detailed comments in the bottom on market and election outcome.
Nifty IT 35018(35250) - Nifty IT marginally decreased last three weeks. To continue hold and buy on dips. Nifty IT touched 20 days before new high (38550) and started falling. Major support at 34918 /34000. Can add more at 33288 with Target 40000.
Nifty bank 48565 (48535) - As expected Nifty Bank increased in the last month gaining near to 6.5%. Nifty touched the near time target provided at 48618 & touched new high of 49063.
Medium term support is at 44598 if breaks major support at 43650 ( Fib Support). To continue buy on dips.
Nifty 22519- Short & medium term (Neutral)
Nifty moved up in the last week touched new high 22782. As mentioned in the past month, nifty almost reached the near term target 22819 (Fibonacci extended resistance ( target) iwhich is the % of difference between Oct21 Peak -Jun22 Low from Oct 21 peak/23000.
Short term support 22000/21900
Medium term Support - 21721 (Mar Low),21554 (Fib Support),21300, 20877 Fib Support as shown in the chart.
Long Term
Market expected range bound between 23300 ( Trend Line Resistance till May 2024) to 20225 / 20000 ( Fib Resistance),19500 expected in 2024.
Q3 results are average except bank & Nbfc stocks, further up move will have target of 23150 ( Trend Line), 23500 ( Fib Resistance). Market Awaiting for the Q4 results to take a cue.
Comments :
Positive Lok Sabha Election result expectation, Global trend helped sustaining the market above 22000.
Recent Electoral bonds, CAA implementation news couldnt make the market down as market is confident that current govt will win more than halfway mark, continue govt post election without any additional support of other parties so that govt can be confident enough to take decisions.
Hence market is in good buy whenever there is a dip. Post Elections, only way Market will start grow higher by reduction of interest rate by RBI on a staggered manner till it reaches 5%. US fed rate reduction also expected from Jun/ Sep 2024. Market may correct if any global news till 19500 as there is strong multiple fib support in this range.
Earlier last 2-3 months, purchasing/holding Nifty IT at lower levels proved effective as the Nifty IT index as it moved up by 20%. Nifty IT posted flat or negative results in Q3. Nifty IT touched new high on 16-Feb-24 (38477). Target 40000.
Similarly despite nifty bank results for Q3 were good as expected, Nifty Bank index was down by 10% last three-Four weeks. Nifty Bank Index was suggested to buy two weeks before. Nifty Bank in nearing the target provided (48600). Nifty Bank Stocks / Bank Index can be purchased whenever it falls down. HDFC bank is now in buyable range, can be further bought if it further dips for Medium to Long Term. Continue to buy on dips.
As expected, stocks other than Banks have posted mixed results. Market can any time expected to turn volatile till elections in 2024 (Apr-May). Company Earning per share (EPS) are near to maximum level, expected policy / budgetary push to move up further in 2024. Individual stock pick will be the key in 2024.

HOOD EARNINGS CHART, THE LITTLE FEATHER THAT COULDHood potential earnings chart.
I labeled the important stuff within the chart.
There is a big trend line that I don't think will hit because it takes price down to $3, which I guess is theoretically possible.
I think 8.45 is a more real price and if that price hits, it seems the price can get up to $13.
It can also go the other way, upside first to $13.
I drew a small guideline for a potential path, but there are many, focus on the price targets and trends.
And again, 8.45 is a really strong price support target.
Good luck.

Bearish Movement expected. Dont be the Liquidity! pt4Look to all this Negative Delta. We are on Daily TF. BTC will fall and I strongly suggest that you protect your capital.
When media is fully bullish, and everybody is talking about BTC going to the moon and the bullish effect of Halving.. thats the moment when MMakers will rekt almost everybody.
Remember this wise phrase: buy with the rumor and sell with the new.
Even if we see a bullish manipulation to the upside, everything is pointing to lower prices.
Below actual price there is a lot of available Liquidity and it needs to be recapitalized.
Bearish signs are present since days ago. This is my 4th Update trying to warn people.
Be careful.

GOOGL - After every Storm, there is a Rainbow 🌈Hello TradingView Family / Fellow Traders. This is Richard, also known as theSignalyst.
📈 GOOGL has been overall bullish, trading within the rising rainbow wedge pattern.
Currently, GOOGL is in a storm 🌪/ correction phase and it is approaching the lower bound of the wedge acting as a non-horizontal support.
Moreover, it is retesting a strong support zone at $128 marked in blue.
🏹 Thus, the highlighted blue circle is a strong area to look for buy setups as it is the intersection of the blue support and lower rainbow trendline.
📚 As per my trading style:
As #GOOGL is around the blue circle zone, I will be looking for bullish reversal setups (like a double bottom pattern, trendline break , and so on...)
📚 Always follow your trading plan regarding entry, risk management, and trade management.
Good luck!
All Strategies Are Good; If Managed Properly!
~Rich

EURUSD - Bearish => Bullish 🎯Hello TradingView Family / Fellow Traders. This is Richard, also known as theSignalyst.
📉 As per my last analysis , attached on the chart, EURUSD rejected the upper red circle zone and traded lower.
Currently, EURUSD is approaching the lower bound of the red wedge pattern.
Moreover, the $1.07 is a strong support.
🏹 Thus, the highlighted red circle with the blue arrow is a strong area to look for buy setups as it is the intersection of the blue support and lower red trendline.
📚 As per my trading style:
As #EURUSD approaches the blue circle zone, I will be looking for bullish reversal setups (like a double bottom pattern, trendline break , and so on...)
📚 Always follow your trading plan regarding entry, risk management, and trade management.
Good luck!
All Strategies Are Good; If Managed Properly!
~Rich

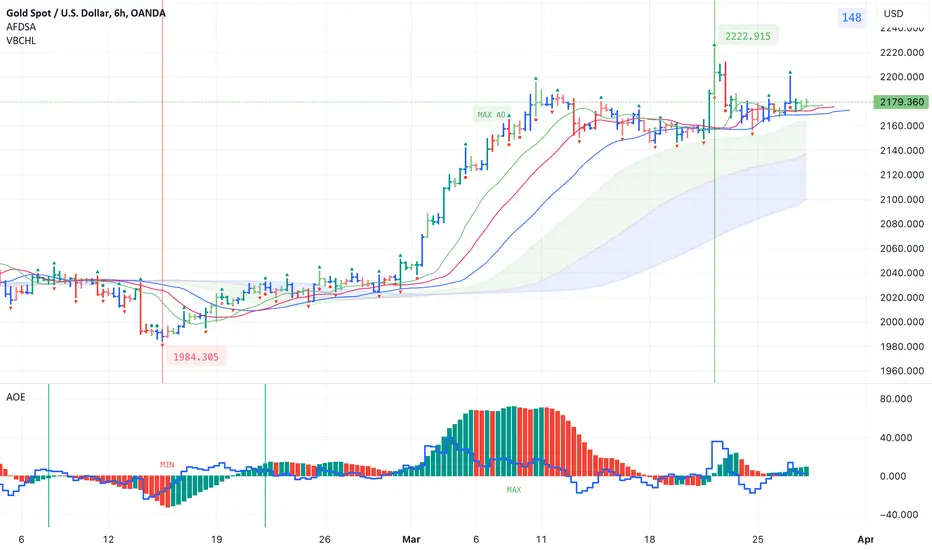
Indicators for trading using Bill Williams' Profitunity strategyI published 3 indicators for trading using Bill Williams' Profitunity strategy. For each indicator, I have added a visual and detailed description in English and Russian. In this post I will briefly describe these indicators and how I use them together.
AFDSA indicator (Alligator + Fractals + Divergent & Squat Bars + Signal Alerts)
Includes Williams Alligator, Williams Fractals, Divergent Bars, Market Facilitation Index, Highest and Lowest Bars, maximum or minimum peak of the Awesome Oscillator, and signal alerts based on Bill Williams' Profitunity strategy:
Bullish and Bearish Divergent Bar Signal + Squat Bar + Green Bar + Fake Bar + Awesome Oscillator Color Change + AO Divergence.
Crossing the green line (Lips) of an open Alligator.
Formation of a fractal.
Signal about the breakdown of the last upper or lower fractal.
Signal about the appearance of a new maximum or minimum peak of AO in the interval of 140 bars from the last bar.
I also added an Alligator display for the higher timeframe, for example, if the chart timeframe is 1 hour, then the higher timeframe will automatically be 4 hours, if the chart timeframe is 4 hours, then the higher timeframe will be 1 day, etc.
AOE Oscillator (Awesome Oscillator + Bars count lines + EMA Line)
Includes the Awesome Oscillator with two vertical lines at a distance of 100 and 140 bars from the last bar to determine the third Elliott wave by the maximum peak of AO in the interval from 100 to 140 bars according to Bill Williams' Profitunity strategy. Additionally, a faster EMA line is displayed.
I also added display of the AO line for the lower timeframe instead of the EMA line if the Moving Average Line values (method, length and source) are equal to the Awesome Oscillator values in the indicator settings. For example, if the chart timeframe is 1 day, then the lower timeframe will automatically be 4 hours, if the chart timeframe is 4 hours, then the lower timeframe will be 1 hour, etc.
VBCHL indicator (Visible bars count on chart + highest/lowest bars, max/min AO)
The indicator displays the number of visible bars on the screen, including the prices of the highest and lowest bars, the maximum or minimum value of the Awesome Oscillator. The values change dynamically when scrolling or changing the scale of the chart, but with a delay of several seconds, so this feature is included in a separate indicator so as not to slow down the work of other indicators.
Indicator settings
In the AFDSA indicator I use the following settings:
By default, the Squat Bar is colored blue, and all other bars are colored to match the Awesome Oscillator color, except for the Fake bars, which are colored with a lighter AO color. But I also enable the display of "Green" Divergent bars in the "Green Bars > Show" field.
I enable the display of Alligator for higher timeframes in the "Alligator for higher timeframe > Enable" field.
In the indicator style settings, I disable the display of the highest and lowest bars, maximum and minimum AO peak labels, because these labels are also displayed by the VBCHL indicator depending on the number of visible bars in the chart window.
Only after opening a position, I enable all additional alerts in the “Enable all additional alerts” field (after changing this field, you need to re-create the alert for the current chart): crossing the green line of an open Alligator, formation of a fractal, appearance of a new maximum or minimum AO peak.
In the settings of the AOE oscillator, I enable the display of the AO line for the lower timeframe instead of the EMA line, setting the same values in the fields for the Moving Average Line (method, length and source) and Awesome Oscillator.
In the VBCHL indicator settings, I only enable the simple display text style for labels in the "Simple display text style for labels" field.
As a result, when analyzing the current chart, I immediately see all the signals on the chart, the location of the bars relative to the Alligator on the higher timeframe and changes in the Awesome Oscillator on the lower timeframe. And thanks to the VBCHL indicator, I quickly select the desired timeframe for analyzing the 5-wave Elliott impulse, focusing on the interval of 140 bars, and immediately see whether there is divergence between the maximum AO peak and the following lower AO peak in this interval.
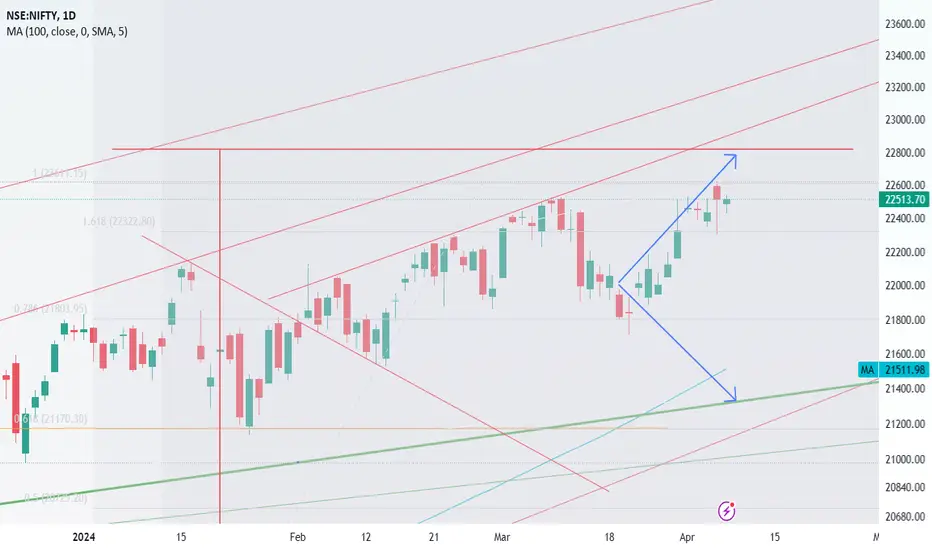
Nifty Short, Medium & Long Term View- 08-Apr-24 to 12-Apr-24Nifty Short, Medium & Long Term View- 08-Apr-24 to 12-Apr-24
Nifty closed at 22513 (22335 ) and touched low & high of 22335 & 22606
Nifty Still undecisive need to cross all time high firmly.
RSI and stochastics levels was up and retaining same position like prev week(61% & 86% Respectively).
Refer to detailed comments in the bottom on market and election outcome.
Nifty IT 35250(35042) - Nifty IT marginally decreased last two weeks. To continue hold and buy on dips. Nifty IT touched 20 days before new high (38550) and started falling. Major support at 34918 /34000. Can add more at 33288 with Target 40000.
Nifty bank 48535 (47118) - As expected Nifty Bank increased in the last 3 weeks gaining near to 5% . It is nearing the initial Target 48618 (All time high).
support is at 44598 if breaks major support at 43650 ( Fib Support). To continue buy on dips.
Nifty 22513- Short & medium term (Neutral)
Nifty moved up in the last week touched new high 22618. As mentioned for the past three weeks, nifty next target 22819 (Fibonacci extended resistance ( target) is near to 22819 which is the % of difference between Oct21 Peak -Jun22 Low from Oct 21 peak/23000.
Short term support 22000/21900
Medium term Support - 21721 (Mar Low),21554 (Fib Support),21300, 20877 Fib Support as shown in the chart.
Long Term
Market expected range bound between 23300 ( Trend Line Resistance till May 2024) to 20225 / 20000 ( Fib Resistance),19500 expected in 2024.
Q3 results are average except bank & Nbfc stocks, further up move will have target of 23150 ( Trend Line), 23500 ( Fib Resistance). Market Awaiting for the Q4 results to take a cue.
Comments :
Positive Lok Sabha Election result expectation, Global trend helped sustaining the market above 22000.
Recent Electoral bonds, CAA implementation news couldnt make the market down as market is confident that current govt will win more than halfway mark, continue govt post election without any additional support of other parties so that govt can be confident enough to take decisions.
Hence market is in good buy whenever there is a dip. Post Elections, only way Market will start grow higher by reduction of interest rate by RBI on a staggered manner till it reaches 5%. US fed rate reduction also expected from Jun/ Sep 2024. Market may correct if any global news till 19500 as there is strong multiple fib support in this range.
Earlier last 2-3 months, purchasing/holding Nifty IT at lower levels proved effective as the Nifty IT index as it moved up by 20%. Nifty IT posted flat or negative results in Q3. Nifty IT touched new high on 16-Feb-24 (38477). Target 40000.
Similarly despite nifty bank results for Q3 were good as expected, Nifty Bank index was down by 10% last three-Four weeks. Nifty Bank Index was suggested to buy two weeks before. Nifty Bank in nearing the target provided (48600). Nifty Bank Stocks / Bank Index can be purchased whenever it falls down. HDFC bank is now in buyable range, can be further bought if it further dips for Medium to Long Term. Continue to buy on dips.
As expected, stocks other than Banks have posted mixed results. Market can any time expected to turn volatile till elections in 2024 (Apr-May). Company Earning per share (EPS) are near to maximum level, expected policy / budgetary push to move up further in 2024. Individual stock pick will be the key in 2024.
old school market structure reading does it still helpwhen i came into trading the basic thing i was taught by many books or rather many online youtube videos is market structure which i still use till this day and its amazing to see the chart everytime using the same structure and it keeps me from being soo focused on the what will happen rather focus on what is happening now

ETH - Wait For The Bears, then The Bulls📉📈Hello TradingView Family / Fellow Traders. This is Richard, also known as theSignalyst.
📈 ETH has been hovering with a range between $3000 and $3500.
📉 After breaking below the last major low at $3500, ETH has been bearish from a short-term perspective trading within the falling red channel.
Moreover, the $3000 - $3100 is a strong support zone.
🏹 Thus, the highlighted red circle is a strong area to look for buy setups as it is the intersection of the green support and lower red trendline.
📚 As per my trading style:
As #ETH approaches the red circle zone, I will be looking for bullish reversal setups (like a double bottom pattern, trendline break , and so on...)
📚 Always follow your trading plan regarding entry, risk management, and trade management.
Good luck!
All Strategies Are Good; If Managed Properly!
~Rich

STOCK MARKET CRASH!Spy has crashed and this is the signal we were looking for! I have been waiting for this trade for almost a year lol watch my last video on the SPY!

Bullish or Bearish...? Multi Time Frame Analysis
Hey guys!
Over the past 2 weeks, we have seen the EURUSD pair go deep down. The beautiful part is that it played out well according to our analysis and prediction. So let's try again.
This time, we see this pair switch like a flipped coin from a long bearish to a steep bullish climb. Will this be the end of the bearishness, and are the Bulls to resume taking prices higher?
Or is this just one of those usual bullish pullbacks within a larger timeframe Bearish swing?
Watch this short Multi Time Frame Analysis to find out.
Please share your thoughts on this pair's price movement. Dont forget to Boost and to share with other traders

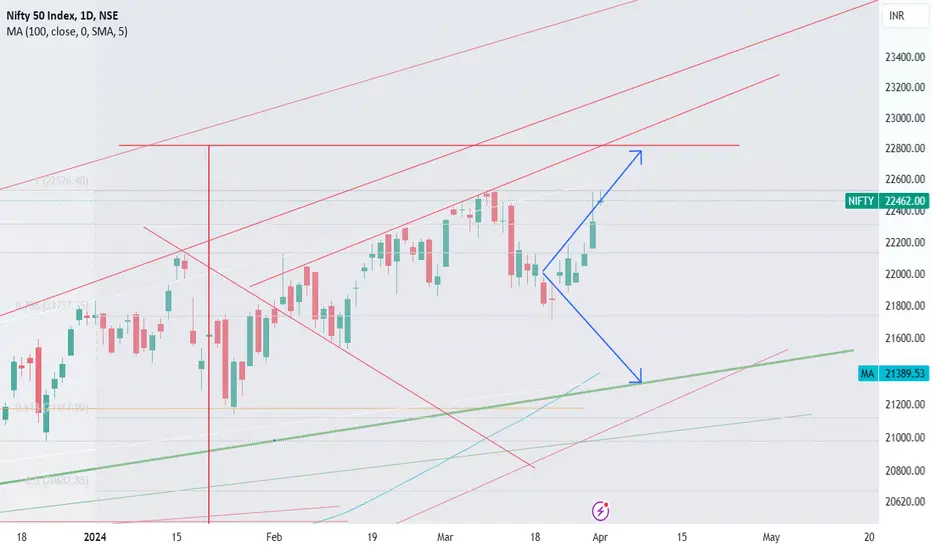
Nifty Short , Medium & Long Term View- 02-Apr-24 to 05-Apr-24Nifty Short, Medium & Long Term View- 02-Apr-24 to 05-Apr-24
Nifty closed at 22462 on 01-Apr-24 (22096 on 22-Mar-24) and touched low & high of 21893 & 22517
RSI and stochastics levels have improved last week (61% & 92% Respectively).
Market was volatile in the month of March and in the end of the month started to increase.
Market touched new high on 01-Apr-24 (22522).
Refer to detailed comments in the bottom on market and election outcome.
Nifty IT 35042 (35188) - Nifty IT marginally decreased. To continue hold and buy on dips. Nifty IT touched 20 days before new high (38550) and started falling. Major support at 34918 /34000. Can add more at 33288 with Target 40000.
Nifty bank 47578 (46863) -To continue buy on dips. As expected Nifty Bank increased in the last 2 weeks. It is nearing the initial Target 48618 (All time high).
support is at 44598 if breaks major support at 43650 ( Fib Support). Purchase on Dips.
Nifty 22462- Short & medium term (Neutral)
Nifty moved up in the last week touched new high 22522. As mentioned for the past three weeks, Fibonacci extended resistance ( target) is near to 22819 which is the % of difference between Oct21 Peak -Jun22 Low from Oct 21 peak. nifty next target 22819 (Fib Resistance)/23000.
Short term Support - 21900, 21721 (Mar Low)
Medium term Support at 21554 (Fib Support),21300, 20877 Fib Support as shown in the chart.20225 (prev high), 20000 ( Fib Resistance)
Long Term
Market expected range bound between 23300 ( Trend Line Resistance till May 2024) to 19500 expected in 2024.
Q3 results are average except bank & Nbfc stocks, further up move will have target of 23150 ( Trend Line), 23500 ( Fib Resistance). Market Awaiting for the Q4 results to take a cue.
Comments :
Positive Lok Sabha Election result expectation, Global trend helped sustaining the market above 22000.
Recent Electoral bonds, CAA implementation news couldnt make the market down as market is confident that current govt will win more than halfway mark, continue govt post election without any additional support of other parties so that govt can be confident enough to take decisions.
Hence market is in good buy whenever there is a dip. Post Elections, only way Market will start grow higher by reduction of interest rate by RBI on a staggered manner till it reaches 5%. US fed rate reduction also expected from Jun/ Sep 2024. Market may correct if any global news till 19500 as there is strong multiple fib support in this range.
Earlier last 2-3 months, purchasing/holding Nifty IT at lower levels proved effective as the Nifty IT index as it moved up by 20%. Nifty IT posted flat or negative results in Q3. Nifty IT touched new high on 16-Feb-24 (38477). Target 40000.
Similarly despite nifty bank results for Q3 were good as expected, Nifty Bank index was down by 10% last three-Four weeks. Nifty Bank Index was suggested to buy two weeks before. Nifty Bank in nearing the target provided (48600). Nifty Bank Stocks / Bank Index can be purchased whenever it falls down. HDFC bank is now in buyable range, can be further bought if it further dips for Medium to Long Term. Continue to buy on dips.
As expected, stocks other than Banks have posted mixed results. Market can any time expected to turn volatile till elections in 2024 (Apr-May). Company Earning per share (EPS) are near to maximum level, expected policy / budgetary push to move up further in 2024. Individual stock pick will be the key in 2024.
The USD/JPY pair rises to its highest levels since 1990The USD/JPY pair rises to its highest levels since 1990
The Japanese yen continued its losses during trading on Wednesday, with the USD/JPY pair falling to its lowest levels since July 1990, that is, in nearly 34 years, with the continued strong upward momentum of the American currency and the failure of the recent shifts in monetary policy at the Bank of Japan to give sufficient support to the yen. Japanese.
The dollar/yen pair rose to the level of 151.975 yen during early trading in the session, which is the highest level recorded by the pair since the beginning of July 1990, after the Governor of the Bank of Japan, Kazuo Ueda, stated that the Bank of Japan will continue to maintain its current accommodative policy as long as necessary. To support economic growth.
But the yen was then able to regain some ground and recovered a bit after Japan's Finance Minister, Shunichi Suzuki, came out with an immediate warning, calling for decisive action by the government, a phrase he last used in late 2022, before the Bank of Japan intervened in the forex market. To buy yen and sell dollars.
Last week, the Bank of Japan raised interest rates for the first time in 17 years, but despite this, the Bank of Japan's tightening is expected to occur very gradually, which has reinforced the yen's losses, especially in light of growing expectations that the Federal Reserve may have to wait. longer before he could cut rates, which gave additional support to the dollar.

GBP/USD Analysis: Support Channel Breaks as Dollar Strengthens,GBP/USD Analysis: Support Channel Breaks as Dollar Strengthens, Retest of Demand Zone Imminent
The GBP/USD pair has experienced a significant shift in momentum as the support channel, marked by the crucial level of 1.28063, has been breached. This breach comes amidst a notable surge in the value of the US dollar, which has exerted downward pressure on the GBP pair.
Moreover, recent data indicates a pronounced strengthening of the dollar against various currencies, including the British pound. This strengthening has intensified the bearish sentiment surrounding the GBP/USD pair.
In light of these developments, market sentiment suggests that the GBP/USD pair is now poised for a retest of the demand zone, situated around the level of 1.25030. This zone represents a critical area of support where buying interest could potentially resurface, leading to a temporary halt or reversal of the downward movement.
Traders and investors are closely monitoring the price action around the demand zone for potential signs of bullish reversal or further downside continuation. Factors such as economic data releases, central bank statements, and geopolitical developments will likely play a crucial role in shaping the near-term trajectory of the GBP/USD pair.
Overall, the breach of the support channel coupled with the prevailing strength of the US dollar indicates a bearish outlook for the GBP/USD pair, with attention now turned towards the retest of the demand zone for potential trading opportunities.

Nifty Short , Medium & Long Term View- 26-Mar-24 to 29-Mar-24Nifty Short , Medium & Long Term View- 26-Mar-24 to 29-Mar-24
Nifty closed at 22096 (22023) and touched low & high of 21710 & 22175
RSI and stochastics levels have improved last week (51% & 47% Respectively).
Market closed almost flat last week
Refer to detailed comments in the bottom on market and election outcome.
Nifty IT 35188 (37517) -To continue hold and buy on dips. Nifty IT touched 20 days before new high (38550) and started falling. Major support at 34918 /34000. Can add more at 33288 with Target 40000.
Nifty bank 46863 (46591) -To continue buy on dips. Nifty Bank last week dipped. initial Target 48618 ( all time high). if it cross this resistance decisively.
support is at 44598 if breaks major support at 43650 ( Fib Support). Purchase on Dips.
Nifty 22096- Short & medium term (Neutral)
Nifty still in undecisive state at present and will be rangebound. As mentioned for the past three weeks, Fibonacci extended resistance ( target) is near to 22819 which is the % of difference between Oct21 Peak -Jun22 Low from Oct 21 peak. nifty next target 22819 (Fib Resistance)/23000.
Short term Support - 21900, 21554 (Fib Support),21300, 20877 Fib Support as shown in the chart.
Medium term Support at 20225 (prev high), 20000 ( Fib Resistance)
Long Term
Market expected range bound between 23000 to 18800 expected in 2024.
Q3 results are average except bank & Nbfc stocks, further up move will have target of 23150 ( Trend Line), 23500 ( Fib Resistance).
Comments :
Positive Lok Sabha Election result expectation, Global trend sustaining the market above 22000.
Recent Electoral bonds, CAA implementation news couldnt make the market down as market is confident that current govt will win more than halfway mark, continue post election without any additional support of other parties so that govt can be confident enough to take decisions. Election outcome analysis i have prepared is available in website in my profile and my X account karthik_ss
Hence market is in good buy whenever there is a dip. Post Elections, only way Market will start grow higher by reduction of interest rate by RBI on a staggered manner till it reaches 5%. US fed rate reduction also expected from Jun 2024. Market may correct if any global news till 19500 as there is strong multiple fib support.
Earlier last 2-3 months, purchasing/holding Nifty IT at lower levels proved effective as the Nifty IT index as it moved up by 20%. Nifty IT posted flat or negative results in Q3. But to a surprise Nifty IT moved up 4-5% up as US economy is recovering. Nifty IT touched new high on 16-Feb-24 (38477). Target 40000.
Similarly despite nifty bank results for Q3 were good as expected, Nifty Bank index was down by 10% last three-Four weeks. Nifty Bank Index was suggested to buy two weeks before. Nifty Bank Stocks / Bank Index can be purchased whenever it falls down. HDFC bank is now in buyable range, can be further bought if it further dips for Medium to Long Term. Nifty Bank ( 46554) tried to move above key resistances. Continue to buy on dips.
As expected, stocks other than Banks have posted mixed results. Market can any time expected to turn volatile till elections in 2024 (Apr-May). Company Earning per share (EPS) are near to maximum level, expected policy / budgetary push to move up further in 2024. Individual stock pick will be the key in 2024.
