GBPJPY, Forming Channel-Pattern, Breakout Determines Direction!Hello Traders Investors And Community, welcome to this analysis where we are looking at GBPJPY 4-hour timeframe perspective, the recent events, the current formation-structure, what to expect from it the next times and how to handle the final scenario in an appropriate manner. GBPJPY has formed a huge exponential uptrend where it recently stopped to go into a longer-lasting consolidation where it is currently forming a decision-pattern which will determine the further outcome, in such a situation it is important to need to know what is possible to happen and how this situation can be handled out of a trading perspective, therefore, I detected some important signals which need to be considered here in order for outcomes in the pair destiny.
Looking at my chart you can watch the huge ascending-symmetrical-channel marked in blue which the pair is building up here with the lower and upper boundary already touched several times and building up a coherent range, such formation can confirm either to the up or downside with the projected target from the low and high of the formation to the proper breakout, as GBPJPY is overbought in the higher timeframes and has some important resistance structures here established the bearish breakout is more likely in this case which will confirm with a break of the lower boundary to the bottom, the bullish one will confirm the channel as a bull-flag but the price will have a hard time to advance because the pair is still trading in overbought conditions.
This structure is the best way to trade with the proper confirmation which is providing a high possibility setup. In the bearish since this will happen with a break of the lower boundary, a bounce of the 50-EMA in orange and a continuation downwards toward the next EMA-steps which will also end up the wave-cycle. The not that much possible bullish scenario will confirm when the pair advances in the channel and above the upper boundary to finally confirm it as support where a trade can be placed. In both cases it is highly important to wait on the proper confirmation before trading in the right direction because the pair is still in an indecisive state currently, therefore, we should not speculate and trade after confirmation occurred.
In this manner, thank you for watching the analysis, support for more market insight and all the best.
"Trading effectively is about accessing possibilities, not certainties."
Information provided is only educational and should not be used to take action in the market.
Market

D-JONES, Important Levels To Consider Next Times!Hello Traders Investors And Community, welcome to this update-analysis where we are looking at the DOW JONES Industry Index 4-hour timeframe perspective, the recent price-action, the current importances in the structure, what to consider next times and how to handle upcoming situations in the right manner. As the overall stock-market is recovering from its corona-breakdowns seen this year there are major indices which already filled important key-levels such as the huge gap in the SPX which I mentioned and now filled properly, the DOW is still below these levels and could possibly follow-up with its gap-fill. In this case I detected some important signals which can make this happen when the DOW moves correctly within its range, but this does not mean the market is comptletely bullish as the bear-market is still not confirmedly over bearish action can increase again as markets approaching solid supply zones.
Looking at my chart you can watch there that the index just moved above its descending-channel-formation and formed this smaller ascending-channel-formation where it also moved above the upper boundary, these factors give an increased bullish pace within here and can indicate continuation to the upside which will be given when the index manages to travel above the last rising resistance of its channel as you can watch it in my chart, it is either possible to form a consolidation before doing this or a immediate breakthrough, a consolidation is more likely within this structure. When this properly plays out the index will look for the gap to be filled which will be crucial as this can be a point where supply enters the market as people taking profit and the price moves to the downside therefore it can also be considered a possible short-zone as you can watch it marked in my chart.
It is highly important to take note that although the index sending some decent bullish signals at the moment it is still not confirmedly bullish not only because there are still remaining strong resistance-levels but also because there is still a huge difference between real economy and stock-market as stock-market is showing gains real economy is in a decline, to provide a healthy unspeculative market environment these two need definitely move together. When the index approaches the higher levels we need to elevate and be prepared for possible bearish signs as this will be crucial level where selling pressure can enter while many retailers rushed into the market to do not pass away the rally smart-money is still not fully in the market and in the sidelines this can be a indication for more bearish pressure assuming over the course of next weeks and months.
In this manner, thank you for watching, support for more market insight and have a good day!
“Forecast is a mixed fortune in todays market environment. ”
Information provided is only educational and should not be used to take action in the markets

HD, This Formation Is The Crucial Factor For Futher Outcomes!Hello Traders Investors And Community, welcome to this analysis where we are looking at the stock value HD 4-hour timeframe perspective, the current formation and what to expect from this stock the next times. Although HD has formed some new highs it is struggling at the moment as the volatility gets extremely low and the price weakens it can be possible to reverse, in such environment it is important to note that there are stocks which gained strongly out of the corona crisis and stocks which showing bearish signals, as HD has shown some bullish signs this can reverse to the other side now therefore I detected some important signs to consider which will determine the further outcomes.
Looking at my chart you can watch there that HD has formed this huge possible rising-triangle-formation which is marked in blue where the price already severaly touched the lower and upper boundary within its low-volatile movement, what is important is this movement as it gets slower and slower here the price struggles to advance, such movement can suddenly reverse which is also playing into the rising-triangle-structure the stock is building up here. This triangle will confirm when the price closes with a volatile move below the lower boundary and therefore confirms the triangle, a continuation to the downside will be highly possible and should be considered when this happens.
When the more likely bearish scenario plays out here the stock will look for remaining supports which is firstly the 100-EMA marked in red which is a possible support that can hold and when it does not the next support will be at the 300-EMA marked in black, in these levels the stock can reverse and possibly continue bullish on the middle or even on the long-term but this has to be confirmed rightly. Although a immediate aggressive approach is also possible here such formation can be traded best possible with a confirmation of the whole triangle-formation with a close below the lower boundary and cotinuation, it will be highly interesting how this is playing out in the current structure.
In this manner, thank you for watching, support for more market insight and have a good day!
“The fundamental law of trading is the forecast of the future.”
Information provided is only educational and should not be used to take action in the markets

SPX500, Major Gap Has Been Filled, What To Consider Now!Hello Traders Investors And Community, welcome to this update-analysis where we are looking at the S&P 500 4-hour timeframe perspective, the recent events, the gap-fill occurred, what to consider now and what are possible outcomes further next times. The major gap which the index formed in the corona-breakdowns seen this year has been filled now properly as expected therefore it is important currently how the index develops further and if there can come a possible continuation or fall back to lower levels, overall it is important to note that the recovery is not fundamentally backed as the real economy is still damaged by corona and the gains seen are mainly provided by retailers as smart-money is currently still staying out of the market, such perspectives can lead to a speculative market environment which does not mean it can convert to a healthy bullish environment but it means that rallies and new highs should be seen crucial, in this case I detected some important signals meaningful for the next outcomes of the index.
Looking at my chart you can watch there that the index just confirmed recently the gap-fill and now it is possible that supply enters the market firstly providing a correction as such mechanism is seen often after such gap-fills, otherwise it is possible that bulls are strong enough and just move above the gap-fill-level. Currently it is more possible that the index firstly shows a pull-back and consolidation between the higher boundary of the channel and the support/resistance level as seen marked in my chart. Basically there are two possible outcomes given, the first is the bullish breakout scenario with a new high forming which is more likely at the moment as the index has some solid supports as you can watch, the second is that the index firstly visits lower levels to reallocate newly which is the unlikely scenario as the index firstly has to take out the solid support levels before moving on, but as the rally is still not fundamentally backed this scenario should not be ignored at all but when the index holds the support properly it will move on to form this historical new high which will be worthwile and will tell if its just a huge bull-trap or solid rally.
The current situation is a situation where the index has to show if its underlying pace is strong enough to advance in the structure but when considering all this it is important that the real economy also recovers together with the market, till this is not happen all rallies happening are highly speculative and walking into the danger of a possible bearish volatility similarly to those seen this year. When the index takes out the previous high and forms another one it is from high importance to do this sustainable because when it does not and the area is just visit a short time to go back into the established range this can be a fake breakout leading to downside ahead. It will be highly interesting how this is playing out and if the index has the ability to take out the highs substantially. The next times will show how the more likely scenario is playing out and if this can also be backed of a solid real economy which is growing together with the market because this is what is needed till then the market is still in a unconfirmed status and can reverse to the bearish side back again which can be sudden and heavier than before.
In this manner, thank you for watching, support for more market insight and have a good day!
"There are many roads to prosperity, but one must be taken."
Information provided is only educational and should not be used to take action in the markets

GBPUSD, Enormous Wedge-Formation, Looking For Stabilization!Hello Traders Investors And Community, welcome to this analysis where we are looking at GBPUSD weekly timeframe perspective, the massive formation it is building up there, what we can expect from it and what it needs to fulfill for a proper confirmation of this huge formation. The last months and weeks GBPUSD was in a steady but week downtrend with several lower lows and lower highs forming on the wedge and an important wave-count forming. Such formation will normally breakout with high volatile movements to the upside but the big question is now when this breakout occurrs and if the bottom already reached or if there is more to come before a stabilization can be considered, in this case, I detected some important and crucial signals which will determine the further outcome of this pair.
As you can watch when looking at my chart is that GBPUSD just testing another time the strong 200-EMA resistance which is marked in black, furthermore this level coherently forms resistance together with the higher boundary of the wedge-formation where GBPUSD several times formed bearish movements to the downside, therefore there is a high potential given that GBPUSD forms another time bearish moves to the downside as this is still a solid resistance-cluster which should not be ignored in the structure. When the pair falls below the 30-EMA which is marked in red it will confirm the last leg to the downside till it reaches crucial support and possible bottom in the back-up-zone you can watch marked in my chart.
Taking all these factors into consideration GBPUSD will continue with its steady but weak downtrend till there is a decisive bottom forming which is strong enough to move with a volatile move above the upper boundary and therefore finally confirm the huge broadening wedge formation it is trading in, when this happens it will greatly confirm further upside also in the middle and long-term but this needs definitely a strong break of the upper boundary and possible following confirmation of it. The next time will show how this scenario is playing out and when there is a breakout of the long-lasting downward movement GBPUSD is forming here till then the middle-to-long-term remains to confirm the final wave.
In this manner, thank you for watching, support for more market insight and have a good day!
There are many roads to prosperity, but one must be taken.
Information provided is only educational and should not be used to take action in the markets

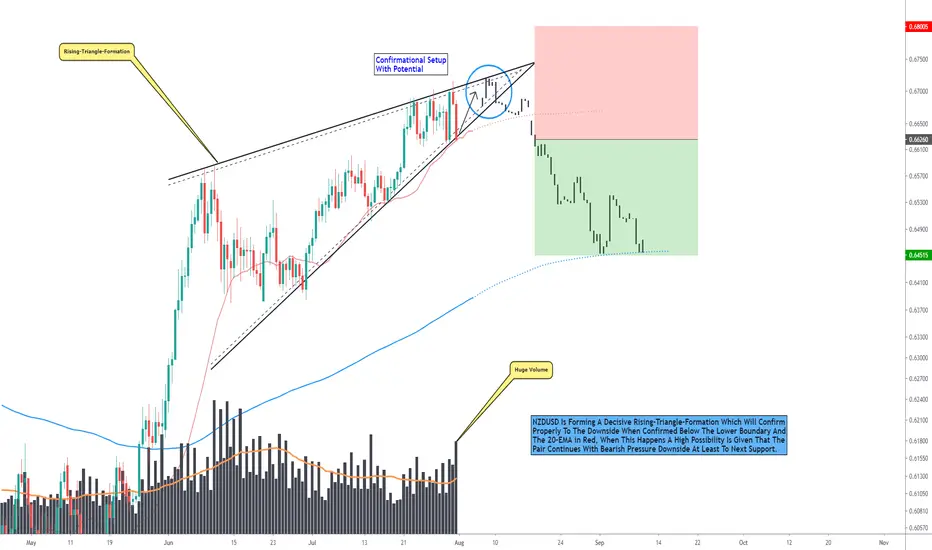
NZDUSD, Huge Triangle-Formation Which Can Show Up Proper Setup!Hello Traders Investors And Community, welcome to this analysis where we are looking at NZDUSD 12-hour timeframe perspective, the recent events, the current formation forming, what to expect the next times and possible confirmational scenario. NZDUSD move in a protracted uptrend which is currently showing weakening signs where it is also approaching resistance in higher timeframes and forming bearish reversal signs, in this case, I detected some important signals in consideration if NZDUSD forms a solid reversal or continues with its established but weakening uptrend where a bearish breakout can be definitely in consideration if NZDUSD also confirms this rightful in the schedule.
Looking at my chart you can watch that NZDUSD is trading in this huge possible rising-triangle-formation marked with the grey rising trendlines where it consolidates to the top of this formation which currently gets narrower and narrower. Furthermore, the 20-EMA you can watch marked in red holding this structure still to the upside which is building together with the lower boundary of the formation coherent support which when broken to the downside confirms the overall rising-triangle-formation and shows a decent set up like you can watch it marked in my chart. When this scenario plays out there is a high possibility given that NZDUSD continues bearish to the downside until the next remaining support locks up.
Such formation can be traded in two ways, once it is an aggressive immediate entry in the triangle formation and secondly it is the conservative approach waiting till the formation has finally confirmed. Although the immediate approach is also possible here the conservative will be smarter as the confirmation provides a high possibility setup. Currently, it is possible that NZDUSD invalidates the triangle formation and breaks to the upside but this possibility is very very marginal therefore the bearish scenario is what should be more considered here. When this plays out it will be highly interesting what NZDUSD will do at remaining lower support in the structure which is firstly the blue 200-EMA marked in my chart.
In this manner, thank you for watching, support for more market insight and have a good day!
Comfort and prosperity have never enriched the world as much as adversity has.
Information provided is only educational and should not be used to take action in the markets.
RUSSELL 2000, Trading Above Keylevel With Continuation Possible!Hello Traders Investors And Community, welcome to this analysis about one of the major stock market indices RUSSELL 2000, its 4-hour timeframe perspective, the recent price-action, the current formation and what to expect from the index the next times. Similarly to other preliminary indices the RUSSELL 2000 has recovered from its heavy corona breakdown seen this year but this does not mean the bear-market is overall over, in this case, all the main stock market indices begin to struggle with their uptrend growth and either consolidating or already building up downside potential, therefore, it is important to look at the facts and realistically measure what is possible in the next times and what is unlikely to do not get overwhelmed when things move into the reverse perspective, therefore I detected some important signals which will determine the further outcomes of this index.
When looking at my chart now you can watch there that the index formed a symmetrical triangle below the meaningful falling resistance marked in blue which formed by the all-time-high and the tops formed in last price-actions. This triangle has successfully confirmed to the upside and the index managed to closer above the important falling resistance line where it consolidates currently as you can watch it marked in my chart, this consolidation and breakout occurred are two decent bullish signals playing to the possibility that the index can continue with bullish rising to the upside when there do not come any bearish signs which invalidate this scenario again. Furthermore, the trading above the 60-EMA marked in cyan in my chart is supporting this scenario which will be confirmed properly when the index manages to break out of the consolidation and move on as it is shown in my chart.
Taking all these factors into consideration the index currently provides a more bullish than bearish outlook on the short-term, this is really important to note that the index has some potential in the short-term but it will run inevitably into resistance levels higher in the structure, this means a bearish reversal is not totally out of the sight as the uptrend begins to struggle and slowly don't this should not be kept by side. Also, the real economic situation is still providing a big divergence to the stock-market where real economy is damaged by corona and the stock market making almost exceptional growth to the upside where retail moves into the market while smart-money stays out of it this isn't a healthy environment where both factors real economy and stock-market growing together and therefore should not be ignored considering the next months and outcomes where the speculative rallies can reverse and lead to a shaky downside environment.
In this manner, thank you for watching, support for more market insight, have a great day, and all the best to you!
Information provided is only educational and should not be used to take action in the markets.

EURUSD, Breakout And Rising But The Perspective Can Reverse!Hello Traders Investors And Community, welcome to this update-analysis about the EURUSD where we are looking at the weekly timeframe perspective, the overall breakout and rising dynamic, the importance of further price-action, where the price can lead and what to take note of in order to take appropriate action. EURUSD has formed a huge bullish rising to the upside since it broke above the preliminary broadening wedge and confirmed it bullishness not only on the smaller timeframes but also on the higher timeframes as it is clearly seen on the weekly timeframe. Now I found some interesting and worthwhile signals which can lead to a reversal and possibility on the short-side as the market approaches important levels these will determine the outcomes.
As you can watch when looking at my chart is that EURUSD just made this exponential growth since the broadening wedge confirmed appropriate, now it is moving on and firstly shows no reversal signs but when looking more inside there are important levels of resistance above between the 1.185 and 1.2 level established not only from older price-action but also the 600-EMA you can watch in my chart marked in black, these levels building up a huge resistance-cluster you can watch marked in red in the chart, furthermore the market is extremely overbought which is just supporting this cluster and the possibility to confirm it bearish and therefore show bearish pressure to the downside, which will be realized when EURUSD does not manage to move above the huge resistance-cluster.
When the more possible scenario is playing out accordingly EURUSD has the potential to back-up in the zone you can watch marked in my chart which will also confirm the broadening-wedge-formation a second time. The possible established bearishness will not mean that EURUSD will go on forever bearish but it does mean that there is waiting for a pull-back when not a bigger correction in front where EURUSD has to show if it has the strength to back-up or falls more. The immediate bullish scenario is possible currently but it is definitely not high therefore the bearish scenario and possibility on the short-side should be preferred here which can be traded either conservative with a break of the grey trendline or aggressive with an immediate entry in the bearish-cluster, traders should decide according to own risk-preference.
In this manner, thank you for watching, support for more market insight, have a great day, and all the best to you!
There are many roads to prosperity, but one must be taken.
Information provided is only educational and should not be used to take action in the markets.

PFE, Huge Triangle-Formation With Possible Breakout Ahead!Hello Traders Investors And Community, welcome to this analysis where we are looking at the 4-hour timeframe perspective of stock value PFIZER, the recent events, the current formation structure, what needs to be fulfilled that the stock confirms properly and what are possible trading opportunities when the stock has confirmed. As the main stock-market has recovered from the huge corona-breakdowns seen this year there where stock which gained strength out of the crisis and stocks which just stayed in a bearish state, although the health sector surged in demand because of the health crisis and people wanting to live more sustainable lives PFIZER is still somewhat in a sideways movement where it has to confirm and therefore show the ability that it has the strength to move beyond this sideways correction, therefore, I detected some important and interesting signals which can determine the follow-up destiny.
When looking at my chart you can watch this huge possible ascending-triangle-formation where the stock already confirmed several times the upper and lower boundary, furthermore, it noted several times above the 100- and 400-EMA which you can watch marked in blue and orange in the chart, this is a good sign because on the other side there are stocks which trading below these EMA structures. As the stock is approaching the upper boundary another time now we can expect it to confirm as resistance and therefore move on to test the lower boundary of the triangle-formation another time, when the stock manages to stabilize in this boundary where also a coherent support-cluster lies as you can watch it in my chart the potential is given that the stock goes on to confirm the huge ascending--triangle-formation with a final break above it which will cause the bullish rising and an appointment to higher targets.
For now, it is highly important that the stock holds the substantially lower boundary sustainable and does not fall below it where the possibility is not big currently but it should by no means kept by side easily. Compared to other stocks which already moved above and confirmed new highs this stock has definitely some room to go, the breakout when it happens can be traded the best way with a conservative entry after the upper boundary has confirmed, it is also possible to open up an immediate position but this would be the riskier variety, traders should decide according to individual risk preference, and to secure the proper confirmation it is from high importance that corona increases not heavily again and the real economic situation stabilizes further from the heavy breakdowns because when it does not this can cause bearish rumors in all global markets and therefore possible downside ahead which can invalidate the scenario.
In this manner, thank you for watching, support for more market insight, have a great day, and all the best to you!
There are many roads to prosperity, but one must be taken.
Information provided is only educational and should not be used to take action in the markets.

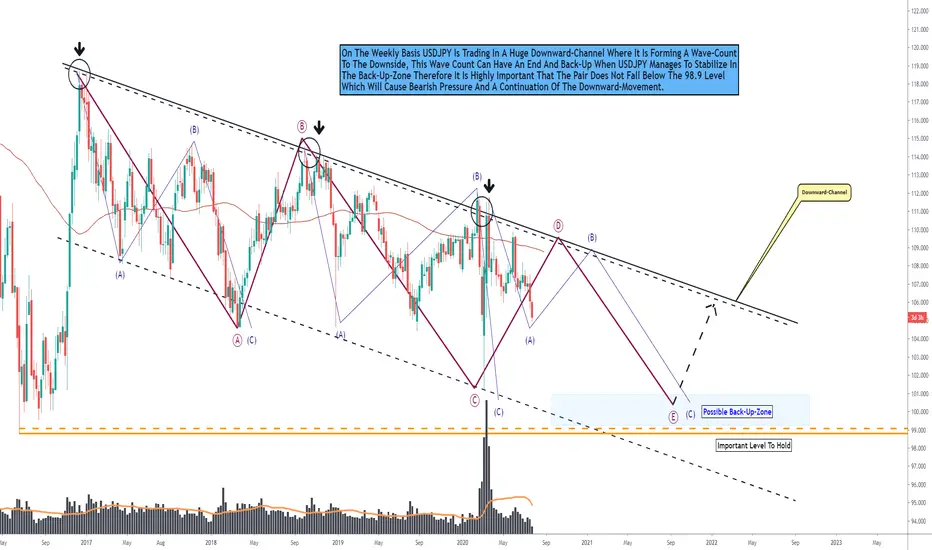
USDJPY, Build Huge Descending-Channel, These Are Important Zone!Hello Traders Investors And Community, welcome to this analysis where we are looking at USDJPY weekly timeframe perspective, the recent price-events, the current formation, its importance, and what we can expect from this pair regarding next weeks and months. This pair has been in a weak but steady downtrend since it established its highs at 118.5 where it formed heavy down moves since these tops where created, now there are some important factors that need to be considered for a continuation or reversal to the upside. Currently, I detected some interesting signals which can prove worthwhile in further development and trade placement.
As you can watch when looking at the chart is that USDJPY is just moving in this huge huge huge downtrend falling channel formation where it already formed several bearish wave counts to the downside and establishment of the lower boundary which you can watch marked in my chart with the dark-grey lines. Currently, the pair is moving on to form the last major wave count and therefore complete the possible wave D and E of the overall downward wave-count. Which will mark the completion either with another touch of the lower boundary or with a stabilization before this boundary at the range between 99-25 and 100.65 where some solid support is lying.
Overall we can expect this pair to continue its downward movements till there is support found which reverses this movement or it will go on, for a reversal consideration it is from high importance that USDJPY holds the 98.8 level which you can watch marked in orange in my chart, when the pair falls below this level it will likely continue with bearish downward pressure. When the pair stabilizes in the blue back-up zone you can watch marked in my chart there is a good potential that it moves and reverses in this range to test the upper boundary of the huge downward channel and when it is strong enough move above it but still this is not continued the direction remains to the downside.
In this manner, thank you for watching, support for more market insight, have a great day, and all the best to you!
Astonishing claims require astonishing results.
Information provided is only educational and should not be used to take action in the markets.
NIKKEI INDEX, Holding Important Levels, This Is Possible Now!Hello Traders Investors And Community, welcome to this important analysis about the NIKKEI 4-hour timeframe perspective, recent events occurred, the current formation-structure, what is possible within this environment, what we can expect when the proper scenario has confirmed rightly. In the last weeks almost all major world indices seem to recover from the heavy corona-breakdowns marked this year but the big question now will be if these recoveries are sustainable or if there are coming bigger pull-backs when not a continuation of the bear-action established this year ahead. In the NIKKEI I found some interesting and meaningful signs how further development will proceed which will have an impact on the outcome.
As you can examine when looking at my chart is that the NIKKEI is building up this triangular-formation marked with the orange triangle in my chart which is building coherently up by the falling resistance line you can watch marked in light-blue and the lower boundary of the rising channel the NIKKEI is forming here. Not only these levels building the symmetrical triangular formation which can break either to the up or downside here but also the confirmed touches of the lower and upper boundary and the several touched of the 60-EMA marked in red which is a significant factor in this range holding the overall trend to the upside, when this EMA is broken to the downside it will cause great bearish pressure, therefore, it is highly necessary to hold this EMA.
Taking all these factors into consideration and the fact that NIKKEI has not yet confirmed below the 60-EMA and therefore holding above it and the lower boundary a bullish breakout is more possible than a bearish breakout which will confirm with a 65 % possibility better as the bearish with a 35 % possibility, to make this breakout sustainable it is from high importance that the NIKKEI closes above the upper boundary with a protracted and stable move to confirm it in the right manner. When the breakout happens it can be traded conservatively after a pull-back, although the immediate entry in the triangle is also possible here it should not be kept as the best option as the triangle has still not confirmed so far the conservative trade should be smarter.
In this manner, thank you for watching, support for more market insight, have a great day, and all the best to you!
Trading is about accessing possibilities, not certainties.
Information provided is only educational and should not be used to take action in the markets.

DOW JONES, Short-Term-Gap Filled, This Levels Are Important Now!Hello Traders Investors And Community, welcome to this update-analysis where we are looking at 4-hour timeframe of the major stock-market-index DOW JONES, what it is building up the last times, and what we can expect the next times. In a previous analysis, I gave a free signal for the index with the small-term-gap to be filled which now reached its targets fully and properly within the schedule, now this fact does not mean the index is completely bullish and will continue in this manner but it has some meaningful possibilities to do this when it manages to confirm given scenarios, there are some important levels and signals which I found which can affect the outcome substantially.
As you can watch in my chart the index is trading in this important descending channel formation building a coherent upper boundary from its all-time-high to the previous highs established which it is currently testing to the upside, as the gap was filled and some supply entered the market the index is now consolidating between 26500 and 27000 which is overall a good sign that the index still holds this level. Furthermore, it has some decent support between the 26350 and 26500 levels which is marked in orange and building the lower range support below this level the index has also lower range support between 24700 and 24900 where it can bounce given within a solid likelihood.
Now given these results we can come to the conclusion that the index has two possible scenarios to play out before it confirms the upper gap to be filled. The first scenario will play out when the index holds the current level and manages to move above the falling resistance to confirm above it therefore it is from high importance that the index does this with a decisive high volatile move, the other scenario is that the index firstly falls below the support in the range and confirms the overall lower support before it climbs up and sets up to fill the gap. As there is still some solid support in the range of the first scenario, scenario A is more possible within a given possibility of 65 % and scenario B with 35 %.
This technical situation of the index does not alter the whole dynamic of the stock market which is currently trading in a speculative movement where many retailers enter the market while smart-money staying on the side-line. This can go some time but sooner or later the differences between the real economy and stock-market will be to be that either an adaptation of the two factors occurs or a shift into the bearish perspective again which can increase to the downside as there are many retailers in the market since the corona-breakdowns seen this year. The bullish short-to-middle-term perspective does not alter this fact therefore it should definitely not be kept aside, it will be highly interesting how this dynamic will develop.
In this manner, thank you for watching, support for more market insight, have a great day, and all the best to you!
Even though fortune's destiny seems obscure in the present, it is actually beginning right now.
Information provided is only educational and should not be used to take action in the markets.

UNH, Holding The Established Level, Possibility To Continue!Hello Traders Investors And Community, welcome to this analysis where we are looking at the selected single stock value UNH (UNITED HEALTHGROUP INC) the recent events within it, the current interesting price-formation and what the stock can provide in order for possible upcoming trading opportunities. As I pointed out already in previous analysis there are stocks which can move anticyclical to the main market as the demand is increasing due to the corona-crisis, one sector in this possible anticyclical market movers is the health sector where UNH is building an important part within health insurance as more and more people looking for improved healthier life and want to be secure in this case, therefore, this fact can play a big factor in the development of bullishness within this stock, besides that there are also some meaningful technical signals making an upcoming bullish continuation possible within this stock.
As you can examine when looking at my chart UNH is moving in this recently established uptrend channel where it bounced at strong support at the POINT OF CONTROL you can watch marked in red, this is the point where the stock showed the most volume overall, therefore, an important support/resistance level which confirmed as support in this case. Furthermore, we have this newly established all-time-high at 305.5 which has taken out the all-time-high formed before the corona-breakdowns seen this year, firstly this can also be a bull-trap but as the price is holding near that level this is showing up some significant bullishness in that level and a sign that the breakout could not have been a bull-trap. As the stock currently tests this level with some healthy volatile up moves this can be an indication for a possible continuation to the upside when UNH manages to climb above these levels as you can see it marked in my chart.
As you can watch in my chart there are some solid support levels providing an increasing possibility for the bullish case, once it is the 100-EMA which is marked in black, secondly, it is the POINT OF CONTROL which is building up very strong support in this level and next to the overall uptrend channel building altogether a coherent bullish support cluster here where the price will have a hard time going below when there comes bearish pressure into the surface. These factors making a bullish continuation to the upside more possible which will be confirmed when UNH takes out the current resistance it is testing and forms some faster-moving trend which finally breaks above the uptrend channel to confirm more bullishness in this case, remember that this has to be confirmed properly and before it does not happen there is still a possibility to show bearish which is quite marginal but it should not be ignored in either case.
Overall this stock is showing some serious bullish signals for a possible continuation to the upside making the movement at the all-time-high-conditions in this stock a stronger one than rest of the market where many stocks and some indices are still below the all-time-high established before the corona-breakdowns and therefore there is no confirmation of the bull-market-ending till now, therefore, it is important to look for stocks which showing up stronger than rest market when considering something on the long-side which I showed with other stocks of other sectors in the previous analysis were some holding strong bullish above the EMA structure and other below it with incoming bearish signs, in this case, it is important to not averagely evaluate the whole market in just one direction which can be fatal in such market phases showing up these days as there are stocks profiting of the crisis while another struggle to hold the status quo.
In this manner, thank you for watching, support for more market insight, have a great day, and all the best to you!
There are many roads to prosperity, but one must be taken.
Information provided is only educational and should not be used to take action in the markets.

SPX500, Setting Up For A Major Gap-Fill!Hello, Traders Investors And Community, welcome to this analysis about the current situation with the important S%P 500 Index, what the current formation is telling, and what we can expect from the index the next hours and days. As I already mentioned in previous analysis the index was setting up for a gap fill on the 4-hour chart and on the smaller timeframes which has now fulfilled and as there did not enter increasing supply since the gap-fill till now there are some interesting signals I detected which can determine the further outcome of the index. Fundamentally the situation is still critical for the bull-market rally in the stock market where there is a big difference between the real economic growth and the stock market, where the real economy is still damaged by the crisis the stock-market is testing upside levels which need to change to an symmetrical environment where the real economy and stocks go together to provide a solid market.
As you can watch in my chart the index just moved above the major key-level which is marked in orange in my chart and is now consolidating above this level which is normally in the most occasions a continuation sign. Furthermore, we see the index still holding above the 55- and 400-EMA you can watch marked in green and black in my chart which is a more bullish than bearish environment when the index had been closed below these EMA-structure this fact would be the reverse as I pointed out in the analysis of the single stocks I published covering picked titles from the market. You can also watch this principal parallel channel in which the index is trading which when confirmed to the upside can lead to a bullish surge in price and set up to fill the gap we have at the 3333 levels which will also match with the price projection target of the parallel channel, taking these conditions in consideration it is a high possible confirmation that can develop.
Although this scenario is likely on the short-term-basis as we speak from the 4-hour chart here this does not mean the index is completely bullish as this can also be a huge bull-trap which is supported by the fact that mostly the smart-money is staying out of the market currently and the uptrend is not fundamentally backed, therefore, it has to be considered what the index will do after confirming the more likely gap-fill scenario and if it will advance further to test the all-time-high condition or show bearish pressure. The current rally is mostly monetarily driven as central banks pumping money into it the corona damaged economic situation has not changed yet, we will see if this can change within the course of the next hours, weeks and days but for now, the bearish scenario is not out of the desk, therefore, it should not be kept aside as there are many factors which can support a possible continuation of bearish pressure established this year.
In this manner, thank you for watching, support for more market insight, have a great day, and all the best to you!
Conviction is the search for ultimate meaning.
Information provided is only educational and should not be used to take action in the markets.

D-JONES, Double Bottom, Possibility On The Long-Side!________________________________________________________________________________________________
Hi Traders, this is a signal I give to you for free today. Support will be great with a like and follow when useful.
________________________________________________________________________________________________
ENTRY: 25850-26000
MINIMUM TARGET: 26900
STOP LOSS: 25395
MINIMUM RISK REWARD: 2.55
REASON: Double Bottom
________________________________________________________________________________________________
In this manner, thank you for watching and support for more market insight.
Information provided is only educational and should not be used to take action in the markets.
________________________________________________________________________________________________

AUDUSD, Developing Triangle, Opportunity When Confirmation!Hello, Traders Investors And Community, welcome to this update-analysis where we are looking at recent events, the current price-structure, and what we can expect the next hours and days from AUDUSD. The major uptrend which I forecasted in previous analysis about AUDUSD confirmed properly as mentioned and touched the trendline before showing bearish signs to the downside where AUDUSD is building an overall consolidational range here if you did not saw this analysis already I highly recommend that you look at it when going on my account to have a full-depth-overview. Besides this fact, there are some other interesting signals which I determined and which will affect AUDUSD in a significant way.
As you can examine when looking at my chart now is that AUDUSD is moving in this overall sideways range which is building a triangle that is marked in my chart with the blue trendlines. At the moment this triangle can confirm either to the up or downside as there are factors playing into both scenario, on the bearish side it is the fact that AUDUSD is heavily overbought and after such a bull run normally comes minimum a smaller correction when not a bigger pull-back, on the bullish side it is the fact that AUDUSD is still holding above the 400-EMA in black and the 100-EMA in light-blue which are serving as strong support levels holding the trend to the upside, therefore, the price currently reaches an equilibrium state where it has to show which is the proper direction.
On the smaller scale, AUDUSD is developing the overall wave count where it is setting up the final wave E now to complete the overall wave count. This happens when the upper boundary is touched a last time after which we can get another pullback before the final breakout establishes. At the moment it is possible that AUDUSD breaks directly to the upside or to the downside but this probability is at the moment highly marginal because the triangle isn't established for that long time now. From a trading perspective, the breakout can be traded either aggressively with an immediate entry or conservative with entry after confirmation, therefore the fact that it is possible to confirm the triangle in both directions the conservative approach to wait on confirmation is definitely smarter here.
In this manner, thank you for watching, support for more market insight, have a great day and all the best my friends! ;)
The grand aim of all science is to cover the greatest number of empirical facts
by logical deduction from the smallest number of hypotheses or axioms.
Information provided is only educational and should not be used to take action in the markets.

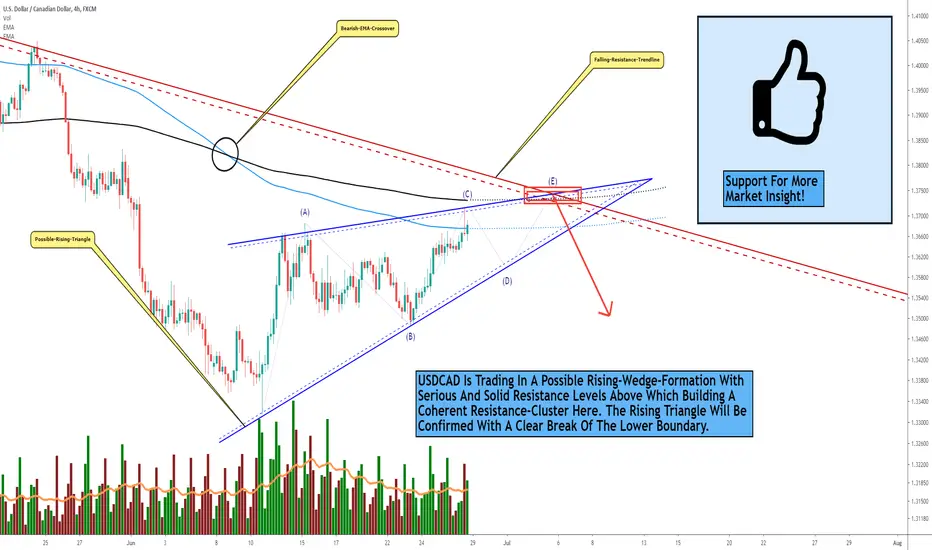
USDCAD, Consolidating In The Range, Possible Triangle Formation!Hello, Traders Investors And Community, welcome to this analysis where we are looking at the recent events, current price-structure, and what we can expect from USDCAD the next hours and days. As USDCAD fell below its important consolidation and established a downtrend which moved below the fundamental EMA structure it is now recovering and showing some up moves the last times but there are some important and significant signals and signs I detected which will affect the price of USDCAD sustainable therefore we are looking at the 4-hour timeframe.
As you can watch in my chart USDCAD is moving in a steady but weak volatile uptrend since it marked its lows at 1.334, for now, this uptrend is building a narrower range the more USDCAD advances in price, this range is building an overall possible ascending-triangle-formation here which you can see marked with the blue trend-lines in my chart where the lower and upper boundary already touched several times, such a formation is normally a formation which is confirming bearish to the downside when confirmed properly which will happen when the lower boundary crossed to the downside.
Furthermore, USDCAD has important resistance clusters in the structure which is firstly the 200-EMA marked in blue in my chart, secondly, the 500-EMA marked in black and the falling resistance line which is marked in red, taking all these factors in consideration USDCAD has serious resistance levels in the structure which will be highly likely confirmed when touched in this level, also we have the wave-count which is finished when the final wave E ends at the bearish resistance-cluster and turns bearish to the downside which will confirm not only the wave count but also the wedge.
When the bearish scenario sets in as expected and with the proper volatility it can be traded on the short-side with either an aggressive entry or a conservative entry. The aggressive approach will be right immediately when USDCAD shows bearish signs in the resistance cluster and the conservative approach will be when the lower boundary finally confirmed to the downside, although both entries are possible the conservative approach will be smarter and traders into this direction should decide on individual risk-preferences.
In this manner, thank you for watching, support for more market insight, have a great day and all the best my friends! ;)
It is the job of the market to turn the base material of our consciousness into gold.
Information provided is only educational and should not be used to take action in the markets.
JP-MORGAN, Moving In Massive Channel, Testing Remaining Levels!Hello Traders Investors And Community, welcome to this analysis where we are looking at recent events, the current price-structure, and what we can expect the next time from the famous large capitalized investment bank JP MORGAN. As it is well known that banks are not within the high performers in the stock-market nevertheless there can be some interesting trade opportunities especially in the current crisis and the possible ongoing stock-market declines where many people saying it was just the beginning which we had seen in March. With an increasing fear of new corona-restrictions and the resulting declines in the stock market out of it, the vast major market like S&P or RUSSELL currently shows some bearish pressure which will increase when important support levels do not hold, I made an analysis on this which I recommend you to see when you do not see it already when going at my account and look at the analysis, furthermore we have with JPM a stock where I detected some meaningful signals at the moment which can determine the further outcome of the stock.
As you can examine when looking at my chart is that JPM is trading in this huge huge possible bear-flag which is marked in blue in my chart where the stock already touched several times the lower and upper boundary of the channel and therefore confirming it. Technically this possible massive bear-flag is confirmed when the price crosses with a volatile and decisive move the lower boundary to the downside but before that scenario can be taken into consideration it is within a highly possible spectrum given that we see some up bounces before that happen to test the remaining resistance levels and confirm them, these will be once the Fibonacci-resistance levels you can see in my chart where the 50 % is an important and strong resistance which is also matching with previous mirror levels and furthermore the higher 23.6% resistance which is also matching with the upper boundary of this important channel and building, therefore, a coherent resistance cluster. which will be confirmed when there is bearish pressure on these levels.
Overall we have currently a strong bearish environment for the stock and although the bank may have gained good profits with short selling in the bear market decline which also other smart investors and traders did it is showing that more bearish than the bullish picture which should not be ignored in any case, as many people called for the bear market already recovered and the bull market coming back and holding on now we should not be naive because there is no substantial fundamental backing for this, besides that no technical, therefore we should be prepared for a possible bearish decline and do not take the bull moves for face value as it can still be a huge bull-trap which is showing often after another big wave to the downside comes. We will see how the overall situation develops and back up the track when a decisive scenario like the possible bearish decline sets in to profit out of upcoming possibilities in the further market environment.
In this manner, thank you for watching, support for more market insight, have a great day and all the best my friends! ;)
The eye sees only what the mind is prepared to comprehend.
Information provided is only educational and should not be used to take action in the markets.

KO, Weaker Than Rest Of The Market, Trading In Channel!Hello Traders Investors And Community, welcome to this analysis where we are looking at recent events, the current structure and what we can expect from KO (KOKA-KOLA) the next hours and days. As I already mentioned in previous analysis there are gainers and losers in the corona-crisis which showing up weaker than the market or stronger than the market, this is a similar mechanism we have already seen in the past for example with the dot-com-bubble in 2000 in which many companies were sorted out due to inefficiency and other reasons. Normally KO should minimum be as strong as the S&P 500 index when not also stronger than this index because it is a consumer durable where demand boosted during the lockdowns and which can still steadily increase the next times when looking at possible new lock-down-restrictions but this does not currently show up in KO which also showing up in the technical analysis, therefore, we are looking at the 4-hour locally timeframe.
EXAMPLE STOCK: J-JOHNSON, Stronger Than Rest Market (4-Hour Timeframe):
EXAMPLE STOCK: BERKSHIRE, Weaker Than Rest Market (4-Hour Timeframe):
As we can examine now when looking at my chart is that KO is printing a clear bearish picture below the important 500-EMA in black where we have strong stocks which are above this EMA this show the current weakness of KO and also the fact that it is consolidating way below the all-time-high where we have other stocks which are near at this level or already formed new highs, this is another factor counting into the bearish environment which is currently developing in the stock here. In comparison, this stock has a similarity to BERKSHIRE which is also in a bearish state with more potential to the downside upcoming. Now, as you can see in my chart KO is forming a parallel channel here marked in blue in which it is consolidating, as it is approaching the lower boundary another time now we can expect a bounce from here higher to the upper boundary which will complete the wave count it is currently forming and from there form a leg to the downside which is more possible at the moment than the immediate bullish continuation above the upper boundary when the stock has done this like you can see it marked in my chart we need to see and elevate how the stock develops further.
Just on the technical side of things KO is a clear loser of the current corona-crisis in comparison to the rest-market and in comparison to the leading S&P 500, this can spring up from a decrease in demand to drink and consume unhealthy consumer goods which have a lot of calories and sugar and can cause serious health problems, this theory can be evidenced by the fact that more and more people these days, especially in the corona health crisis, want to live a healthy and sustainable long life, this approach can fundamentally underline the bearish picture the stock is currently showing. We will see how this is developing the next times so far and if there is more downside to expect as you can see in my chart KO needs to hold the highly important 76.8 % Fibonacci-support for solid support when falling below that level there is a high probability given that bearish pressure to the downside increases further. It will be interesting to see how this is playing out further and especially if KO can back up when the major other market goes up or if it fails and the bearish sign increasing more, as this is now the time where it shows up who is profiting from the corona-crisis further where many companies from the digitalization industry have better cards at the moment.
In this manner, thank you for watching, support for more market insight, and all the best!
Even the smallest shift in perspective can bring about the greatest fortune.
Information provided is only educational and should not be used to take action in the market.

SPX500-Index-Market-Status-UpdateHello Traders Investors And Community, welcome to this update-analysis about events since the last one, the current structural elements added to the environment, and what we can expect or nor expect from the SPX500 index. As mentioned in the previous forecast the index was and is trading in an important uptrend-channel which holding the whole bull-market construct to the upside since the corona-breakdown-lows seen this year, if you did not already see this analysis I highly recommend it to you when going on my account to have a full-depth-overview. As there increased the bearish pressure the last weeks due to new corona-fears and ongoing difficulties in certain fields which resulted in a swift down move with a gap developed and a piercing of the lower boundary the situation has altered to a shaky index right now, in this territory, we need to keep the possible scenarios coming upon us in mind to act accordingly when they happen and do not forget the still not recovered real economy.
As you can examine now when looking at my chart is that the index pierced the lower line of the channel to the downside which can certainly be a bull-trap before moving higher but the volatility with which this breakdown happened should not be ignored also the gap which provided during this speedy bearish breakdown was more bearish than bullish. This case shows one more time how events can affect the price in a fast and undetermined manner. For now, the index has found some support at the 30-EMA you can see marked in orange within my chart and now setting up to possibly fill the gap which confirmed downside when this gap-fill play out now we need to keep in mind that after such a mechanism the supply in the market can increase again as there are still sellers in the level who want to sell at certain prices.
Now when this overall scenario takes places it is from high importance for the index to hold the uptrend-channel to establish a solid base of support here because when this does not play out we will get bearish pressure to the downside for sure when confirming below. This will move the index to test remaining lower levels which will be the 100- and 500-EMA you can watch marked in green and black in my chart, in this case, the 500-EMA is extremely meaningful to establish support otherwise the index has a huge critical bearish zone below the EMA that is marked in red within my chart when the index confirms below that level it will increase bearishness to the downside and lower levels will be marked. On the other term when the index stays within the uptrend-channel it has to confirm above the established 3230 high to move higher and test the remaining all-time-high levels.
When comparing the technical situation with the fundamental real economic situation we can take note that the rally seen since the corona-lows this year was mostly driven by fresh money pumped into the market and was a recovery of the heavy breakdowns established this year which is a normal mechanism but the fact that the real economy does not grow together with the stock-market and is still damaged from the events happened makes the rally a more unhealthy environment because the real economy and stock-market should move together, therefore when considering the next weeks to come and a possible bullish continuation it is from high importance that the real economy grows together with the stock-market otherwise this bullish rally which will establish would be a speculative money-driven bull-market with no underlying fundamental base of growth, such a speculative rally can lead to more difficulties in the aftermath where bearish pressure can increase again, therefore, the rally should be seen with an critical eye to be on the track in case of possible upcoming volatility.
In that manner, thanks for watching, support for more market insights, and good day my friends.
Prospect is the ingredient of good fortune.
Information provided is only educational and should not be used to take action in the markets.

USDJPY, Below Major Resistance, Main Possible Bear-Flag Forming!Hello, Traders Investors And Community, welcome to this analysis about USDJPY, the recent events, the current price-formation and what we can expect from USDJPY in the next hours and days. The last time USDJPY made this significant bear-move to the downside where it provided heavy bearish selling volume after marking its high at 10.810. Since then it was in a meaningful downtrend which can increase further when we do not get any bullish signs to the upside which will invalidate the bearish scenario and how I detected in the chart this is the more likely possibility at the moment therefore we are looking at the 4-hour local timeframe.
As you can examine when looking at the chart you can see that USDJPY is currently trading in this huge parallel channel marked in blue within my chart. As we found some resistance at the lower boundary we can expect some little up bounces the next time to test the remaining resistance levels in the structure. These are firstly the 100-EMA which provided the failed bullish cross with the 600-EMA and secondly the 600-EMA where we havea also a local mirroring-resistance which is together with the 600-EMA building up a coherent bearish-resistance-cluster in that level which will highly likely confirm to form the next steps in the possible bear-flag USDJPY currently develops.
Overall we have a decent bearish environment here with more downside potential after the possible bear-flag has confirmed finally when the wave-count ended. This will provide a bearish signal to the downside which can be traded aggressively with an entry immediately at the bearish resistance-cluster or with entry after the lower boundary of the possible bear-flag broke to the downside and the bear-flag has confirmed finally, traders should decide according to individual risk-preferences but the conservative entry after confirmation should be preferred here when considering this scenario there is still plenty of profit potential as the targets lying way at the downside.
In this manner, thank you for watching, support for more market insight, good weekend everybody, and all the best friends!
Information provided is only educational and should not be used to take action in the markets.

J&JOHNSON, Stronger Than The Rest Market, Possible Bull-Flag!Hello, Traders Investors And Community, welcome to this analysis about the recent events, the current price-structure and what we can expect the next hours and days within J&JOHNSON. As I already mentioned in previous analysis in the current corona-crisis there are gainers and losers who are profiting either out of the crisis or having deficiencies to catch up onto the level seen before the corona-fears hit the markets. Therefore we see a paradigm shift in the global economy similar to these ones we have seen in the past where there have been companies which gone bankrupt due to lack of resilience and others which survived the crisis and exist still today, this was a constant repetition in the financial-crashes we have seen in history and it is repeating itself right now as history does not change at all only marginally when the necessities desire different circumstances. Therefore we have stocks that perform better than the markets, which are the truffles within this situation where we should keep an eye on when considering something on the long side and there are others that cant catch up with the train and consolidating or downshift.
Example Stock: Weaker Than Rest Market: BERKSHIRE (4-Hour Timeframe):
When looking at my chart you can see that J&J is trading above the 800-EMA marked in black which firstly is a strong sign that the stock holds above the EMA, furthermore, we have the 100-EMA which you see marked in green within the structure of my chart which provided a failed bearish-cross, this is a bullish sign indicating that the bulls are stronger than the bears. It is also the major difference to BERKSHIRE where the 100-EMA crossed the 800-EMA to the downside and provided a bearish crossover signal since which the stock didn't take these EMAs out this gives adds a more bullish edge to J&J at the moment which is trading in a possible bull-flag right now which you can see marked in blue.
The next time we can expect the stock to test the support it has remaining in the 138 level and the 800-EMA after forming the wave D of its overall wave count. When this test provides successful and solidity confirms at that level it is within the possible spectrum that J&J moves higher to confirm the huge possible bull-flag in which it is trading at the moment, this scenario will play out when the stock crosses with good volatility and sustainable above the higher boundary of the channel. When the stock provides such a breakout it will move onto its targets within the all-time-high range with a high possibility and even higher after that when there confirm good bullish volatility and no other meaningful bearish signs which alter the situation again.
Taking all these factors into consideration we have a technical basis for J&J to succeed next times although because it is the pharmaceutical company with the biggest market and as I already pointed out in past analysis these are stocks which can provide gains also in the current corona-crisis and show a possible anticyclical movement compared to the average rest market. In comparison with the S&P 500 which is still below its all-time high, we have a stronger picture here at the moment. We will see how this will develop further the next time and if J&J provides to hold this strong environment. Although there can still show new volatility to the downside in the average market due to upcoming corona-restriction this can add to J&J but as it is a possible anticyclical market mover the volatility to the downside can proof not that devastatingly fatal.
In this manner, thank you for watching, support for more market insight, good day, and all the best!
“Learning is an ornament in prosperity, a refuge in adversity, and a provision in modern markets.”
Information provided is only educational and should not be used to take action in the markets.

P&GAMBLE, High Volatilty-Stock, Huge Triangle-Breakout Incoming!Hello, Traders Investors And Community, welcome to this analysis about the recent events, the current formation, and what we can expect in what the last weeks have shown us highly volatile stock PROCTER&G. As I mentioned already in past analysis about the stock-market we are progressing in historical levels within the whole market where we can observe big differences within the individual stocks and its price-levels, as some looking more bullish and have taken out all-time-highs already there are some stocks which show high downside potential. A big factor in these differences is the corona-crisis where we have gainers and losers either profiting out of the crisis or not because of the bad lineup in the real economy. Within P&G we have a stock which is consolidating in an increasing tightening range that will show a huge breakout the next times, although the bearish breakout is possible there are some stronger signs which making the bullish breakout more attainable.
When looking at my chart you can see that the stock is trading in this huge symmetrical triangle with the tightening pace and the current consolidation above the 100 and 30-EMA you can see marked in my chart with orange and light-green which is a decent bullish signal at the moment which can be the determining factor contributing to the upcoming bullish breakout. When looking at the past weeks and months we can examine that this is a highly volatile stock showing the big price swings in the past which can prove profit full for an intelligent trader with the right arrangement in the market. Compared to the leading index S&P 500 and other stocks we have a definite consolidation in this stock at the moment which can change as mentioned but compared to other stocks like BERKSHIRE or J&JOHNSON we have the confirmation of the underlying trend and tendency still awaiting within P&GAMBLE here. Counting all these factors together and in comparison with the other stocks, we can come to the conclusion that a breakout to the upside and visiting of all-time-high levels is more possible with this stock than the breakout to the upside.
COMPARISON STOCK: Stronger Than The Market: J&JOHNSON (4-Hour Timeframe):
COMPARISON STOCK: Weaker Than The Market: BERKSHIRE (4-Hour Timeframe):
After the stock has confirmed the breakout it can be traded with an entry immediately after the breakout or with a revisit of the higher boundary and a conservative entry, traders should decide according to individual risk-preferences. Remember that the breakout has to show with solid volatility to the upside a mere piercing and fall back into the triangle will indicate a fake breakout. When considering the corona-crisis factors the stock is a consumer durable which can show an anticlinal market-movement as consumer goods had a high demand in the lock-downs, this demand can increase again when there are coming new corona-restriction waves. We saw this demand also with the high bounces to the upside in this stock during the corona-breakdown period. So according to the current situation we have also a more bullish environment within the fundamental side of things, therefore, it will be interesting how this scenario plays out properly.
In this manner, thank you for watching, support for more market insight, good day and all the best!
Even the smallest shift in perspective can bring about the greatest prosperity.
Information provided is only educational and should not be used to take action in the markets.
