HOW-TO [TTI] IBD Market SchoolHOW-TO instruction.
This video shows how my custom IBD Market School Indicator works for TradingView.
–––––––HISTORY & CREDITS–––––––
This indicator is based on the Market School Program from IBD and it is the core logic for which I have developed the indicator. The whole system is based on the model books for the greatest winning stocks from the past. The names of the people who have contributed to this system are William-Oneil, Mike Webster and Charles Harris.
–––––––WHAT IT CALCULATES–––––––
10 Buy Signals:
👉Follow Through Day
👉Additional Follow Through Days
👉Low above 21-Day MA
👉Trending above 21-Day MA
👉Living above 21-Day MA
👉Low above 50-Day MA
👉Accumulation Day
👉Higher High
👉Downside Reversal BuyBack
👉Distribution Day Fall Off
14 Sell Signals:
👉Follow Through Day Undercut
👉Failed Rally Attempt
👉Full Distribution minus One
👉Full Distribution
👉Break Below 21-Day MA
👉Overdue Break Below 21-Day MA
👉Trending Below 21-Day MA
👉Living Below 21-Day MA
👉Break Below 50-Day MA
👉Bad Break
👉Downside Reversal Day
👉Lower Low
👉Distribution Cluster
👉Break Below Higher High
–––––––HOW TO USE–––––––
Each buy signal is a +1 and each sell signal is -1 point to the general count.
We will add all buy and sell signals to produce an overall count from 0 to 5. Based on the count this will translate to market exposure from 0 (at count 0) to 100% (at count 5). Essentially this will help you scale in and out of the market.
Market

DXY - Be Prepared! 📣Hello TradingView Family / Fellow Traders. This is Richard, as known as theSignalyst.
For those who know me, I always keep an eye on DXY to feel the overall market (stock, crypto, forex)
As per my last analysis (attached on the chart), DXY rejected the upper bound of the brown channel and traded lower.
Now What? and why you need to be prepared?
As we all know, while DXY was losing strength, the entire market (stock, crypto, forex) has a bull relief movement.
But I believe, the party will be over soon!
Here is why:
DXY is approaching a strong rejection zone that consists of two textbook structures.
1- the 102.0 - 103.5 is a strong resistance turned support
2. the blue zone is a strong demand zone as it is the only bearish candle inside a previous big bullish movement upward
As per my trading style:
As DXY approaches the blue zone, I will be looking for bullish reversal setups on lower timeframes (like a double bottom pattern, trendline break , and so on...)
Always follow your trading plan regarding entry, risk management, and trade management.
Good luck!
All Strategies Are Good; If Managed Properly!
~Rich

S&P 500 Big Picture - Bearish ScenarioMany investors are already assuming a breakout from the upper trend line and thus a continuation of the uptrend.
The economic sentiment is still bearish, many companies now have to bear the high capital and energy costs and many companies are still highly overvalued.
Therefore, today we would like to introduce you to a bearish scenario that is likely to occur, the Double ZigZag.
Structure of a Double ZigZag
- Superior: (W) - (X) - (Y)
- Subordinate: (ABC) - (ABC) - (ABC)
- Subwaves: (12345 - ABC - 12345) - (ABC) - (12345 - ABC - 12345)
Current situation
If this scenario is correct, we would be in the last sub-wave ABC and now see the last downward movement as sub-wave 12345. This would complete the last subordinate (ABC) wave.
This scenario would be confirmed if in the next few days/weeks the SPX initiates a trend reversal to the downside. We already see a weaker SPX struggling to pump above the yellow highlighted resistance. Even if we could make it above this, it would have to be retested first and thus hold above resistance.
We now expect the SPX to either make another small breakout to the upside before correcting back down, or for the SPX to correct right away.
Strongly changing market
The market is very difficult to assess at the moment. Many economic news are affecting the markets very strongly, new political and economic changes are coming at a record pace and most investors are still afraid to lose money. Thus, this Double ZigZag scenario is one of several possible scenarios. We will post a bullish scenario in the next few days.


Market correlationThis is how I use the markets' different points to confirm the trades that I usually take

MANAUSDT looks BullishLooks like MANA is planning to take a flight hope btc doesn't disturb the pattern
trade with caution and do your own research too

Is the US Economy Actually adding more jobs than expected?If you have been living under a rock for the past few days, unless you are not an economic savvy, the Bureau of Labor Statistics has released its newest Non-Farm Payrolls much above the expectation. The NFP rose by 263,000 last month, compared with an expected 200,000.
At first, my reaction was that the FED will have to keep raising interest rates, especially as the US dollar reacted to this news by jumping 0.8%. However, I was skeptical as to how NFP jobs increased but the unemployment rate remained steady at 3.7% in an economy that is starting to experience drawdowns from inflation. So I made a research to analyze exactly what is going on.
1. What is happening in the US labor market?
Today the NFP is at ~270,000 jobs, similar to mid-2018 when the labor market was defined as strong. It is much lower than the peak job creation in 2021 but 70,000 extra jobs compared to the expectation is a major difference.
2. What is happening with wage growth in the US labor market?
Wage growth has increased by 0.6% month-over-month. This is way too strong for the FED's target of 2% in inflation. But why is it so high? Well, one of the reasons is that the supply of labor is not coming back. The participation rate remains way below pre-pandemic levels, even when accounting for an aging population. So if labor participation is low, job creation must be low to slow inflation, yet, the labor market appears to be healthy.
Nonetheless, I wrote an analysis in October challenging the FED's data collection on job creation.
"Once consumers have reached their credit limit, they will most likely look for another job. “About 38% of American workers have looked for a second job, while an additional 14% plan to” (LA Time, 2022). This justifies the reasons for more job creation in the U.S. economy as emphasized by the Biden Administration and the Fed, however, it is mostly people looking for a second or third job."
Credit debt is increasing at an all-time high due to inflation. "U.S. households are spending $445 more every month due to inflation" (Lacurci G, 2022). So those who cannot keep up with their bills have to work more jobs or extra time.
This makes total sense, especially when the Household Job Survey shows no jobs added in the past 8 months, while the Establishment Survey shows 2.7 million jobs added, which is the one used by the FED.
Why such a large difference between the Household Job Survey and Establishment Survey?
The answer lies in how the different surveys are run.
For instance, the household survey counts people holding multiple jobs as one employed person. While the establishment survey counts all the jobs created, even if it is a second or third job. Based on the analysis I previously published, at least 700,000 Americans have had a second or third job in the last 12 months to make ends meet.
3. Where are jobs being created and lost?
Being created: leisure, government, education, and healthcare.
Being lost: goods, transportation, retail, construction, and utilities.
Conclusion:
The NFP survey is informing the market about Powell's next decision in December. The strong nominal wage growth and "strong" job creation argue there could be further rate hikes and hawkish talk from grandfather Powell. It is imminent before we will start to see weaknesses in the labor market. It is imperative to understand when will the turnover point of the labor market be and how bad to best position yourself, hence, we can start to see a FED pivot in early 2023 as the labor market weakens.
This is for personal recording but feel free to comment and argue.

IS THE RALLY FINALLY OVER?SPY
We had two scenarios yesterday during our stream
1.) Preferred scenario would be for the spy to pullback down to 400-398 or trendline and hold for the rally to continue to the upside. So a pullback or consolidation around this level is healthy. Just remember its December, I always look forward to the Santa Rally if you've been in the market more than a year or two you know what that means.
2.) If SPY Pulls back and breaks this trendline and strong support, FEAR / FOMO / SQUIZZLE can happen and the bear market continues.
We don't know exactly whats gonna happen in the market but we just ride the wave and make mullah along the way 🙂
Have a blessed weekend ahead and trade smarter!

Short GBP/USD there is an opportunity here , i think this pair will decline in the next days after rally in the last weeks , the fed pivot will happen in the 14th DEC and a lot of investors and economists think that usd will collapse against currencies i think it’s not and market will go against the majority of investors , waiting for gold and stocks will decline sharply


NZDUSD will probably make a Lower Low with today's risk-offNZDUSD tested trendline and going lower with today's riskoff market.
To know with absolute confidence is impossible.

S&P Futures Surprise!We have watched Futures price unable to climb above resistance at 4002.
Today buyers gave strong indication that they were not ready to let price reject and drop form here. Closing the day with strength above 4000.
What can we expect next?
Next target for Futures is 4090 and 4132
If price is able to build above resistance near 4090-4132 we might see a push to 4199 without breaking the Macro Bear structure.

Decisions must be made or repeat of past trendAt this area is where we have decided multiple times for the long term outlook of being bullish or extremely bearish. The last 3 times it created the "grey box" after seeing a supply rejection area (orange box), it made a huge move down to test the lows. Now it is back to that major supply area and if it repeats history like the past 2 grey box retests, you can expect a move down. If it blows past the grey box, i would be on a bullish side outlook with buying the dips at past demand areas or prior resistances.
Based on extremely recent news this might breach the grey box but it is still worth looking at with a more lenient stop loss for shorting if you are looking to enter to the downside.

EURJPY Short Opportunity - NOVEMBER RECAP Posted analysis within the setup!
Nice 2RR trade, good M.S and P.A
S turned R and complete RT with bearish engulfing and momentum candle.

Bitcoin Potential Bottom and the End of 4 Years CycleHello all, Lets surf the chart!
The bottom is not yet in, no one can argue. Though catching the bottom is not a key here because we can not predict the depth of the decline, to identify the low it is necessary to time the best buy for long term hold (for the x gains) and trade for short term. In short, risk and reward potential.
Time is an important factor which allows me to be a student of cycles especially the one with Bitcoin.
Is it a perfect indicator?
Not perfect but good. Knowing that the Bitcoin cycle started in Dec 2018 lows and confirmed in Feb 2019 gives us the idea that Q4 2022 is the end of BTC 4 Years Cycle and could extend to January 2023. In this range we could expect lows and that buying this dip could be a good risk/reward for the long term.
As bitcoin price starts a steady grind to its new cycle, I will begin to share my ideas as I walk through it. Hope we learn together from here onwards.
Sharing from the chart are scenarios of the different possibilities I am expecting for Bitcoin regardless of the fundamentals and why this level is significant in the upcoming days.
For 20 weeks or so, Bitcoin remains above strong support at 18k to 20k, this is the key level from the 2017 cycle top so it is imperative that the demand in this area is high since it is known that Bitcoin can NEVER go below its all time high.
However, 18k support is broken and price crashes to sub 15k in one day. The probability of going lower is increasing given bitcoin history of 85% - 90% drawdowns which can send it to 10k to 13k area. PLUS the increasing market sentiment, FTX crash, its contagion in the ecosystem and Bitcoin is dead right at the timing band of 4 years cycle lows.
Will it bounce from here?
If we look at 2017 top to bottom (black arrows), it took 52 weeks to complete and then followed by 8 weeks of accumulation before the bounce. Note also is the amount of capitulation in all the lows (red arrows) and it is decreasing as time goes by.
It is in 53 weeks now and considering the above scenarios, two things to expect.
Zooming out the current price action, BTC found support at 15k with daily closing at sub 16k. I expect it to test 18k, a support now turned resistance and if rejected, it will then go back down to 15k and range bound from there.
Above $18200, it's a LONG spot. But if 15k is broken then the continuation of the downtrend is likely to be at 13k to 14k where it could find immediate support in the short term.
This is it for now. Thank you for reading and will update soon. Appreciate the comments, supporting ideas as well as contradicting ideas.

RLinda ! BTCUSD-> Bullish signals. Deception or reality? Bitcoin is up 8.3% from a two-year low. Bullish pattern, head and shoulders, pre-breakdown consolidation. What to expect in the future? Let's find out!
At the same time, on the weekly chart the RSI forms a divergence, which may signal a preliminary long-term bullish signal.
Stochastic on the monthly chart is at the bottom and crossing lines are forming. Similar situations occurred in 2015 and 2019.
Monthly chart, Stochastic is on its bottom, at the same time stochastic moving lines are forming a crossover
Price is updating its two-year lows and heading towards 13880
Visualization based on logarithmic data
The global support line runs along the lows of the wedges.
There are 3 full cycles on the chart, which include: a bearish wedge - a bullish set-up, which the data shows is working great.
The last two full cycles form a pullback of about 85%, after which the wedge reaches the bottom, price reverses and exits the wedge up
The very first cycle formed a pullback on the logarithmic data of about 82%.
It is worth making an assumption. Based on the data of the three extreme cycles: we can assume that the price may fall to the approximate mark of $10000, after which bitcoin may go into a consolidation phase, which will outline the bottom
The current drop is inferior in percentage terms to the 2017-2018, 2013-2015, 2010 corrections.
December bitcoin futures are now in backwardation, which is fairly atypical of the bitcoin market and indicates strong global selling in the moment.
The same situation where the contracts were in backwardation coincides with the futures being at the bottom. This was repeated in March 2020 and May 2021
The key level for a decline:
1) If price tests 17605 resistance and fails to go long, but consolidates below the level, but bitcoin will continue to be pressured down
2) Also 15585 is a global low. A retest of this support level will trigger a further drop towards 10000
Key level for growth:
1) Lower boundary of the previous range (in this case, resistance) 17605
If the price breaks through this level from below and the bulls manage to consolidate their positions, the price can go towards 25,000
On the hourly chart the price forms a reversal pattern Head and shoulders.
The zone 16400, which plays the dividing zone, is broken from the bottom up. The price continues to rise and forms a pattern, which signals a possible continuation of the movement - a symmetrical triangle.
If the triangle resistance is broken up, I expect a rise:
1) The first target - resistance 17065
2) The second target - resistance 17469 .
3) Third target - liquidity zone 18150
Breakdown of the triangle's lower boundary will take the price towards 16000
Regards to R. Linda!

Rhino market is still the true marketA while ago i have told you fellows and fellowettes that the Rhino humpback market is a way stronger market than the bull market or bear market.
p.s. i also dont make youtube video thumbnails with my mouth open very surprised or raise my eyebrow to you
p.p.s.s. Humpback Rhino season might be in the charts!

FIL rises in value to $4.38.Today's bullish Filecoin price analysis
$4.40 offers the greatest resistance.
FIL/USD support is indicated at $4.18.
According to Filecoin price research, the price of FIL/USD has been moving strongly upward during the past 24 hours. The cost has continued to rise dramatically and has come close to reaching the $4.18 level. The cryptocurrency appears to be moving upwards, but the market is moving in a favorable way. With a trading volume of $95,408,859, the price of FIL has increased by 3.63% during the past 24 hours as of today, November 29, 2022. Hence, having a live market capital of $1,433,268,246 and is ranked #31 in the cryptocurrency ranking.
Analysis of the 4-hour price of Filecoin: Recent developments

Gold Ready for a massive move upI broke down the analysis on yesterday post please check it out, now we got a nice entry with decent risk to reward.
follow me for more update and comment your ideas

Bitcoin Reversal Signal on WEEKLYLooking at the weekly chart we can see that bitcoin is printing a major weekly bullish divergence on the RSI.
There is a good chance that BTC will respond to this and make room for a rally to atleast 28k.
It's possible that we still make lower lows later, but for now I think BTC has a good chance to go up first to play out this weekly divergence

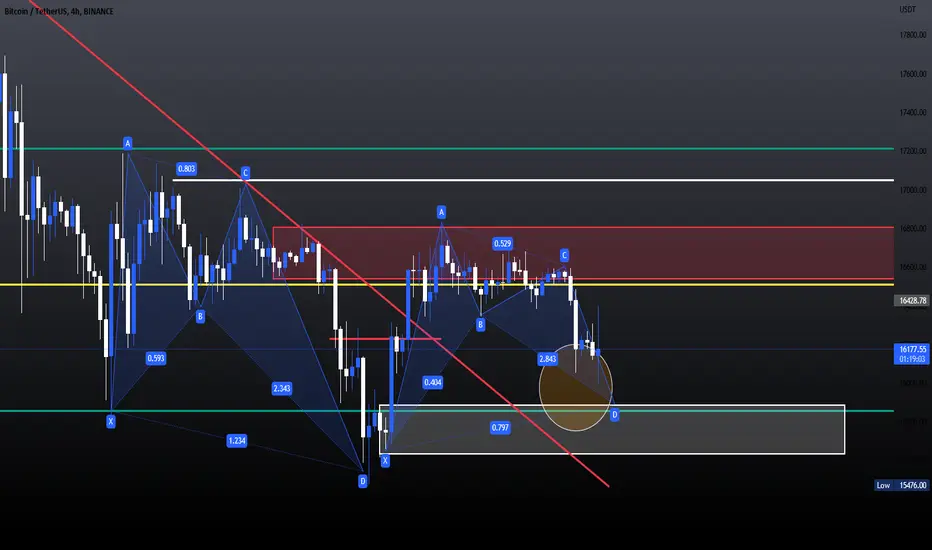
Bitcoin Harmonic Chart PatternBTC has been looking upside for some time now. However, it's been selling off hard now, the bottom support line has held several times, so it will be key that it holds. If BTC falls through the support, I have my sights set at $14,500 to $15,500. Now BTC Bullish targeting these levels.
₿itcoin / Welcome back 🤝 / CommerciumHispanus🌎 "Soros taught me that you have to visualize the situation in months, and whatever it is, the price will be there, don't focus on where it is today."
-Stanley Druckenmiller.
MACRO CONDITIONS
• China: Stimulus, +production, reduces anticovid measures.
• FED goes up, but the pace goes down: Goldman Sachs forecasts 50bp in December, and 25bp in Feb/Mar/May.
• The bet: JP Morgan: “3 more increases and pause at 5%”.
• Bullard from the FED: “5% / 5.25%”.
• European Central Bank: “The risks to the financial stability of the Eurozone increase as the economy heads towards a probable recession, so any reduction in ECB bond holdings will probably be gradual in order to maintain calm in the markets".
• An agreement: The director of the International Monetary Fund, Kristalina Georgieva, asks the central banks to calibrate the rhythm of their interest rate increases to avoid indirect effects in other countries.
CYCLE OF THE CRIPTOMARKET
• Average: 200 periods (Market consensus) very far from price.
• Elliot: suggests development or end of wave 5.
• Oscillators: Multiple Regular and Hidden Bullish Divergences.
• Wyckoff: current market condition suggests SC / SP (See scheme+Coinbase/Bitfinex Volume).
• Dominance: BTC .D is still low, but usually rises in times of depression, you should not focus on overpriced coins vs. Bitcoin.
• This will be an era where education on the preservation of private keys and full control of coins will be promoted (Consequence of FTX/3AC/CELSIUS cases)
The capital feels very comfortable today, according to macro conditions, the crypto market and its cycle, I expect relief for Q2/Q3 2023.
-
To enter the market you must have:
Strategy
market vision
Domain of emotions
capital management
quality tools
👍If this publication has been useful for you, remember to LIKE it and share it
👉🏻Follow me on tradingview, activate notifications in your browser and keep an eye on your email where you will receive my regular updates.
👏🏻If you want to support my work you can make a donation on this same platform.
Thanks for your support!
Greetings to all and good luck!
Ignacio - 🌎 Commercium Hispanus
***Cryptocurrency trading is subject to high market risk. Carry out your operations with caution. I always do my best to choose high quality coins, but I will not be responsible for your trading losses.***
