Market

this is monthly chart and has some important things for usI think everything is clear on the chart,
$ 13.8k and $ 10k are BTC's next supports based on previous price action history.
please tell your opinion in comments,thanks

weekly expiry trade setupmarket setup english
support and resistance for the friday market
call and put option data

Key to unlock the true market structure!!!Have you been struggling with marking market structure? You may have come across many Youtubers who aim to teach the market structure, but in a very wrong manner either by taking fibonacci tool or by discretion. This Video can be an eye opener for you all who are struggling in marking valid market structure.
Market structure is the backbone for every other SMC concepts. Without market structure there will be no orderblocks, breakers etc. Even if you are a beginner in market structure, that is much better since you won't be acquiring the wrong knowledge in the 1st hand.
So are you ready to uncover the real mechanical market structure?
Video will be uploaded on YT at 6:30AM GMT on 25th November 2022
Subscribe our YT channel to never miss any content from Lamda Trading.
Happy Trading!!!
-Team Lamda


monthly expiry levels Novembersupport and resistance for bank nifty and nifty
option data
psychology and etc


DXY next moveas you can see I expect another retest of the bear flag and sup/res. after this we will fall further to the big blue zone to break it

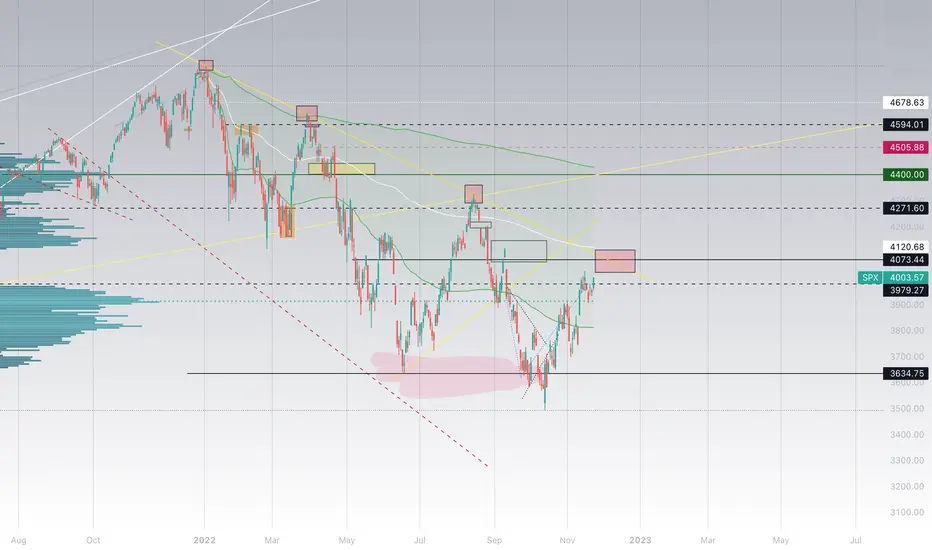
SPX downsideIf this continues to act the way it has been, this rally might be nearly over.. probably safe to start shorting soon on the SPX
I have already begun at 4004 picking up shorts and willingly ready for another 100 points with long term view of being further downside and higher reward to downside than upside currently.
market setup for wednesday market Support and resistance for wednesday market
for bank nifty and nifty levels
psychology
proper supports

market setup for tomorrow marketbank nifty and nifty
resistance and support
call and put data
proper psychology

Market Bias & Top Stock Watches - 11/22/2022Bias: Bullish (grinder).
Top Watches: Long - AEO, BBY, CSIQ, KHC. Short - MDT, ROL, ZM, BX.
Follow my page for daily review/bias of the market and top stock watches for day trading every morning!
Tune in to my livestream every morning from 9:15 - 10:30 ET to see real live trading and get a more thorough review of my top watches!


US30 Short Opportunity - NOVEMBER RECAP
BREAK AND RE-TEST SETUP
Looking for price to RT the broken support level indicated in the yellow zone. Clear support zones on HTFs.
Monitor P.A

USD/JPY Trade setup.Looking at this trade setup on USD/JPY is setting up for a buy opportunity if price continues to show strong buying momentum, pushing the sellers out of the equation. You will notice 4 to 5 touches that price makes from price creating support to price breaking it then re-testing that same area which then becomes resistance. Price was in a phase of consolidation/indecision before creating a minor area of support which adds more confirmations to my confluence for a long opportunity. Watching 140.700 area. Updates on this setup will be posted throughout the trading week or for each upcoming trading sessions.

Tuesday market setup and options data22 nov market setup in english
support and resistance
call and put option data
for nifty and banknifty

EURUSD (retracement) PhaseWaiting on a break and retest for a potential SELL over 200 pips. Please use Proper Risk Management

RLinda ! EURUSD-> Trend change or correction? EURUSD in early November is trying to change the global downtrend. A number of positive fundamental factors contributed to this maneuver. The price confirms the change of the trend and at some point breaks through the resistance of the uptrend channel, indicating to us a more accelerated recovery. But a false break-down of the resistance at 1.02692 is formed.
In the chart, we see a break-down of the base support at 1.02692, which was also the base for the H&S pattern. Ahead is the level of 0.618, from which a pullback might follow, and if the price makes a false-break of the upper boundary of the channel, there is a chance to see the continuation of strengthening of the euro.
But in case of breakdown of the key area and consolidation of the price under the channel resistance, the price may fall to support 0.9926.
Regards R. Linda!


BTC Will Try To Hit 17800 in Next Week BINANCE:BTCUSDT
You Can Long From Now Still 17800 Resistance..
For More Information Follow me
Thanks
maxRECORDS

Market Bias - 11/18/2022Bias: Choppy Bullish.
Top Watches: Long - FL, SPWR, ROST, GPS, JNJ. Short - GTHX.
Follow my page for daily review/bias of the market and top stock watches for day trading every morning!
Tune in to my livestream every morning from 9:15 - 10:30 ET to see real live trading and get a more thorough review of my top watches!

Bico Next PredictionBico breaking the triangle pattern. Mostly it will go 42%down from here. It may be a sudden drop or a very slow with few 15-30min green candles for liquidity sucker.
Wait for the real bottom. SHORT AGAIN!!!

STOCK MARKET ABOUT TO CRASH LIKE 2008!The stock market has seen a move up in the recent days and there is nothing bullish about it. inflation is sitting at 7.5% is not something to be bullish about. The will not pivot anytime soon. If you want to trade in the coming weeks; be prepared! The area to short is either current level or 406.
