Platinum's Quiet Ascent: What Drives Its New Value?Platinum, often operating in the shadow of gold, has recently experienced a significant surge in value, reaching multi-year highs and capturing considerable investor attention. This resurgence is not arbitrary; it stems from a complex interplay of industrial demand, tightening supply, evolving geopolitical dynamics, and a notable shift in investment sentiment. Understanding these underlying forces becomes crucial for investors seeking to decipher the trajectory of this vital industrial precious metal.
A primary catalyst for platinum's price rally is its strong industrial utility, particularly within the automotive sector, where it remains indispensable for catalytic converters. While the rise of battery electric vehicles presents a long-term shift, the robust growth in hybrid vehicle production continues to sustain demand. Critically, the market faces persistent physical deficits, with supply consistently falling short of demand for the past two years, a trend projected to continue into 2025. Mine output struggles due to disruptions in key producing regions, such as South Africa and Zimbabwe, and secondary supply from recycling has proven insufficient to bridge the growing gap.
Geopolitics and strategic investment further amplify platinum's upward trajectory. China has emerged as a pivotal market, with a sharp rebound in demand as consumers increasingly favor platinum for both jewelry and investment amidst record gold prices. This strategic pivot by the world's largest consumer market is reshaping global platinum price discovery, supported by China's initiatives to develop new trading ecosystems and futures contracts. Concurrently, renewed investor confidence is evident in growing inflows into platinum Exchange-Traded Funds (ETFs) and robust physical buying, with anticipated lower borrowing costs also enhancing its appeal.
In essence, platinum's current rally reflects a powerful combination of tightening supply and resilient industrial demand, underscored by strategic shifts in major consumer markets and renewed investor interest. As above-ground stocks gradually deplete and the market anticipates continued deficits, platinum is poised for a sustained period of relevance, offering compelling prospects for those who recognize its multifaceted value proposition.
Market

Weekly $SPY / $SPX Scenarios for June 9–13, 2025 🔮 Weekly AMEX:SPY / SP:SPX Scenarios for June 9–13, 2025 🔮
🌍 Market-Moving News 🌍
📱 Apple WWDC & Tech Momentum
Apple’s annual Worldwide Developers Conference kicks off Monday with CEO Tim Cook set to discuss new products, services, and likely AI initiatives—tracks should watch include impacts on NASDAQ:AAPL and AI-related stocks
🧨 GameStop Eyed for Crypto Pivot
GameStop (a meme-stock darling) reports earnings Tuesday. Markets are watching for updates on its $500M bitcoin investment and potential pivot toward crypto-driven revenue streams
🇨🇳 U.S.–China Trade Talks in London
High-level trade dialogue begins Monday between U.S. and Chinese representatives in London, offering possible relief to trade tensions and providing a lift to risk assets
📉 Key Inflation Data Midweek
Wednesday brings the May CPI release—crucial for assessing tariff-driven inflation trends and likely to influence Fed policy outlook ahead of next month’s meeting
💹 Oil Markets React to Trade Uncertainty
Oil prices are stable to slightly up ahead of trade talks, as Brent holds around $66/barrel—reflecting balanced supply concerns and hopes for easing global tensions
🌐 G7 Summit and Global Policy Risks
G7 finance ministers convene in Canada (50th anniversary), tackling trade strains, Russia–Ukraine, and inflation. Global macrospoilers could trigger renewed volatility
📊 Key Data Releases & Events 📊
📅 Monday, June 9
Apple WWDC begins (CEO keynote)
U.S.–China trade talks start in London
📅 Tuesday, June 10
GameStop Q2 earnings (+ bitcoin update)
NFIB Small Business Index (6:00 AM ET)
📅 Wednesday, June 11
8:30 AM ET – Consumer Price Index (May)
Watch for inflation signal from tariffs.
8:30 AM ET – Core CPI (May)
Core inflation trend under scrutiny.
📅 Thursday, June 12
8:30 AM ET – Producer Price Index (May)
Early check on wholesale inflation
8:30 AM ET – Initial & Continuing Jobless Claims
📅 Friday, June 13
10:00 AM ET – University of Michigan Consumer Sentiment (June, preliminary)
Consumer mood and tariff impact insights
⚠️ Disclaimer:
This is for informational/educational purposes only. Not financial advice. See a licensed advisor before making investing decisions.
📌 #trading #stockmarket #economy #news #trendtao #charting #technicalanalysis

Nightly $SPY / $SPX Scenarios for June 6, 2025 🔮 Nightly AMEX:SPY / SP:SPX Scenarios for June 6, 2025 🔮
🌍 Market-Moving News 🌍
🇺🇸 U.S. Labor Market in Focus
Investors are closely watching the upcoming May employment report, which is expected to show a gain of 125,000 jobs, down from 177,000 in April. The unemployment rate is anticipated to remain steady at 4.2%. These figures will provide insights into the labor market's response to recent economic pressures, including tariff impacts .
🇮🇳 RBI Expected to Cut Rates Amid Low Inflation
The Reserve Bank of India (RBI) is anticipated to announce a 25 basis point cut in the repo rate on June 6, marking the third consecutive reduction. This move aims to support economic growth amid persistent low inflation and global uncertainties .
📊 Key Data Releases 📊
📅 Friday, June 6:
8:30 AM ET – U.S. Employment Report (May):
Analysts expect non-farm payrolls to increase by 125,000, with the unemployment rate holding at 4.2%. Average hourly earnings are projected to rise by 0.3% month-over-month. These figures will be critical in assessing the health of the labor market and potential Federal Reserve policy actions .
3:00 PM ET – U.S. Consumer Credit (April):
The Federal Reserve will release data on consumer credit, with forecasts predicting an increase of $10 billion. This report will shed light on consumer borrowing trends and financial health .
⚠️ Disclaimer:
This information is for educational and informational purposes only and should not be construed as financial advice. Always consult a licensed financial advisor before making investment decisions.
📌 #trading #stockmarket #economy #news #trendtao #charting #technicalanalysis

Hedge funds are unusually bearish and here's why...We have a huge dealing range to short into and still remain bullish, it's basically free money on technical retracement/correction while not ruining the market.
The retailers have been buying since April but there is no institutional orderflow evidenced by no peak above average volume levels.
Technicals will reign supreme here. Trump is either trolling about the rate decrease or he has no idea about chart technicals 😮💨. I bet he's trolling, as he has cabinets on cabinets of market advisors who know fully how correction cycles work.

Nightly $SPY / $SPX Scenarios for June 5, 2025🔮 Nightly AMEX:SPY / SP:SPX Scenarios for June 5, 2025 🔮
🌍 Market-Moving News 🌍
🇺🇸 JOLTS Job Openings Surprise to Upside
U.S. job openings unexpectedly rose to 7.39 million in April—well above forecasts—indicating that labor demand remains robust despite macro headwinds and trade-policy uncertainty
🛢️ OPEC+ Greenlights July Supply Increase
OPEC+ agreed to boost production by 411 K barrels per day starting in July, adding downward pressure to oil prices and weighing on energy equities
📈 Fed’s John Williams Signals Patience
New York Fed President John Williams reiterated that the Fed sees no urgency to cut rates, citing mixed inflation signals and a balanced labor market—keeping investors cautious on rate-cut timing
📊 Key Data Releases 📊
📅 Thursday, June 5:
8:30 AM ET – JOLTS Job Openings (April)
Measures total U.S. job vacancies, a leading indicator of labor-market strength.
10:00 AM ET – OPEC+ Press Conference (Post-Meeting)
Details on production quotas for July, guiding energy market supply expectations.
⚠️ Disclaimer:
This information is for educational and informational purposes only and should not be construed as financial advice. Always consult a licensed financial advisor before making investment decisions.
📌 #trading #stockmarket #economy #news #trendtao #charting #technicalanalysis

Acorn's Smart Money S&P SignalJune 3, 2025 - After another successful S&P signal in May, we have another Bullish signal for the first part of June. If correct, the bullish S&P indicator suggests the S&P will close above 5861.43 on June 19.

Nightly $SPY / $SPX Scenarios for June 4, 2025🔮 Nightly AMEX:SPY / SP:SPX Scenarios for June 4, 2025 🔮
🌍 Market-Moving News 🌍
🌐 Markets Rally on Chinese PMI Surprise
China’s Caixin Manufacturing PMI unexpectedly climbed to 50.8 in May, signaling expansion in smaller export-focused factories. Asian markets jumped, lifting U.S. equity futures as investors recalibrated global growth expectations .
📉 U.S. Factory Orders Remain Soft
April’s U.S. Factory Orders fell 0.4%, underscoring persistent weakness in industrial demand amid elevated input costs and trade uncertainty. Declines in durable-goods orders weighed on industrial stocks .
🏦 Fed’s Bowman to Speak on Economic Outlook
Fed Governor Michelle Bowman is scheduled to deliver remarks at 2:00 PM ET, likely emphasizing caution on future rate moves given mixed data. Markets will watch for any shifts in tone regarding inflation risks and labor-market resilience .
🛢️ Oil Prices Slip on Rising U.S. Inventories
U.S. crude inventories rose by 3.8 million barrels last week, according to API data, pressuring oil prices lower and dragging energy shares down as supply concerns outweighed strong demand signals .
📊 Key Data Releases 📊
📅 Wednesday, June 4:
2:00 PM ET – Fed Governor Michelle Bowman Speaks
Remarks on economic outlook and monetary policy, watched for any hints on the Fed’s next moves.
⚠️ Disclaimer:
This information is for educational and informational purposes only and should not be construed as financial advice. Always consult a licensed financial advisor before making investment decisions.
📌 #trading #stockmarket #economy #news #trendtao #charting #technicalanalysis

Is C3.ai the Quiet Giant of Enterprise AI?C3.ai (AI), an enterprise artificial intelligence software provider, has operated somewhat under the radar despite its foundational role in delivering advanced AI solutions to large organizations. While the broader AI market has seen significant attention on hardware innovators, C3.ai has steadily scaled its platform usage and secured marquee contracts. The company's core strength lies in its sophisticated, patented C3 Agentic AI platform, developed through a multi-billion-dollar investment, which effectively tackles critical business challenges such as AI hallucinations, data security, and multi-format data integration.
A pivotal development underscoring C3.ai's growing influence is the expanded contract with the U.S. Air Force Rapid Sustainment Office (RSO). This agreement significantly increased its ceiling to $450 million through 2029, supporting the widespread deployment of C3.ai's PANDA predictive maintenance platform across the Air Force fleet. This substantial commitment not only provides a robust, long-term revenue stream but also serves as a powerful validation of C3.ai's technology at an unprecedented scale, potentially representing the largest production AI deployment within the U.S. Department of Defense.
Financially, C3.ai demonstrates compelling momentum. The company recently reported record Q4 earnings, with revenue reaching $108.7 million, a 26% year-over-year increase, driven by strong growth in both subscription and engineering services. Strategic alliances with industry giants like Baker Hughes, Microsoft Azure, and Amazon Web Services continue to accelerate new deal flow and expand market access, shortening sales cycles and enhancing overall reach. While profitability remains a near-term focus, C3.ai's solid liquidity and projected revenue growth of 15%-25% for fiscal 2026, coupled with an average analyst price target suggesting significant upside, position it for a compelling ascent in the enterprise AI landscape.

Nightly $SPY / $SPX Scenarios for June 3, 2025 🔮 Nightly AMEX:SPY / SP:SPX Scenarios for June 3, 2025 🔮
🌍 Market-Moving News 🌍
🏭 U.S. Manufacturing Slump Persists
U.S. manufacturing contracted for the third consecutive month in May, with new orders, backlogs, production, and employment all declining. Trade-war disruptions and elevated input costs continue to squeeze factory margins, setting the stage for today’s ISM Manufacturing PMI release
🌐 Global Trade Tensions Weigh on Stocks
Renewed U.S.–China tariff threats sent the S&P 500 lower overnight, as investors fear higher costs for exporters and slower global growth. Futures pointed to another rough open for $SPY/ SP:SPX
📈 China Caixin PMI Exceeds Expectations
China’s May Caixin Manufacturing PMI unexpectedly rose to 50.8, signaling stabilization in export-oriented factories despite ongoing trade uncertainty. That positive surprise may offer some support to Asian equities today
📊 Key Data Releases 📊
📅 Tuesday, June 3:
8:30 AM ET – ISM Manufacturing PMI (May) Measures U.S. factory-sector health; readings below 50 indicate contraction. Today’s survey will confirm if the May downturn persists.
10:00 AM ET – Construction Spending (April) Tracks monthly change in total construction outlays—an important gauge of housing and infrastructure investment trends.
1:00 PM ET – 10-Year Treasury Note Auction Benchmark auction that influences the yield curve. Weak demand or higher yields here can pressure equities, especially growth-oriented sectors.
⚠️ Disclaimer:
This information is for educational and informational purposes only and should not be construed as financial advice. Always consult a licensed financial advisor before making investment decisions.
📌 #trading #stockmarket #economy #news #trendtao #charting #technicalanalysis

XAUUSD 8H: This isn’t balance — it’s broadening distributionAt first glance, it may seem like gold is consolidating. In reality, price is unfolding inside a broadening formation — a structure where highs stretch higher, lows drop deeper, and real direction vanishes behind controlled volatility. This isn’t random noise. It’s Smart Money engineering a distribution phase under the cover of market indecision. And right now, the direction is forming clearly — downward.
The key moment was the failed breakout above 3357 on May 24. Volume spiked 19% above average, but the candle body collapsed. That’s a textbook deviation — a classic liquidity grab. The next candle confirmed the failure by closing back below the level, and no bullish recovery followed. Instead, price printed a lower high around 3305–3315, failing to retest the top. And when price can’t go higher — it usually goes lower.
Confirmation comes from the Anchored VWAP from May 13, which was broken cleanly and never retested. That’s a major shift in control — from buyer to seller. Now price trades below VWAP, with every bullish candle fading and every bearish reaction gaining strength. This is not trend continuation. This is exhaustion.
Volume profile shows the Point of Control between 3297 and 3301 — and price sits well below it. The bulk of liquidity is now overhead. That zone between 3305–3315 is where Smart Money already sold once — and if price returns there, it becomes an ideal re-entry short zone, especially if followed by rejection candles or low-volume pushups.
Targets are clean:
→ 3228 — first liquidity shelf.
→ 3164 — former impulse base.
→ 3084 — if breakdown accelerates.
Everything lines up: deviation, failed breakout, VWAP lost, volume fading, lower highs forming. This isn’t a pause. This is a phase transition — and the market already voted.

Weekly $SPY / $SPX Scenarios for June 2–6, 2025🔮 Weekly AMEX:SPY / SP:SPX Scenarios for June 2–6, 2025 🔮
🌍 Market-Moving News 🌍
🏭 U.S. Manufacturing Slump Ahead of June PMI
Markets are bracing for Tuesday’s ISM Manufacturing PMI (June 3), with economists forecasting a reading below 50.0, signaling continued factory contraction amid slowing global demand and lingering tariff uncertainty.
🛢️ OPEC+ Meeting to Determine Output Path
On Thursday, OPEC+ convenes to decide production levels for July. Expectations center on a modest output cut extension to support prices, with Brent crude trading near $65/bbl ahead of the decision.
💻 Tech Stocks Eye Semiconductor Legislation
Investors are monitoring Congress’s debate over the Chips Act extension. Senate committee hearings this week could accelerate funding for U.S. chip manufacturing—an upside catalyst for NASDAQ:NVDA , NASDAQ:AMD , and $MU.
🌐 China’s Caixin PMI Signals Pivot
China’s Caixin Manufacturing PMI (June 6) is expected to edge above 50.0, indicating a stabilization in smaller export-focused factories. A better-than-expected print could lift global risk sentiment.
🏢 Fed Officials Remain Dovish
Fed Governor Michelle Bowman and New York Fed President John Williams speak this week, reiterating that rate hikes are “on pause.” Their remarks should clarify the Fed’s view on inflation cooling and potential rate cuts late 2025.
📊 Key Data Releases 📊
📅 Monday, June 2:
10:00 AM ET: Factory Orders (April)
Tracks dollar volume of new orders for manufactured goods—an early gauge of industrial demand.
📅 Tuesday, June 3:
8:30 AM ET: ISM Manufacturing PMI (May)
Measures U.S. factory-sector health. A reading below 50 indicates contraction.
10:00 AM ET: Construction Spending (April)
Reports monthly change in total construction outlays—key for housing and infrastructure trends.
1:00 PM ET: 10-Year Treasury Note Auction
Benchmark auction that can shift yield curve and influence $SPY/ SP:SPX positioning.
📅 Wednesday, June 4:
10:00 AM ET: Factory Orders (April)
Dollar volume of new orders for manufactured goods. (Repeat for emphasis on industrial slowdown.)
2:00 PM ET: Fed Governor Michelle Bowman Speaks
Comments on inflation and monetary policy outlook.
📅 Thursday, June 5:
8:30 AM ET: JOLTS Job Openings (April)
Tracks number of unfilled positions—a barometer of labor-market tightness.
10:00 AM ET: OPEC+ Press Conference (Post-Meeting)
Details on production quotas—critical for energy-sector flow.
📅 Friday, June 6:
8:30 AM ET: Nonfarm Payrolls (May)
Monthly change in U.S. employment—core for Fed policy outlook.
8:30 AM ET: Unemployment Rate (May)
Percentage of labor force unemployed—key gauge of labor-market health.
8:30 AM ET: Average Hourly Earnings (May)
Tracks wage trends—important for consumer spending and inflation.
10:00 AM ET: China Caixin Manufacturing PMI (May, preliminary)
Measures health of China’s smaller export-oriented factories.
⚠️ Disclaimer:
This information is for educational and informational purposes only and should not be construed as financial advice. Always consult a licensed financial advisor before making investment decisions.
📌 #trading #stockmarket #economy #news #trendtao #charting #technicalanalysis

MARKET FLOW WITH LIQUIDITY TO ORDER BLOCKS
You Can See How Market Reacting To Major Bigg Time Frame Order Block And Accordingly Making Fake Liquidity In Internal Liquidity Like Fake Structure In Lower Timeframe Fake Trendline Breakout

Nightly $SPY / $SPX Scenarios for May 30, 2025🔮 Nightly AMEX:SPY / SP:SPX Scenarios for May 30, 2025 🔮
🌍 Market-Moving News 🌍
🤝 Debt-Ceiling Deal Advances
The U.S. House passed a bipartisan framework extending the federal borrowing limit through September, easing immediate default fears and lifting risk assets.
📉 Bond Yields Retreat
After surging above 4.6% earlier this week, the 10-year Treasury yield dipped back toward 4.5%, helping equities recover from recent rate-driven pullbacks.
⛽ Oil Inventories Jump
API data showed a 5.2 million-barrel build in U.S. crude stocks last week, sending oil prices lower and weighing on energy sector names.
🚗 Tesla Price Cut Spurs EV Rally
Tesla ( NASDAQ:TSLA ) cut Model 3 prices by 3% in the U.S., igniting a broader EV stock rally as investors priced in renewed demand ahead of summer driving season.
📊 Key Data Releases 📊
📅 Friday, May 30:
8:30 AM ET: Personal Consumption Expenditures (PCE) Price Index for April
Measures core inflation trends—Fed’s preferred gauge of consumer-price pressures.
10:00 AM ET: Pending Home Sales for April
Tracks signed contracts on existing homes; a leading indicator for the housing market.
⚠️ Disclaimer:
This information is for educational and informational purposes only and should not be construed as financial advice. Always consult a licensed financial advisor before making investment decisions.
📌 #trading #stockmarket #economy #news #trendtao #charting #technicalanalysis

Nightly $SPY / $SPX Scenarios for May 29, 2025 🔮 Nightly AMEX:SPY / SP:SPX Scenarios for May 29, 2025 🔮
🌍 Market-Moving News 🌍
🚫 U.S. Trade Court Blocks Tariffs
A federal trade court struck down key sections of President Trump’s steel and aluminum tariffs, sending U.S. stock futures sharply higher as investors anticipate reduced input costs for industrials and manufacturers
🌐 Markets Drift on Lack of Fresh Catalysts
Global equity markets showed muted moves today—stocks dipped and bond yields rose—as traders awaited new drivers of direction, with Nvidia’s ( NASDAQ:NVDA ) mixed earnings doing little to spark a decisive trend
📈 Bond Yields Climb, Pressuring Equities
The U.S. 10-year Treasury yield pushed above 4.6%, its highest in a month, on concerns over federal borrowing and fading rate-cut expectations, dragging the S&P 500 down more than 1% by midday
📊 Key Data Releases 📊
📅 Thursday, May 29:
8:30 AM ET: Advance Q1 GDP
Provides the first estimate of U.S. economic growth in Q1, a critical gauge of recession risk and Fed policy direction.
8:30 AM ET: Personal Income & Spending (April)
Tracks household earnings and outlays, offering insight into consumer resilience amid rising living costs.
⚠️ Disclaimer:
This information is for educational and informational purposes only and should not be construed as financial advice. Always consult a licensed financial advisor before making investment decisions.
📌 #trading #stockmarket #economy #news #trendtao #charting #technicalanalysis

Nightly $SPY / $SPX Scenarios for May 28, 2025🔮 Nightly AMEX:SPY / SP:SPX Scenarios for May 28, 2025 🔮
🌍 Market-Moving News 🌍
🏭 Trump’s Tax Bill Threatens Clean-Energy Boom President Trump’s proposed budget aims to accelerate the expiry of key clean-energy tax credits, jeopardizing over $321 billion in investments and forcing manufacturers to pause expansion—risking a slowdown in solar and wind growth.
🛢️ Oil Flat as OPEC+ Output Hike Looms Brent and WTI held steady amid expectations that OPEC+ will announce a 411K bpd production increase for July at today’s ministerial meeting—balancing tighter U.S. supply and easing trade-tension pressures.
💻 Nvidia Earnings Eye Export-Curbs Impact Ahead of Q1 results, analysts warn U.S. chip-export restrictions to China could shave $5.5 billion from Nvidia’s ( NASDAQ:NVDA ) sales this quarter, testing AI-led growth optimism.
📈 Wall Street Climbs on Tariff Reprieve U.S. futures jumped after Trump delayed planned EU tariffs until July 9, lifting risk appetite across megacaps—Nvidia led gains with a 2.7% pre-market rise.
📊 Key Data Releases 📊
📅 Wednesday, May 28:
9:00 AM ET: Case-Shiller Home Price Index Measures month-over-month changes in home values across 20 major U.S. cities—a key gauge of housing-market trends.
10:00 AM ET: Consumer Confidence Index Tracks consumer sentiment on current business and labor-market conditions and expectations for the next six months.
2:00 PM ET: FOMC Minutes (May 6–7 Meeting) Detailed readout of policymakers’ economic outlook and voting rationale—critically watched for hints on future rate policy.
⚠️ Disclaimer: This information is for educational and informational purposes only and should not be construed as financial advice. Always consult a licensed financial advisor before making investment decisions.
📌 #trading #stockmarket #economy #news #trendtao #charting #technicalanalysis

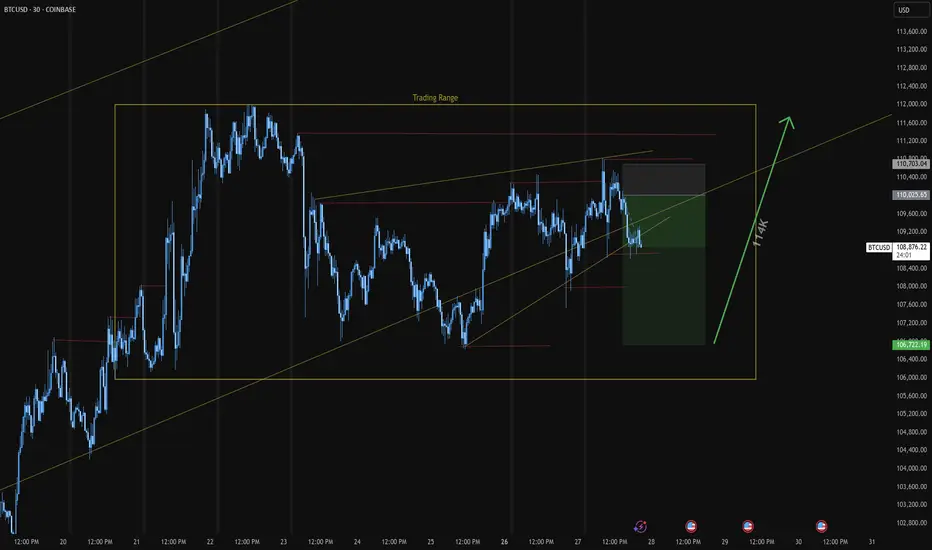
Sells into support zone after fill of wedge channelCurrently in 2 sell orders. Setting my TP at the area shown. Current orders have SL in profits (safety blanket if I'm wrong, I can always re enter). Expecting new highs to be hit for BTC! Long term buy set up will have its TP set at 114K.
Weekly $SPY / $SPX Scenarios for May 27–30, 2025🔮 Weekly AMEX:SPY / SP:SPX Scenarios for May 27–30, 2025 🔮
🌍 Market-Moving News 🌍
🇺🇸 Tax-and-Debt Debate Rattles Markets
Washington’s push to advance a massive tax-cut and spending bill—projected to add $3.8 trillion to an already $36.2 trillion debt—has investors questioning U.S. fiscal discipline. The dollar weakened further, while Treasury yields remain elevated on credit-rating concerns and deficit fears
⚖️ Trump Delays EU Tariffs, Lifts Sentiment
President Trump pushed back 50% tariffs on EU goods from June 1 to July 9 after talks with EU leaders. U.S. futures jumped, and global markets breathed easier despite lingering trade-policy uncertainty
📈 Bond Yields Spike, Then Stabilize
Both 20- and 30-year Treasury yields jumped above 5.1% before easing slightly as auction demand picked up. Fed officials signaled they expect to hold rates steady for the next two meetings, putting a floor under yields
📊 Key Data Releases 📊
📅 Tuesday, May 28:
9:00 AM ET: Case-Shiller Home Price Index
10:00 AM ET: Consumer Confidence (May)
📅 Wednesday, May 29:
8:30 AM ET: Advance Q1 GDP
8:30 AM ET: Personal Income & Spending (April)
📅 Thursday, May 30:
8:30 AM ET: PCE Price Index (April)
10:00 AM ET: Pending Home Sales (April)
⚠️ Disclaimer:
This information is for educational and informational purposes only and should not be construed as financial advice. Always consult a licensed financial advisor before making investment decisions.
📌 #trading #stockmarket #economy #news #trendtao #charting #technicalanalysis

Nightly $SPY / $SPX Scenarios for May 23, 2025 🔮 Nightly AMEX:SPY / SP:SPX Scenarios for May 23, 2025 🔮
🌍 Market-Moving News 🌍
🇬🇧 Global Bond Yields Signal Rising Term Premium
Long-dated government bond yields in the U.S., U.K., and Japan surged, with the U.S. 30-year Treasury yield touching 5.09%, as investors demand higher compensation for locking in funds amid mounting debt and inflation risks
🏗️ Komatsu Sees Tariff Relief
Komatsu’s CEO says a recent U.S.–China trade truce may cut the company’s tariff hit by $140 million, easing cost pressures on its U.S. operations and brightening machinery sector outlook
📉 U.S. Stocks End Flat as Yields Ease
Wall Street closed little changed, with the S&P 500 and Dow finishing flat and the Nasdaq up 0.3%, after Treasury yields retreated slightly following recent spikes
📊 Key Data Releases 📊
📅 Friday, May 23:
🏠 New Home Sales (10:00 AM ET)
Reports the number of newly signed contracts for single-family homes, a direct gauge of housing demand and consumer confidence.
⚠️ Disclaimer:
This information is for educational and informational purposes only and should not be construed as financial advice. Always consult a licensed financial advisor before making investment decisions.
📌 #trading #stockmarket #economy #news #trendtao #charting #technicalanalysis

US10Y Technical Breakdown – Post-Moody’s DowngradeMoody’s has downgraded the US credit rating for the first time since 2011, citing rising debt levels and long-term fiscal challenges.
This move sends a clear warning signal about America’s fiscal path and adds fresh uncertainty to markets already navigating interest rates, inflation, and geopolitical risks.
Focus on the US 10-Year Treasury Yield as the market’s pulse on sovereign risk, inflation expectations, and future borrowing costs. Tracking its medium-term trend will provide crucial clues on market sentiment and risk appetite.
Medium-Term Market Analysis
(6-12 Months)
1. Structural Fiscal Risks
This downgrade highlights growing concerns over the US debt trajectory and political gridlock around spending and debt ceilings.
It’s less about an immediate crisis, more about long-term sustainability.
2. Rising Yields and Market Volatility
The 10-year Treasury yield could move higher, beyond 4.60% we could see rates possibly testing previous resistance of 4.80% (Jan 2025) or 5.00% (Oct 2023).
Higher yields mean increased borrowing costs, which can pressure interest-sensitive sectors like tech and real estate and add volatility to equities.
3. Federal Reserve’s Tough Balancing Act
With bond yields edging up, the Fed faces a dilemma: delaying cuts further could risk inflation climbing higher.
However, this downgrade raises the likelihood that the Fed could keep rates higher for longer than many investors expect.
4. Dollar and Capital Flow Shifts
While a credit downgrade may initially pressure the US dollar, its safe-haven status remains strong.
Global capital could increasingly look to alternatives like emerging markets or gold, leading to shifts in international financial flows.
Perspective
While Moody’s downgrade is a serious signal, it’s important to consider:
1) Political Leverage: Sometimes, rating agencies’ decisions can influence political negotiations. This downgrade may add pressure on US lawmakers to reach fiscal compromises. It’s a tool, not necessarily a verdict.
2) US Dollar & Debt Demand Resilience: Despite concerns, US Treasury securities remain the world’s primary safe asset, with global demand still robust. This could temper yield spikes and limit fallout.
Some could view the downgrade as “priced in” to a degree, given ongoing debt ceiling battles and past political brinkmanship.
If true, markets may react less dramatically than feared.
Watch
US 10-Year Yield: Key indicator to watch for shifts in risk sentiment and inflation expectations.
Equities: Prepare for increased volatility; consider defensive sectors and value plays.
Credit Markets: Monitor for widening spreads as risk aversion grows.
Policy Signals: Fed communications and US political developments will be critical catalysts.
This Moody’s downgrade isn’t just a headline, it’s a medium-term signal to recalibrate risk and position for a more uncertain fiscal backdrop.

Nightly $SPY / $SPX Scenarios for May 22, 2025 🔮 Nightly AMEX:SPY / SP:SPX Scenarios for May 22, 2025 🔮
🌍 Market-Moving News 🌍
📈 Treasury Yields Surge Amid Weak Bond Auction
U.S. Treasury yields continued their upward trajectory, with the 10-year yield nearing 4.6% and the 30-year yield surpassing 5%, marking the highest levels since early 2023. This increase followed a weak $16 billion auction of 20-year bonds, which attracted less investor demand and sold at higher-than-expected yields. Factors contributing to the rise include fading recession fears, persistent inflation concerns, and growing fiscal worries related to potential tax cut extensions.
📉 Stock Market Declines as Tech Stocks Retreat
The stock market experienced significant losses, with the Dow Jones Industrial Average dropping 1.9%, falling below its 200-day moving average. The S&P 500 and Nasdaq fell 1.6% and 1.4%, respectively.
💼 Snowflake ( NYSE:SNOW ) Reports Strong Earnings
Snowflake Inc. reported record quarterly revenue of $1.04 billion, surpassing expectations. Product revenue increased 26% year-over-year to $996.8 million. The company raised its full-year forecast to $4.325 billion, reflecting a 25% year-over-year increase. Despite a GAAP net loss of $430 million, Snowflake posted an adjusted profit of 24 cents per share, exceeding the 21-cent estimate.
📊 Morgan Stanley Turns Bullish on U.S. Stocks
Morgan Stanley has shifted to a bullish stance on U.S. stocks and bonds, raising its outlook due to signs of market stabilization and improving growth conditions. The bank maintains a base target of 6,500 for the S&P 500 by mid-2026, with a bullish scenario projecting 7,200.
📊 Key Data Releases 📊
📅 Thursday, May 22:
8:30 AM ET: Initial Jobless Claims
9:45 AM ET: S&P Global Flash U.S. Services PMI for May
10:00 AM ET: Advance Services Report (First Quarter 2025)
⚠️ Disclaimer:
This information is for educational and informational purposes only and should not be construed as financial advice. Always consult a licensed financial advisor before making investment decisions.
📌 #trading #stockmarket #economy #news #trendtao #charting #technicalanalysis

Nightly $SPY / $SPX Scenarios for May 21, 2025🔮 Nightly AMEX:SPY / SP:SPX Scenarios for May 21, 2025 🔮
🌍 Market-Moving News 🌍
🇺🇸 G7 Finance Ministers Convene Amid Tariff Tensions
Finance ministers from G7 nations are meeting in Banff, Alberta, focusing on restoring global stability and growth. Discussions are expected to address excess manufacturing capacity, non-market economic practices, and financial crimes. Tensions may arise due to recent U.S. tariffs affecting multiple G7 nations.
🛢️ Oil Prices Rise on Geopolitical Concerns
Oil prices increased over 1% following reports that Israel may be preparing a military strike on Iranian nuclear facilities. Such actions could disrupt Middle East oil supplies, particularly if Iran blocks the Strait of Hormuz, a vital passage for crude exports.
📈 Retail Earnings in Focus
Major retailers, including Lowe's ( NYSE:LOW ), Target ( NYSE:TGT ), and TJX Companies ( NYSE:TJX ), are set to report earnings today. Investors will be closely monitoring these reports for insights into consumer spending patterns amid ongoing economic uncertainties.
📊 Key Data Releases 📊
📅 Wednesday, May 21:
10:00 AM ET: State Employment and Unemployment (Monthly) for April 2025
10:30 AM ET: EIA Crude Oil Inventory Report
⚠️ Disclaimer:
This information is for educational and informational purposes only and should not be construed as financial advice. Always consult a licensed financial advisor before making investment decisions.
📌 #trading #stockmarket #economy #news #trendtao #charting #technicalanalysis

Deep Dive into Internet Capital Markets (ICM) - New Narrative Revolution or Speculation?
Internet Capital Markets (ICM) is an emerging concept in crypto, allowing developers and startups to raise capital directly from communities via blockchain and social platforms like X (formerly Twitter). ICM tokenizes ideas, apps, and projects, bypassing traditional intermediaries such as venture capitalists.
Key Concepts & Mechanisms of ICM
ICM is founded on decentralization and social dynamics:
Tokenization & Democratized Capital:
Any user can launch a token representing their idea using platforms like Believe.app, simply by posting on social media with specific tags (e.g., "$TICKER + project name"). This dramatically simplifies fundraising, reducing barriers and costs.
Bonding Curve Pricing:
Initial liquidity and token pricing are set automatically through a bonding curve mechanism, increasing token prices as demand grows.
Trading on DEX:
Tokens typically move to decentralized exchanges (e.g., Meteora) once achieving market caps around $100,000, boosting liquidity and investor accessibility.
By May 2025, over 9,000 tokens have launched, total market capitalization surpassed $350M, with trading volumes reaching $411.6M.
Market Leaders & Success Stories
Believe app:
Dominant ICM platform, with over 3,192 tokens launched and 107,078 traders.
$LAUNCHCOIN:
Native token of Believe app, achieving $250M market cap and 18% growth in 24 hours.
Other notable projects:
$DUPE: Aggregator for product analogues ($63M market cap)
$NOODLE: Crypto analogue of popular game agar.io ($3.1M market cap)
$GOONC, $BUDDY: Highly volatile, speculative tokens popular among traders.
Driving Factors Behind ICM’s Popularity
ICM’s rapid growth is fueled by:
Investment Democratization:
Eliminating geographical and financial barriers.
Speculative Potential:
Opportunities for substantial profits (up to 50,000% ROI in 24 hours).
Social Mechanics & Simplicity:
Viral growth via platforms like X (Twitter).
Solana's Technological Edge:
Low transaction fees ($0.00025) and high transaction speeds (up to 65,000 TPS).
ICM Prospects: Optimism vs Risks
Optimists foresee a revolutionary expansion of capital access, driving Web3 and dApp innovations. Pessimists, however, highlight risks:
Extreme Volatility:
Tokens like $NOODLE dropped 61% in 24 hours.
Regulatory Uncertainty:
Lack of clear regulations, especially in the US, poses significant startup risks.
Speculative Nature:
Critics label ICM as "meme coins under a new name," noting limited intrinsic value in many projects.
Long-term success hinges on sustainable projects emerging and clarity on regulatory frameworks.
Impact on Real World Assets (RWA)
ICM holds potential for reshaping tokenized real-world assets (e.g., real estate, bonds, art):
Positive Impacts:
Lower entry barriers, increased liquidity, and new tokenization models for intellectual property or future revenues.
Current Limitations:
Technological and regulatory constraints currently limit integration of complex RWAs with ICM.
Future Potential:
Over the next 3-5 years, integration could strengthen significantly, contingent upon regulatory clarity.
How to Profit from the ICM Trend?
Key earning strategies include:
Token Creation & Sales:
Launching tokens on platforms like Believe.app, earning up to 50% in trading fees.
Early-stage Investing:
Buying tokens pre-DEX launch, offering high-risk/high-reward potential.
Short-term Trading:
Exploiting token volatility on DEXs for rapid profits.
Participating in Airdrops:
Obtaining free tokens from emerging projects.
Infrastructure Development:
Building analytical tools and integrated wallets, attracting venture funding or tokenization.
Diversification, monitoring social engagement, and avoiding questionable projects are essential risk mitigation strategies.
Future Challenges & Opportunities
ICM faces notable challenges:
Regulation:
Uncertainty and potential legal sanctions remain significant risks.
Market Volatility:
Requires sophisticated analysis and cautious strategies.
Integration with AI:
Leveraging artificial intelligence for trading optimization and market analytics can offer substantial competitive advantages.
Navigating the landscape requires balancing innovation and regulatory compliance for sustainable growth.
Conclusion
Internet Capital Markets represents a revolutionary approach to capital formation, transforming traditional fundraising. Despite impressive growth and potential, careful navigation is needed due to high volatility and regulatory uncertainties. Platforms like Believe.app demonstrate model viability, yet long-term success will depend on achieving a balance between meaningful project value and clear regulatory frameworks.
ICM uniquely blends innovation and speculation. Time will tell whether it becomes foundational within the financial ecosystem or simply another speculative crypto bubble.
Best regards EXCAVO

$3's to $7's catching easiest vertical part of the chart $SYTAGot to let the stock evolve properly, once enough of shortsellers are trapped inside they can only try to manipulate with crash attempts and when even those don't work out they're forced to cover (buy to exit their short position) into vertical push, and those amounts cannot be just clicked out in a second, it takes time to scale in and it takes time to scale out. The only problem is when it's in a bullish uptrend it gets faster and wilder.
Sent out Buy Alert for $3.80 buy expecting vertical and we got it! NASDAQ:SYTA
