EURGBP(UPDATE)There might be a Wyckoff distribution on EURGBP. There is also a huge imbalance area that the price might need to clear off. I'm taking a short trade on EurGbp on the daily since last week.
please take trade based on your own mm, I'm not a financial advisor.
Marketanalysis

A simple analysis for TOTAL3H ello friends
As we can all see, the market is in dire straits with optimistic cows and pessimistic bears
In my opinion, the TOTAL3 index is one of the best tools for better market analysis and understanding.
And based on this analysis that I share with you, I think cows are more likely to win than bears.
Of course, no strong technical signal has been issued yet to complete the correction, but my focus is more on the possibility of changing the trend.
******Appropriate entry points for supports and resistances according to the chart*******
If you like this idea, Please Follow me and do not forget that your likes and comments are very very important .
Thank you dear friends.
Be generous and rich.

SUPER EXTENDED MOMENTUMThis super extended momentum from 2009 low has the potential to reach 5,000 levels.
From 1990 to 2009, there were two major corrections ranging from 50 to 60 percent from its high. And from 2009 to 2020 and up to the present, there have been about 10 to 35 percent correction to form this impulsive wave. Assuming the SPX500 will reach 5,000 levels or 650 percent for its new high from the 2009 low, also expect a 40 to 50 percent correction from its high ranging 3,000 to 2,500 levels.
This kind of my view is based only on price action, price movement and market cycle theories, and what I see based on the history of the chart, it has no other basis or reason for this view to happen or not to happen.

Omicron Fears and Powell’s Hawkish Shift Roil MarketsOmicron Variant Fears
At the end of last week, the Republic of South Africa reported the discovery of a new coronavirus variant, named omicron. Daily confirmed coronavirus infections in South Africa have increased dramatically in recent days. Initial reports on the omicron variant suggested that the variant may be more inherently infectious than other virus variants, but the greatest concern was raised over its potential ability to infect vaccinated people due to the very large number of observed mutations in its binding system.
Many countries quickly moved to shut down travel from South Africa and other nearby African nations, but it was soon discovered that the virus is present in several countries, some of whom have observed community spread. While speedy measures have been taken to try to defend against the entry of the omicron variant, recent experience suggests it will likely be impossible to achieve.
This bad news arrived against a backdrop of increasing rates of coronavirus infections in Europe, where despite high levels of vaccination, daily new cases in some countries are reaching their highest ever levels. Some countries have brought back lockdown-style restrictions to combat rising infections.
Markets now face the question – how bad will omicron be? A South African governmental health advisor stated that the symptoms are typically mild, although this is far from certain, as South Africa has a low level of vaccination, so its data is hard to mine. The vaccines most used in South Africa also tend to have shown the lowest rates of clinical success in trials compared to other vaccine types.
The CEO of Moderna stated that he has no doubt that existing vaccines will have notably lower levels of success against preventing omicron infection.
Powell Hints on Earlier Taper, Inflation
In testimony before Congress yesterday, the Chair of the Federal Reserve Jerome Powell said that if the omicron variant does not have a strong negative impact, it would be wise to taper more quickly than has been planned. Powell also dropped his description of recent inflation as “transitory.” This is clear evidence that Powell’s monetary policy has been recalibrated to a more hawkish tilt, meaning that the Federal Reserve is likely to stop propping up the market with asset purchases and finally hike rates for the first time in years sooner than had been expected.
How Did the Markets React?
Both the initial news about the discovery of the omicron variant, the comments from Moderna’s CEO, and Powell’s testimony roiled markets. All sent stock markets lower. The Forex market reacted in a more mixed way. We have seen more volatility and more risk-off price movements, but the movements are neither very strong nor uniform across asset classes. The US dollar has weakened, despite the Fed’s seeming hawkish tilt, which is strange as it should also be acting as a safe haven.
What Does This Mean for Traders?
Traders should be aware that fear levels are rising, but markets are far from full-on risk-off panic. The jury is still out on the economic impact of omicron. What has been notable, is that we began to see price movements that were reminiscent of the early days of the coronavirus panic of March 2020: plunging stock and commodity markets, with commodity currencies falling, and the Japanese yen and euro rising as safe havens.
If the omicron variant proves strongly evasive to vaccines and sharply increases the number of seriously ill requiring hospital treatment, we will probably see a repeat of what happened in the markets in March and April 2020, as there will likely be more lockdowns and disruptions to trade. If this were to happen, it would also call the more hawkish monetary policies that many central banks are inching towards into question, creating further confusion.
If omicron turns out to be a lot of fuss about nothing, and it has little economic impact, it may be that risk sentiment bounces back and this is just a small dip in a longer-term risk off trend that has been running since the summer of 2020.
Traders will be well advised to lighten their positions, consider taking profits, and to trade cautiously and with small position sizes until the omicron outlook becomes clearer. Once that happens, there will probably be money to be made from following the trend.

MDTUSDT is moving in a channel MDTUSDT is moving in a channel retested his support and going to check his resistance.
1-Always use stop-loss.
2-Always do your own research also.

ETHUSD | Ethereum 1H Analysis - ETHParking most of my ETH into USDC as I'm seeing short term downside of about 50% nominal going into the New Year.. This should close out the Daily timeframe correction, which started in mid-May.. Expecting us to see ATH again and beyond after the sell-off is completed.. Seeing the same thing for BTC so perhaps now is a good time to try out ETH3S and BTC3S.. The minimum play is to park in USDC or USDT to ride out the downside.. USD is set to gain some strength during this time so this will also work out in our favour.

XRP EXIT STRATEGY 21/22 BULLRUN Afternoon people,
I'd just like to say firstly thank you for all the support and for taking the time out of your day to consume my content. It's most appreciated.
Diving right into the charts here we are looking at the weekly chart for XRP. As we can see for quite some time we have been pretty much moving sideways, since we broke out and retested the 3 year trendline that had formed from the previous ATH. Price has been coiling up and the longer this goes on for the more violent the breakout will be. Going by the mechanics of the market cycle for XRP, I would be anticipating a parabolic move to the upside, in line with the majority of the market during this bull run. Since price has moved above the trendline it broke out of, an entire year has nearly elapsed and price is still nowhere near its previous ATH. Is XRP dead? hah far from it. The infants in this market and those who are impatient/emotional have lost faith in XRP. Not that you ever needed faith anyway, if you truly know what you're invested in. You know that time is on your side and all you have to do is position yourself the right way and wait. Historically in bullruns XRP moves last and it moves violently. Only once BTC hits it's top and begins to retrace, will XRP begin to move. Patience is key.
What we need to understand about XRP is that it is positioned to stand as the beating heart in the new financial system. When you think of Ripple you should think of Amazon. Ripple are going after all the money and will be to finance what Amazon is to everything else (lel). It is quite clear from looking at the charts, not even considering the fundamentals that have been appearing throughout this cycle. That XRP is heavily being manipulated. The SEC who's main function is to protect investors, have actually achieved the antithesis of this. This is all a show though, the SEC have been called in to stall the price of XRP whilst behind the scenes banks & financial institutions prepare. Soon the world will never be the same again and the new financial system will be here.
The case for XRP this bull run is a simple one and it is all programmed into the charts. The charts never lie and until they do, I will follow my exit strategy which I will include at the bottom. We know (as illustrated in the chart) that after XRP hits its ATH it drops 95/97% and finds its bottom after this percentage drop. This has happened twice in the past, of course past doesn't guarantee future performance. But until I see the charts show me something else, this is what I will follow. Keep this percentage drop in mind because it further strengthens the case for a 3 digit XRP this cycle that I will present later. (I know, I know bare with me).
Once the bottom has formed on XRP we can draw a fib from the ATH to the bottom to predict where price is going next. If you look at the 2017 run, once the bottom was formed you can lay out the fib and this presents price targets. XRP found resistance and support at the 1.272 & 1.618 before finishing its run with a move to the 2.272 (call it $3). After the ATH was hit there was a drop of around 96% to the bottom. At which point the fibs can be thrown on the chart again to plot future targets in the next bull phase of the cycle.
As it stands XRP still has it's previous ATH to overcome but once we see a close above this level, I expect a move to the 1.272 ($8), 1.618 ($27) & 2.272 ($242) during this bull phase. I initially believed that we would top out at $27 dollars and go no further, but upon further looking in to the charts. I believe that it's not only possible we hit the 2.272 as the top. It's highly likely. The factor which causes XRP to go parabolic to the 2.272 will be the result of the SEC case. I believe until we have a resolution we will be playing around the 1.272 and 1.618 fibs, but once we get the news. I expect a powerful move to mark the end of the entire bull market. Most coins at this point will already be in decline.
But doesn't a $242 XRP mean the market cap would be around 12.5Trillion. Isn't that impossible? Well market cap doesn't mean the same as it does in stocks for a start so using this metric as a limit to how far a coin can go is redundant. Plus it's very simple. Once the case is settled (at the height of the bull run) XRP will receive the clarity it so desperately needs. Once it gets this status, not only will all of Ripples partners go live with XRP, new investors will flood in and also XRP aside from BTC and ETH will be the only crypto in the space with clear definition. It seems a lot of money is about to pour into XRP and leave the disbelievers wondering how they didn't see it happen. They'll say we got lucky, we know luck has nothing to do with it. I expect us to get some sort of case settlement around the deadline date of 14th Jan. Worst case scenario is that we don't get the deadline and they push it back further. If this happens I expect XRP to stay above the 1.272 @ around $8. I call this one the launch pad. We will wait patiently to see how this plays out but know that as soon as the case is settled, XRP is off. Many will jump on the train too late, I have positioned myself in a way where I wont have to chase the market. I wait and let the market come to me. No emotions.
To further strengthen the case that XRP is going to $242. referring back to previous drops from ATHs. XRP bottoms out around the 1.272. It never revisits its previous ATH at any point whilst finding its bottom. Has illustrated on the chart. You can see that the only price point that allows XRP to fall by around 97%, has the 1.272 as the bear market bottom and still bottom out nowhere near the previous ATH @ around $3 is if we top at around 2.272 ($242). All the other fib extensions could be the top but it would mean either XRP falls below the previous ATH for the first time ever in its history. Or the drop isn't as deep as it has previously been in the last two cycles. These are possibilities to be considered and therefore my exit strategy accounts for this. For this to happen however, XRP would have to do something it has never done in any cycle ever. Again until the charts start lying, I will follow what they show me.
My exit strategy using 10K XRP example:
Split holding 50/50
Strategy 1
5K XRP
10% @ $4
20% @ $8
40% @ $13
30% @ $27
Strategy 2
5K XRP
1250 @ $10
1250 @ $15
1250 @ $20
1250 @ $25
Strategy 3
Upon a retrace from $27 (1.618) to $8 (1.272) I will buy back 50% of my original holding. This will have a sell target of $240 (2.272)
Bitcoin = 233K TOP
XRP = $242 TOP
So to clarify this is for educational purposes only. Don't forget to take profits and thanks again. Happy trading :)
Yours truly,
Chartster

Crytpo Total Market CapThis is the current projection in this current time/space. Momentum is the Key

Weekend Analysis + Market Re-cap What's good traders hope you all had a great week in this video I will be breaking down some of the trades that I took and now closed, some trades that I'm still in, and some trades that I am still waiting for development to occur on before entering.
Looking at a few trades that I am currently in;
-GBPCHF
-GBPAUD
-EURUSD
Trades that I took a loss and break even on in;
Loss - EURAUD
Break Even - USDJPY
Trades Currently Looking at with potential for next week;
LONG
-AUDJPY
-AUDUSD
-CHFJPY
-NZDJPY
-USDJPY
SHORT
-EURAUD
Any questions please do let me know down below or in DMs
Have a great weekend

What is happening on BITCOIN?after the breakout of 65K, the greed increased in the market with new ATH. 65K was 1.6 XA and an important Fibo level. but why the momentum of BITCOIN didn't increase and rejected from 69K. it was because of the 2.24 BC Fibo level. Since Bitcoin is a butterfly, 69K could be a massive resistance and could crash to 25K. but the situation of the pitchforks makes hope that BITCOIN transform into a crab and surges to 2.6 and maybe 3.6 FIBO levels.

Could we possibly revisit $2800 Hello friends. Today we saw a small correction which put us back into the ascending triangle; while a week ago we broke out of this pattern and were on the go to $5750 which would also correspond with fib level 1.618. I believe this could be the final shakeout and we can go as low as $3600, and retest the up-trending channel. My realistic prediction for this week is that we can retest previous ATH at $4200, where 50 EMA can provide support, and bounce back up. The market is still very strong despite the noise, and the RSI remains below overbought line. Hope this help, and thanks for reading.

$COTI TO $1 SOON!!!!!!!!With a good understanding of its use case and a market cap under $600M. Coti's potentials have been undermined. It has formed the Cup and handle bullish continuation pattern with over 46% in view. it's riding to break and retest resistance while on the bulls to $1+.
My view what's yours?.... NFA and DYOR📍

#TSLA Tesla - What's next?Elon Musk is looking to sell a portion of his Tesla stock. So what will the stock look like for the upcoming days - months.
I took the prior fractal and matched it with the current market price. TSLA gets back into the channel it has been in since early 2020.
Yahoo Finance Article: finance.yahoo.com
CNBC Article: www.cnbc.com
What are your thoughts? Comment below, hit the like and follow me. Thank you!
Disclosure: This is just my opinion and not any type of financial advice. I enjoy charting and discussing technical analysis . Don't trade based on my advice. Do your own research! #cryptopickk #tesla #tsla #bitcoin #doge

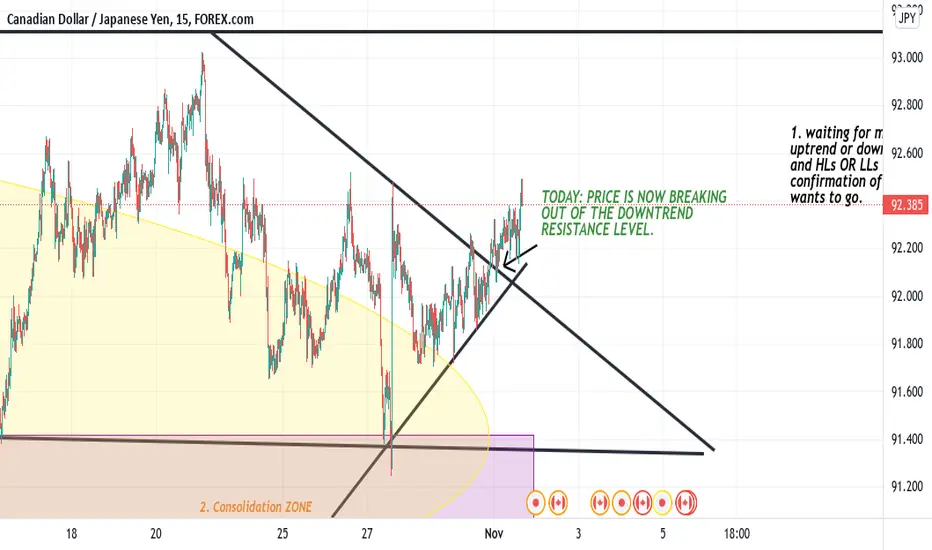
MY Practice Analyzation On CAD/JPY!! Going long. 2. I think the market will continue in a uptrend because on the monthly chart it showed bullish agression that broke out of the resistance level. price is still on the left side of uptrending line on multiple time frames.
CAD/JPY Short at market open4562 free pips for the trade of the year. The market has has completed the weekly correction structure and is now ready for downside. fundamentally we are bearish for both currencies but expecting CAD to be weaker since JPY is as it lows already

ABB Price Movement or Trading Ideas ABB Stock Daily Price Movement Structure with Chart Keep eye on that it may be consolidate 23 days near given levels but when it will give breakout we can catch the good movement in intraday.

Market Re-cap & AnalysisHere i give you a break down of 4 trades that I took during last week
-EURAUD / Long
-EURUSD / Long
-GBPUSD / Long
and EURJPY / Long that i am currently still in
Currently down NET 0.5% for the week so not to bad, hoping the market can give us some entries for next week as there are a few pairs that look great to trade
List for next week is
USDCAD
XXX?JPY / Most of the JPY pairs are looking great for longs just need a bit more development in the market. So lets wait and see what the markets have in store for us next week.
Have a great weekend and a great trading week for next week
Any questions feel free to ask and i will get back to you as soon as i can
Take Care
Ben

GBP/USD Analysis - Simple Supply & DemandLooking at GBP/USD on the 4H timeframe, it's evident that its been producing bearish structure since Feb.
I have drawn out both a Supply and Demand zone on my chart as I believe now price has tapped into supply we will now see the next impulse down.
I would like to see price come down to the previous level of demand, but before then and before I place a short position on this pair i'll need more confirmation.
This will include a break below the neckline drawn out in yellow, once that's happened I'll look for confirmation of a continuation in the bearish impulse down.
This will be done by looking at the charts through lower timeframes and waiting for confirmation via candlestick patterns.

BTC.D AnalysisBTC.D Analysis. :BTC:
**some notes that don't fit on the chart: **
bottoming before blow off top has taken longer this run. (end of bottoming was breach of 20ma)
- arrows and patterns drawn are a little edited as I don't think we will see the same % moves but similar areas of resistances/supports. 📈
- yes I do believe BTC.D will fall under 35% (All time bottom) as now there are more alts/stablecoins. :USDT: :ETH:
- as we can see from the chart, we get 2 weeks of alt catch up before the blow off top weeks. Catch some good ALTs just before. Ride the waves!🌊
- timelines will most likely change but this gives us a good idea as to the type of price action we will see. BTC up, alts catch up later. repeat 🎮
- top still feels like it should be release of the ETFs so will monitor for the announcement of that date. That will give us another idea of blow off top timeline ⏲️

GBPAUDTaken a Long trade on GBPAUD on the 4H TF. lets see how it goes.
I'm not a financial advisor, please take trade based on your own mm. take care guys

TEZOS UP 20% WITHIN DAYSTezos has break a resistance of descending channel perfectly matching a handle in a cup and handle formation (only broken by the China crackdown news just to re-enter the channel). Already confirmed WAVES 1,2,3 of an 12345 ELLIOT WAVE with retracements and corrections matching the expected FIB levels.
A minor correction is expected ( WAVE 4) to be followed by the final ascending wave 5.. (100% fib)
OPEN POSITION @ 7.75
STOP LOSSES @ 6.85
TAKE PROFITE @ 9.00
We ve been tracking this coin a long time and it is one of the most promising coins out there due to technicalities and marketing.
This is not a financial advise, just my oppinion

EURJPYOn the EURJPY, 4H tf, there is an OB on the left where by the market just made a downfall. It may or may not hold, but will wait and see how the market will react to the OB.
I'm not a financial advisor, I'm just learning like everybody else. Take risk based on your own MM, as every strategy is not perfect.
If you have any other idea based on EURJPY trade, do drop a comment below. It's great to have a discussion on how market price moves.

AUDJPYAs a SMC trader/learner, I've spotted an OB for a short trade on AUDJPY, 4h tf. Lets see how the market will react to the OB, will be risking just 1% for this trade.
I'm not a financial advisor please take risk based on your own mm.
If you have any idea based on AUDJPY, do drop a comment and let's discuss it. Sharing ideas is a great way to broaden our way of seeing the market.
