Don’t Panic — It’s Just a Healthy Crypto Correction!While the crypto market has seen some red this week, the bigger picture remains intact. Let’s zoom out and make sense of the current correction.
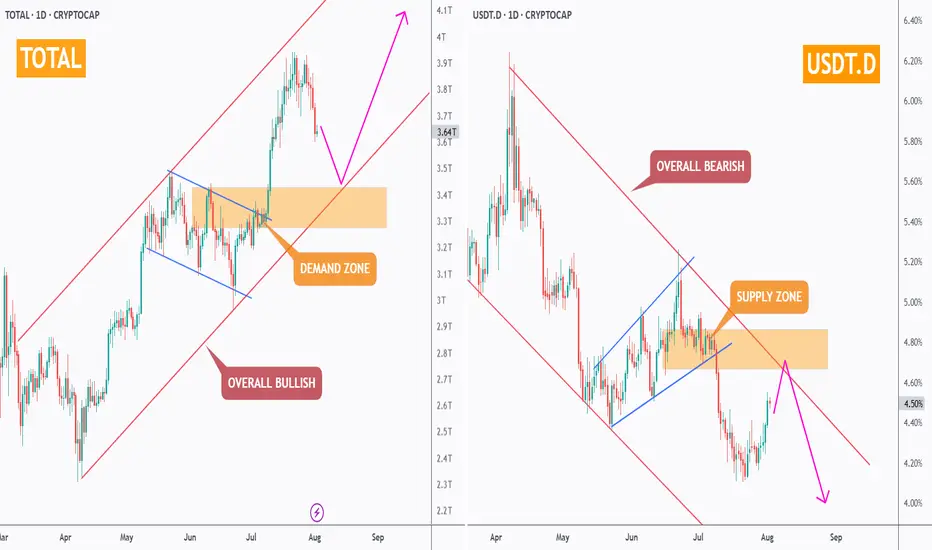
🔸 TOTAL Market Cap (left chart)
The structure remains overall bullish, trading inside the red rising channel.
After a solid rally, the market is currently pulling back toward a strong demand zone – perfectly aligned with the lower trendline. This area is likely to act as a major support, from which the next bullish impulse could kick off.
🔸 USDT Dominance (right chart)
USDT.D remains overall bearish, trading inside the red falling channel.
It’s currently pushing higher toward a well-defined supply zone, which also intersects with the upper red trendline. As long as this area holds, we expect sellers to take over again — giving altcoins the space they need to bounce back.
📌 In simple terms:
The market is in a healthy correction. Don’t let short-term dips shake your long-term view. The trend is still your friend.
➡️ As always, speak with your financial advisor and do your own research before making any investment decisions.
📚 Always follow your trading plan => including entry, risk management, and trade execution.
Good luck!
All strategies are good, if managed properly.
~ Richard Nasr
Marketcap
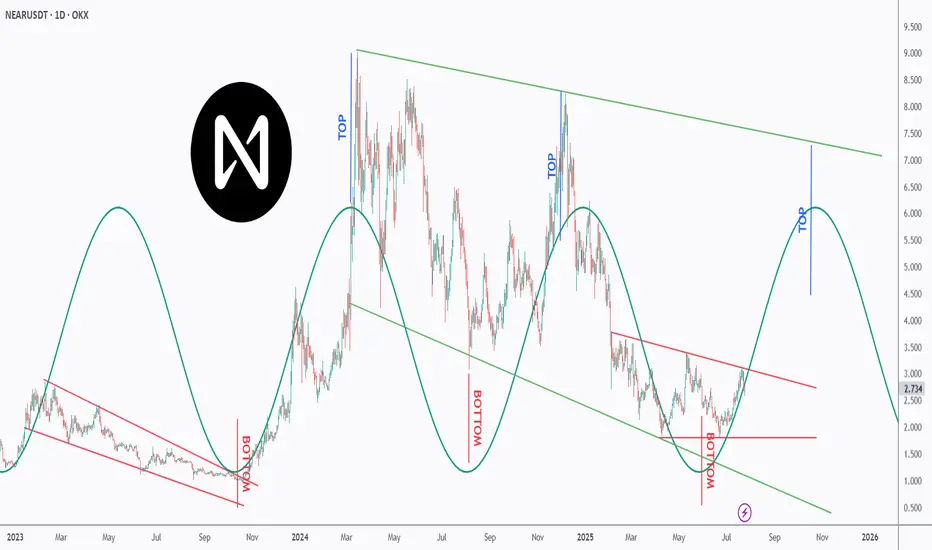
Is NEAR NEARing Its Next Explosion? Watch This Perfect Pattern!NEAR is dancing to a powerful rhythm — and it’s all in the cycles 🔁
This chart uncovers a repeating top-bottom cycle that has held since early 2023, with precise peaks and valleys emerging every few months 📉📈.
After bouncing off a major bottom at ~$2, NEAR is now approaching the mid-line of the descending red channel, suggesting a potential trend reversal is underway 🔄.
Each previous “BOTTOM” aligned with strong recovery waves 🚀, while the projected “TOP” now points toward the $6–7 zone — aligning perfectly with the upper green trendline resistance 🎯.
If the pattern continues, we could be looking at another macro push before year-end 2025 📆.
📊 Will NEAR ride this wave to new local highs — or is it just another lower high in the making? Either way, the rhythm of this chart is too clean to ignore.
📚 Always follow your trading plan regarding entry, risk management, and trade management.
Good luck!
All Strategies Are Good; If Managed Properly!
~Richard Nasr
Solana (SOL/USDT) 4H Reverse H&S PatternSolana (SOL/USDT) – 4H Market Outlook | July 1, 2025
Introduction
SOL has formed a reverse head and shoulders pattern, followed by a clean breakout above resistance. While the lower time frame is bullish, the higher time frame remains bearish, creating a short-term opportunity within a broader downtrend.
Context 1: Key Zones
Supply Zone: 176 – 187
Demand Zone: 126 – 143
Psychological Levels: 140 and 160
Context 2: Technical Structure
Pattern: Reverse Head & Shoulders
Breakout: Confirmed above neckline/resistance
FVGs:
One below price (within demand)
One above price (potential target)
Golden Pocket: Sits just above lower FVG and inside demand — strong confluence support
Context 3: Volume Insight
OBV Indicator: Shows a sudden volume spike, adding strength to the breakout and the bullish pattern confirmation.
Bullish Scenario
Price pulls back into the golden pocket + FVG + demand zone
Finds support → bounces to form higher low
Second leg of the move breaks swing high → targets upper FVG and 160 psychological level
Bearish Scenario
Price breaks back below demand zone and invalidates the golden pocket
Fails to hold structure → reverts to macro bearish trend
Potential retest of previous swing low below 126
Summary
SOL is showing bullish momentum on the 4H after completing a reversal pattern and spiking in volume. A pullback into the demand zone confluence may offer a strong long setup — but failure to hold could revalidate the higher timeframe downtrend.

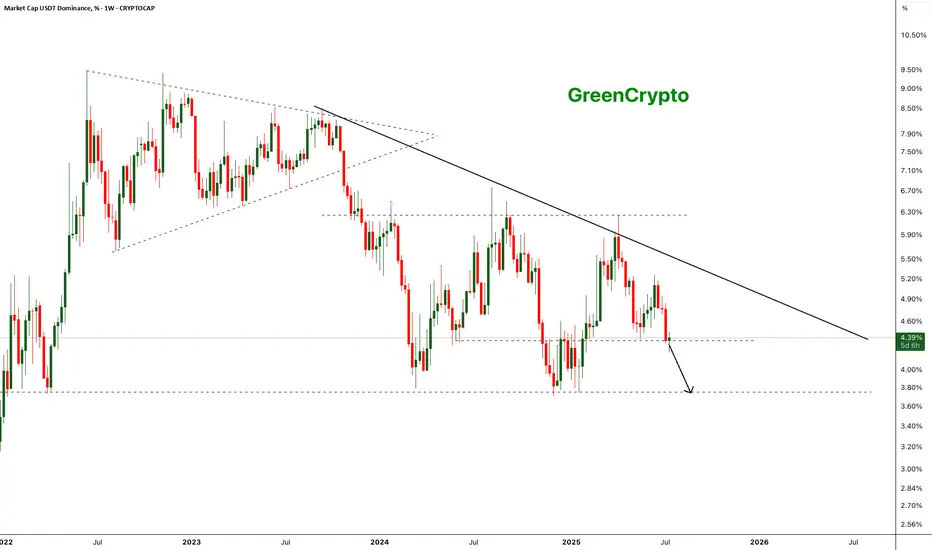
Bearish Breakdown in USDT Dominance - Altseason Loading?The chart shows a clear long-term descending trendline acting as resistance since mid-2023. After multiple failed attempts to break this trendline, USDT dominance has broken below a key horizontal support around ~4.35% on strong bearish momentum.
- Weekly close below the ~4.35% horizontal support.
Next key support zone: ~3.65–3.70% (marked by previous 2023 lows).
- Strong bearish engulfing candle confirming breakdown.
- Bearish continuation expected if dominance remains below 4.35%.
Further drop of the usdt dominance will start the altseason
Cheers
GreenCrypto
A bit of profit taking on NVDA and then up again?NASDAQ:NVDA is the most talked about and everyone is capitalizing on that. Let's take a look.
NASDAQ:NVDA
Let us know what you think in the comments below.
Thank you.
75.2% of retail investor accounts lose money when trading CFDs with this provider. You should consider whether you understand how CFDs work and whether you can afford to take the high risk of losing your money. Past performance is not necessarily indicative of future results. The value of investments may fall as well as rise and the investor may not get back the amount initially invested. This content is not intended for nor applicable to residents of the UK. Cryptocurrency CFDs and spread bets are restricted in the UK for all retail clients.

TOTALCAP — The Next Trillion Crypto Move: Are You Ready?When people analyse the crypto market, they often default to Bitcoin and for good reason. It’s the one and only, the king. But sometimes, to see the forest instead of just the tree, you need to zoom out and study the broader picture.
That’s where the Crypto Total Market Cap (TOTALCAP) chart comes in. It’s essentially the mirror of Bitcoin, but it offers powerful macro insight — not just price, but scale. Looking at trillions instead of dollars changes how you frame support, resistance, and overall sentiment. Let’s dive in.
🧠 Why TOTALCAP Matters
TOTALCAP aggregates the value of every coin and token — the complete valuation of the entire crypto industry.
And while it often moves in sync with Bitcoin, it carries a different weight.
Shows the “big picture” of institutional and retail money flow
Offers clearly defined round-number zones (Trillions) as psychological S/R
Removes coin-specific anomalies and focuses on collective momentum
In bull and bear markets, these trillion-dollar thresholds act like major checkpoints. Watching how TOTALCAP interacts with these levels can give early signals that BTC or alts alone can’t.
Historical Key Levels & Structure
Let’s break it down by macro phases:
✅ November 2021 — Peak of Last Bull Market:
TOTALCAP peaked exactly at $3 Trillion.
This level acted as a ceiling — once hit, the market reversed sharply.
This marked the top of the 5-wave impulsive move (Elliott Wave theory).
📉 November 2022 — Bear Market Bottom:
TOTALCAP dropped below $1 Trillion, bottoming at $727 Billion.
This was almost a 0.786 fib retracement from peak — similar to BTC’s historical retracements.
The $1T mark was retested as resistance before being reclaimed as support.
📈 2023–2025 — The Bull Awakens:
$1 Trillion flipped into solid support throughout 2023.
A clear sign the macro market structure had shifted bullish.
Once $2T was breached, things moved fast.
🚀 Current State:
The market surged above the previous $3T ceiling.
TOTALCAP has hit a new ATH: $3.73 Trillion
Now, the question is: Is this the start of a new leg higher, or a bull trap before a correction?
🔍 Fibonacci Confluences — Why $3.7T Was Key
The sharp rejection at $3.7T wasn’t random. It aligns with:
1.0 Trend-Based Fib Extension: From 91.24B → 3T high → 727B low = 1.0 = 3.65T ✅ precise hit
1.272 Fib Extension of the macro move
Upper Pitchfork Resistance
Channel Top Rejection
→ All signals converged to mark that level as major resistance
🌀 Elliott Wave Macro Count
Looking at the weekly timeframe, we can see a clear impulsive 5-wave movement from the 2022 lows:
Wave 1: $727B → $1.26T
Wave 2: Correction to $975B ($1T) (support confirmed)
Wave 3: Massive rally toward $2.72T
Wave 4: Pullback toward $1.69T (VWAP retest)
Wave 5: $3.73T ATH
What does this imply?
According to classical Elliott Wave theory, after a full 5-wave move, the market tends to enter an corrective phase.
🔍 Some key levels to watch:
$3T: Historical S/R (was the 2021 top, now acting as a key level)
$2.31T: Recent swing low
$2T: Psychological and structural support
📌 Zone of Interest for Longs: $2.31T–$2T
This zone holds:
Previous consolidation zone from mid-2024
Fib retracement confluence
Likely forming Wave C bottom if this is a full ABC
🎯 Upside Targets — What If We Continue Higher?
Looking ahead:
🔸 1.618–1.666 Fib Extension = $4.42T–$4.53T
🔸 1.618 TBFE from previous cycle = ~$5.45T
📌 Rounded Targets: $4.5T, $5T and $5.5T
These are the next likely macro cycle targets — but only after a healthy correction and consolidation.
☀️ Macro Context & Summer Seasonality
Historically, summer tends to be a weaker period:
Lower volume
Institutional rebalancing
Geopolitical and macroeconomic uncertainty
📚 Educational Insight: TOTALCAP as a Tool
Treat TOTALCAP like the S&P500 of crypto.
Use round trillions as psychological levels: 1T, 2T, 3T, etc.
Always check if BTC’s price is aligned with where TOTALCAP is on the macro structure
Helps judge market strength even when BTC dominance is shifting
It’s especially useful when altcoins pump or dump out of sync with BTC — you can use TOTALCAP to track the real flow of money.
💡 Final Thoughts
We are likely in a corrective phase after a complete 5-wave cycle.
The area between $2.31T and $2T offers high-probability long entries
Watching how TOTALCAP reacts to these levels will help us anticipate the broader market’s next move
Summer slowdown could mean chop — but this also creates opportunities
💬 Let me know your thoughts: Are we entering a deeper correction? Or will TOTALCAP surprise us with a new leg higher?
Don’t forget to zoom out. The charts always tell the story.
_________________________________
💬 If you found this helpful, drop a like and comment!
Want breakdowns of other charts? Leave your requests below.

Breakdown Alert: Crypto Market Cap Tests Major Demand ZoneThe total crypto market cap is testing a key support zone around $3.23T. This area has acted as a demand zone in the past, and now price is hovering right above it.
The current structure suggests a possible breakdown–retest–continuation setup. If price retests this zone from below and fails to reclaim it, further downside toward $3.0T could be likely.
This idea is based on price action and structure only — no indicators used.
❗ This is a personal analysis for educational purposes only. Not financial advice.
Feel free to share your thoughts or technical perspective in the comments

DOGE|Bearish Triangle Formation On30-Min Chart-Breakdown Ahead?📉 DOGE Bearish Triangle Breakdown | 30-Min Chart
This chart highlights a classic *bearish triangle formation* in DOGE's market cap on the 30-minute timeframe. The pattern shows a series of lower highs with horizontal support around the 32.45B zone.
🔍 Key Observations:
- Pattern: Bearish Triangle
- Resistance: ~34.7B
- Support Zone: ~32.45B
- Target Zone (Post-Breakdown): ~31.3B
A breakdown below the support level could signal further downside movement. However, confirmation is key — traders should watch for volume and candle close below support.
🕒 Timeframe: 30-Minute Chart
📆 Analysis Date: May 29, 2025
---
⚠ *Disclaimer:*
This analysis is shared purely for *educational purposes* and does not constitute financial advice. Please do your own research and risk management before making any trading decisions.

Bitcoin Total Market Cap Update – Strategic Scenarios AheadAs of May 8, 2025, the total cryptocurrency market capitalization stands at approximately \$3.012 trillion, reflecting a 2.17% increase from the previous day . Bitcoin's market cap is around \$1.962 trillion, with a current price of \$98,798.11 .
Given these figures, we are considering the following potential scenarios for the crypto market:
---
1. Break Above \$3T and Hold ✅ (30% Probability)
* The market breaks through the \$3 trillion level.
* Retests it as support.
* Continues the bullish momentum from there.
---
2. Rejection and Consolidation 🔁 (50% Probability)
* Price gets rejected at \$3T.
* Moves sideways between \$2.8T and \$3T.
* Eventually breaks out and retests \$3T as support before resuming upward.
---
3. Bearish Turn Below \$2.8T 🔻 (20% Probability)
* Rejection at \$3T.
* Market loses \$2.8T support.
* Retests \$2.8T as resistance, followed by further downside pressure.
---
Key Levels to Watch
* \$2.8T and \$3T are critical zones. Movements between these levels indicate uncertainty and should be approached with caution.
---
Our Perspective
A retest of \$3T as support could present the strongest buying opportunity of this cycle. We urge everyone to stay alert, analyze carefully, and prepare accordingly.
Golden Cross is looming — remain focused and disciplined.
---
Stay updated and connected:
With best regards,
Team ProCryptoEdge
Educate. Empower. Elevate.

Ethereum (ETH/USDT) – Elliott Wave Long-Term AnalysisBINANCE:ETHUSDT
📈 Ethereum (ETH/USDT) – Elliott Wave Long-Term Analysis
🕒 1W Chart – Macro Projection
According to my Elliott Wave count, Ethereum is currently completing a complex WXY correction in wave 4. The final leg, wave C of (Y), could drive the price down into the key support zone between $895 – $865, aligning with the 161.8% Fibonacci extension.
✅ Buy zone: $895 – $865
❌ Invalidation: sustained break below $865
🔴 Major resistance: $3,509
🚀 If the structure plays out, a powerful wave III-IV-V rally could follow, with long-term targets potentially above $9,000 by 2034.
This scenario remains valid as long as the corrective wave stays above the invalidation level. A bullish macro structure is still intact.
💬 Drop your thoughts or alternate counts in the comments!
🔁 Like & share for more ETH updates 🔥

BTC.D - Still in the ascending channelCRYPTOCAP:BTC.D remains firmly within its long-standing ascending channel. The recent “fake breakout” below the channel has been invalidated as dominance swiftly returned to the channel, showing a strong reaction and confirming the channel’s validity.
This suggests:
✅ Bullish Implication for BTC: Bitcoin is likely to continue gaining dominance in bullish moves, outpacing altcoins in performance.
✅ Bearish Impact on Altcoins: In downturns, altcoins are expected to experience sharper declines compared to Bitcoin.
Traders should monitor this channel as a key indicator for market behavior, especially for Bitcoin and altcoin strategies.

Crypto Market Cap: Short-Term Pullback Before Major RecoveryTechnical Analysis
The chart illustrates a well-defined ascending channel for the total crypto market cap (excluding BTC), currently experiencing a downward retracement. The price action suggests a probable dip towards the lower boundary of the channel around the $969 billion support zone before rebounding significantly. This level aligns with previous price reactions and serves as a strong demand zone, making it a potential bottom before the market resumes its uptrend.
Fundamental Analysis
Liquidity Flow & Market Sentiment
The broader market has seen increasing stablecoin dominance (such as USDT’s market cap exceeding $130 billion), indicating risk-off behavior as investors move to safety. This suggests a short-term sell-off in altcoins before a reinvestment phase.
Institutional inflows into ETFs (like Ethereum and broader crypto ETFs) will likely drive the next bullish wave, but the current correction reflects temporary uncertainty.
Macroeconomic Factors
Interest Rate Policies: If the Federal Reserve signals rate cuts in mid-2025, risk assets (including crypto) will likely benefit from increased liquidity.
Regulatory Clarity: The market is awaiting key regulatory developments, especially in the U.S. and EU, which could influence capital inflows into crypto.
Altcoin Cycle & Market Recovery
Historically, the crypto market experiences phases of correction before a strong recovery. With the next Bitcoin halving approaching (April 2025), the overall crypto market cap is expected to rebound as bullish momentum returns.
DeFi, gaming, and AI-based tokens continue to gain traction, setting the stage for an altcoin-driven rally once risk appetite returns.
Conclusion
A short-term pullback to the $969 billion support level is highly probable, after which a strong bullish reversal is expected. Long-term investors might see this dip as a buying opportunity, anticipating a rally towards the upper boundary of the channel (above $2 trillion) as macroeconomic and institutional factors align in favor of crypto.

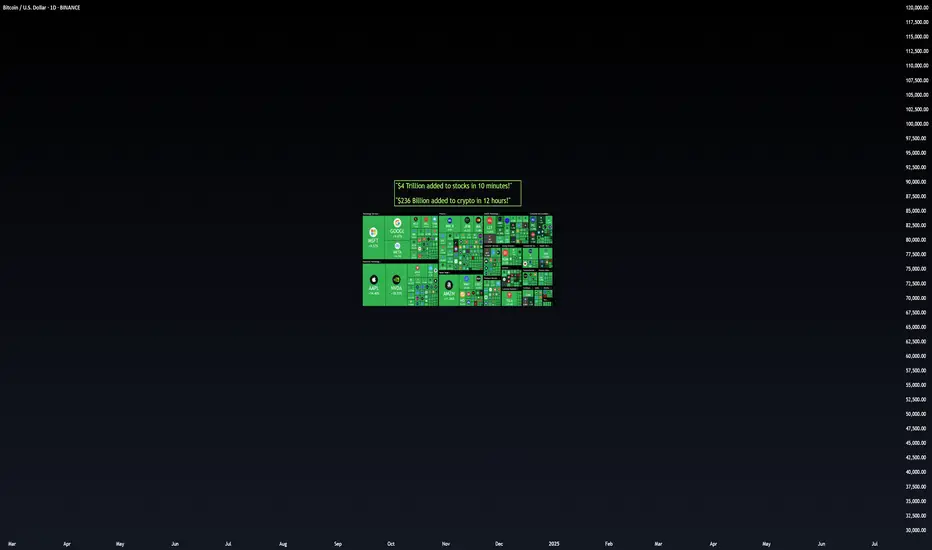
Market Cap Is Not Real Money InflowThe Market Cap Illusion — The Most Dangerous Misunderstanding in Finance Right Now
⚪ Let's talk about what nobody else wants to tell you.
Everywhere you look right now on social media, you're seeing the same recycled headline:
"$4 Trillion added to stocks in 10 minutes!" "$236 Billion added to crypto in 12 hours!"
Sounds exciting, right?
It’s also deeply misleading.
⚪ Here’s The Harsh Truth:
A rising market cap does NOT mean that billions or trillions of new money just magically flowed into the market.
It means prices went up. That’s it.
Market Cap = Last Traded Price x Total Supply/Shares
If Bitcoin moves up 8% → The entire Bitcoin market cap increases 8%. Even if only a small percentage of Bitcoin actually traded hands.
This is not "fresh capital inflow." It’s just higher prices multiplying across existing supply.
⚪ Let’s Be Super Clear:
WRONG:
"$236 Billion flowed into the crypto market." "$4 Trillion entered the stock market."
RIGHT:
"Market cap increased by $236 Billion because prices went up." "Stock market cap increased by $4 Trillion due to price movement — not because new money entered."
Big difference. Please stop confusing these.
⚪ So Why Does This Misunderstanding Exist?
Simple.
Most social media traders out there have consistently FAILED to educate their audience properly.
They focus on hype, engagement, and surface-level headlines because that’s what generates likes, not truth.
But here’s the problem:
This misinformation leads to false confidence. It leads to poor decision making. And worst of all — it misleads new traders into thinking markets work in ways they absolutely don’t.
⚪ It’s Time To Be Real.
Stop blindly trusting everything you see on social media. Stop believing every influencer who screams "money is flowing in!!"
Most of them don’t even understand what they’re talking about.
Real traders, real investors — they ask questions. They double check the facts. They understand the mechanics behind market moves.
And so should you.
⚪ The Real Difference:
Market Cap shows valuation based on price
Liquidity shows real money inflow based on actual capital entering
If you want to survive and thrive in these markets, start separating hype from reality.
Be smarter. Be curious. Be aware.
Disclaimer: This information is for entertainment purposes only and does not constitute financial advice. Please consult with a qualified financial advisor before making any investment decisions.
ALT Market cap - Dip before 3TThe Crypto Total Market Cap Excluding BTC (CRYPTOCAP) is currently testing a critical support zone at the 21-month Simple Moving Average (SMA). Historically, this moving average has acted as a strong dynamic support, marking significant market reversals and uptrends.
✅ Price is bouncing off the 21 SMA, similar to previous bull market cycles.
✅ The recent correction appears to be a healthy retest of support rather than a trend reversal.
✅ The formation of higher lows suggests bullish momentum building up.
✅ If price holds above this level, we could see a strong rally in altcoins, pushing the total market cap higher.
A successful bounce from the 21 SMA could trigger a bullish continuation, leading to a market expansion toward 1.6T - 2.3T levels in the coming months.
🔸 A monthly close below the 21 SMA could invalidate this setup, leading to a deeper correction.
🔸 Key support zone to watch: $900B - $950B
🔸 Breakout confirmation: Monthly close above $1.1T
If history repeats, this could be the perfect accumulation zone before the next major altcoin season! Keep an eye on the monthly close and volume confirmation for the next big move.
Follow our TradingView account for more technical analysis updates. | Like, share, and comment your thoughts.
Cheers
GreenCrypto

XRP: The Calm Before the ExplosionXRP has been in strong 100-day accumulation, with a few deviations along the way. Many altcoins have formed reversal patterns, and XRP is setting up for a sharp move upwards. Expecting a breakout from this consolidation phase, potentially propelling XRP to #2 in market cap. The stage is set for a major run!
Entry: NOW
TP: 4

OTHERS DOMINANCE ANALYSEThe Crypto Total Market Cap (excluding top 10) dominance is showing interesting action around the key 8.30% level. Historically, this level has acted as strong support/resistance (see 2017, 2020, 2022).
After breaking below 8.30% in late 2023, we’re now seeing a retest from the downside.
The price has bounced off this level with a decent volume spike, suggesting potential for an upward move.
If this support holds, we could see a push toward the next resistance around 11%-12% in the coming months.
Keep an eye on volume – sustained buying pressure will confirm the breakout.
💡 Trading Idea: Watch for a weekly close above 8.30% for confirmation of bullish momentum. On the flip side, a rejection here could lead to a retest of lower supports around 7%.
What do you think?

TOTAL Marketcap at important support?Upcoming period could be more positive?
Many cryptocurrency dominance charts, as well as Nasdaq and stock charts too, showing the same pattern. Is the reversal starting?
We’ll see.
This is not investment advice. Please do your own research.
Wishing you best.
-YusufDeli

Crypto Total Market Cap Headed towards 5TTotal Crypto marketcap has sit the support zone around 2.6T and successfully bounced back from the support after forming two wicks on the weekly candle. This is a good sign that there is still bullish momentum left in the overall crypto market.
Currently the market-cap is around 2.9T and steadily increasing. I'm expecting the further growth in the overall market cap and to reach 5T in the next couple of months.
Follows us for more updates.
Cheers
GreenCrypto

Is Crypto a Bad Girlfriend?Is Crypto a Bad Girlfriend?
Ask yourself this: Is your relationship with crypto toxic?
Lately, it feels that way:
🚩 Rugpulls every day—Libra, TRUMP, MELANIA, PENGU, PNUT... the list goes on.
💸 Staking inflation spiraling out of control in PoS projects.
🎭 Narratives changing every 6 months to make you spend more.
📉 Most altcoins down 50%+ in 2024, making the USD look like a safe haven.
🔓 Hacks everywhere, with millions stolen daily.
Just in my circle, friends are getting hacked weekly, calling me for help. It’s out of control!
Now, the biggest heist of all time on Bitget?!!
💰 $1.4B gone in seconds—probably straight to North Korea.
Meanwhile, traditional finance (TradFi) and banks are having crisis meetings today, figuring out how to avoid being the next headline.
Is Crypto Worth the Risk?
Gold can’t be hacked.
NASDAQ has never been hacked.
Why invest millions in something intangible and so vulnerable?
Today, $160B vanished from the crypto market cap (-5%)—and it’s just the beginning.
Do you really believe governments will store national reserves in crypto?
Who will control the keys?
How will they prevent hacks?
If Bitget can lose $1.4B, how can you trust anyone to manage national reserves?
Imagine This:
Stealing 14,000 tons of gold from Fort Knox? Nearly impossible without being noticed.
Stealing $1.4B in crypto? Done in a second.
Crypto is becoming a liability.
💔 She lies to you about her tokenomics.
📉 She wrecks your leverage and drains your money.
🛑 She tries to hack your wallet every chance she gets.
So why are you still with this girl?
Meanwhile, Wall Street keeps printing money for investors—without the chaos.
Investors are fed up.
🚨 Crypto is heading for its dot-com crash. Get ready for the dump.

Crypto Total Market Cap Consolidation: Imminent Breakout Ahead?Key Observations:
1. Symmetrical Triangle Pattern:
The price is consolidating inside a symmetrical triangle, with lower highs and higher lows.
A breakout in either direction is imminent.
2. Exponential Moving Average (EMA 200):
The 200-period EMA is at 3.26T, currently acting as resistance.
A breakout above this level could indicate a bullish trend continuation.
3. Relative Strength Index (RSI 14):
Current RSI: 49.34, slightly below the neutral 50 level.
This suggests neutral momentum, with no clear overbought/oversold signals.
A move above 55-60 could indicate increasing bullish momentum.
Potential Scenarios:
1. Bullish Breakout:
If TOTAL breaks above the triangle resistance and EMA 200, the next targets could be 3.3T - 3.5T.
Confirmation requires high volume and RSI above 55.
2. Bearish Breakdown:
A break below the triangle support could push TOTAL toward 3.0T or lower.
RSI dropping below 40 would confirm bearish momentum.
Conclusion:
The market is in a consolidation phase, awaiting a breakout. Watch for volume confirmation and EMA 200 reaction to determine the next move.

The Graph (GRT)🔷 Introduction:
What is GRT?
The Graph (GRT) is a decentralized protocol designed for indexing and querying blockchain data. It enables developers to access blockchain information quickly and efficiently without the need to run dedicated servers. GRT serves as the native token of this ecosystem, used for transaction fees and securing the network.
🔹 Technical Analysis of GRT/USDT – Weekly Timeframe
📌 Overall Market Condition
After an extended corrective phase, GRT remains within its weekly ascending channel. The price is currently hovering around a key support zone (0.1165 - 0.1334, marked in blue), which has historically triggered significant reactions.
🔍 Potential Scenarios
📈 Bullish Scenario:
✅ If the blue support holds and the price re-enters the ascending channel, further upside potential is likely.
✅ Key resistance levels:
Orange Zone (0.3202 - 0.3577): Possible initial reaction level.
Red Zone (0.6423 - 0.7232): Major resistance before reaching the final target.
✅ Key Consideration: If weakness in momentum and declining volume appear near these resistance levels, gradual profit-taking and a cautious approach could be wise. Otherwise, continued bullish momentum could push the price toward the channel’s upper boundary, targeting 1.0667 - 1.2607 (light blue TP zone).
📉 Bearish Scenario:
❌ If the blue support fails, the price could drop towards the next major support zone at 0.0691 - 0.0816 (gray support).
❌ Losing this level would invalidate the bullish structure and increase the likelihood of deeper declines.
🎯 Entry Strategy & Risk Management
⚡ Gradual entry within the blue support zone with a stop-loss below the gray zone is recommended.
⚡ Suggested risk: 0.25% to 0.5% of spot capital (to prevent heavy losses).
⚡ Volume increase in this area could signal a potential trend reversal.
🔹 Conclusion
The current support level is critical for GRT. If it holds, the bullish scenario remains intact, allowing for potential growth toward the upper boundary of the ascending channel. However, losing this level could invalidate the bullish structure and lead to a deeper correction.
🔸 Additionally, when approaching key resistance levels (0.3202 - 0.3577 and 0.6423 - 0.7232), monitoring volume and price behavior is essential. Signs of weakness in these zones may indicate an opportunity for gradual profit-taking and a more cautious approach.

$TOTAL Close Lackluster - What This MeansCrypto CRYPTOCAP:TOTAL Market Cap closes another day in its lower range $3.1T, failing to break the 9DEMA.
The TOTAL chart is not given enough credit because most do not understand it.
It’s best used to let us know how much money is sloshing around from narrative to narrative.
Once it definitively breaks that $3.7T range, then a rising tide raises all ships and it's ALTSEASON folks 🚀

TradeCityPro | SHIBUSDT $1 Target ?👋 Welcome to the TradeCityPro channel!
Let’s analyze Shiba, one of the most famous meme (shitcoins) in cryptocurrency, which has changed many lives for better or worse to see if it can reach $1.
🌐 Overview Bitcoin
Before analyzing today’s altcoin, let’s take a look at Bitcoin on the one-hour timeframe. It is breaking the 96,330 support, and if our RSI enters the oversold zone, we might see a move down to the 92,701 support.
Along with this, one of the scenarios I mentioned last night is playing out—Bitcoin dominance is increasing as Bitcoin drops. Even though I personally feel this dominance increase is fake, it will still lead to further declines in altcoins.
📈 What is Market Cap?
Before starting the analysis, I want to clarify the concept of market capitalization. Market cap refers to the total value of a cryptocurrency in the market and is calculated using the formula:
Circulating supply × current price
For example, if a cryptocurrency has 100 million coins in circulation and each coin is worth $5, its market cap would be $500 million.
Market cap determines a project’s dominance and size, helps compare cryptocurrencies, and serves as a measure of risk and growth potential. High market cap projects have lower risk but grow slower, while low market cap projects carry more risk but have higher growth potential.
Why am I explaining this? So that you understand how to verify if someone claims that Shiba will reach $1. Look at its token supply and market cap. A simple calculation shows that for SHIB to reach $1, its market cap would need to be $589 trillion while the total market cap of gold is only $19 trillion! Don’t fall for misleading advertisements, stay informed!
📊 Weekly Timeframe
Like most crypto coins, SHIB spent a long time inside its weekly range, with the upper limit at 0.00001171. After spending 620 days inside this range, it finally broke out with higher lows and momentum, starting an uptrend.
After this rare bullish move, SHIB hit 0.00003279, rejected from it, and retraced to the 0.00001296 support. It then moved back up but got rejected from the same resistance, reinforcing its importance and forming an equal high, which can be seen as a double-top pattern.
This double-top pattern, which is well-known and widely used, is typically a bearish signal indicating a trend reversal. However, we cannot officially call it a double-top until the 0.00001296 support is broken. That’s why I haven’t drawn it yet.
If 0.00001296 breaks, the double-top target will be its risk-to-reward ratio of 1, meaning we could see a move down to 0.0000067.
For buying, I will never buy SHIB, no matter how much profit it makes. If I want to speculate on shitcoins, I’ll go for ones with lower market caps. And remember, if a shitcoin is meant to make you rich, it will do so even with just $10, so you don’t need a large investment :))
For selling, I suggest exiting below 0.00001296, at least temporarily. Later, if the trend turns bullish, you can buy back the same amount of USDT, potentially avoiding further downside.
📝 Final Thoughts
Stay calm, trade wisely, and let's capture the market's best opportunities!
This analysis reflects our opinions and is not financial advice.
Share your thoughts in the comments, and don’t forget to share this analysis with your friends! ❤️
