Interesting Channel PointsI have been using the drawing tools in a different way today, more to see what the vertices of the confirmation points along that channel would express when I made infinite horizontal and vertical lines radiating from all of them. What is pretty obvious is that silver is in a long term upward trend according the the lowest points along the channel where there are enough to indicate a strong trend. Along the top of the channel there are even more confirmation points, as well as a good number of points within the channel that also confirm the same upward trend.
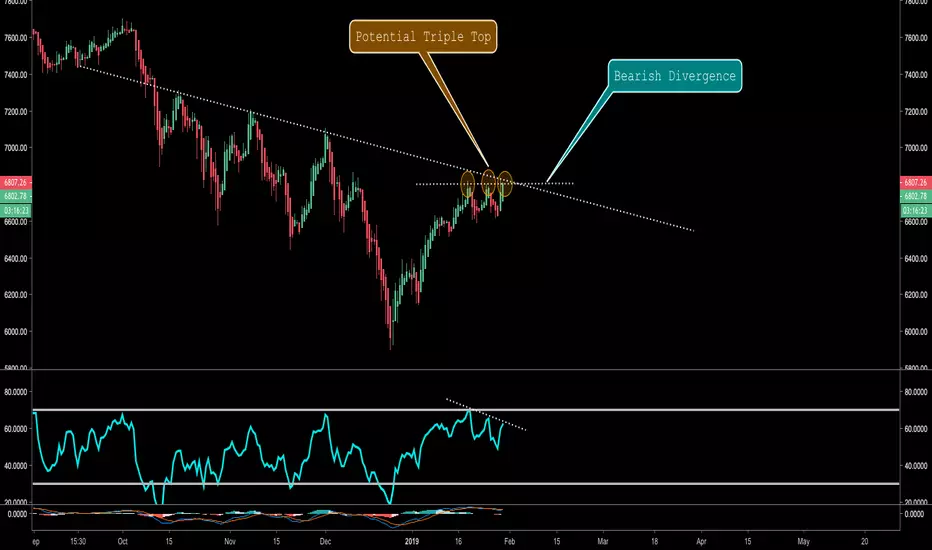
What I've found interesting is the concentration of the horizontal lines showing that the price action is heading toward a heavily resisted level at around the 18.67 area (give or take) made visible by the concentration of those horizontal blue dotted lines there. The first time XAG crossed this line (more of a "zone" if you look closely) was in '08 and it didn't last terribly long. It flirted with it for two years and then really broke through for the big rally in Aug of '10. It stayed above until Sept of '14, peaked above very briefly in Aug of 16, and today we're knocking on the door again. I've indicated these points with yellow ellipses.
I'm inclined to think of this as a bullish indicator despite RSI indicating a higher probability of an imminent reversal. Considering all the other news in the markets, we might be looking at another big pop if people decide to use metals like silver and gold to hedge a decline in dollar strength .
If anyone happens to see this and has any insight, please let me know!
Marketcrash

Using TIME FIBONACCI to predict the next MARKET CRASHUsing TIME FIBONACCI to connect the crash of 2000 (DOT COM BUBBLE) and the crash of 2008 (HOUSING MARKET BUBBLE) we get a warning sign signaling to August 2019 at 2.5 Fibonacci being a significant date in the stock market and also June 2020 being a significant date as well at 2.618 Fib
It's either the beginning of the crash or the end of the crash and an entry point for investors.
For more info and free education, visit www.TopTradingSignals.us

Using Time Fibonacci to predict the next MARKET CRASHUsing TIME FIBONACCI to connect the crash of 1877 and the crash of 1973 we get an accurate prediction on the 1.382 Fibonacci level for the bottom of the DOT COM bubble market crash in 2003 and a warning sign signaling to January 2021 being a significant date, either the beginning of the crash or the end of the crash and an entry point for investors.
For free education visit www.TopTradingSignals.us

Using TIME FIBONACCI to predict the next MARKET CRASHUsing TIME FIBONACCI to connect the crash of 1877 and crash of 1929 we get an accurate prediction on the 2.618 Fibonacci level for the DOT COM bubble market crash
For more info visit
www.toptradingsignals.us

CAC40 - Indices Trading | Elliott Wave Structures | Q2 2019*Please support this idea with a LIKE if it helps you. Thanks!
More details about me in my signature.
CAC40 - Elliott Wave Outlook
Bearish Swings - Patterns:
Triple Three structure in Cycle Wave IV (green)
W (purple) - Zig-Zag
X (purple) - Three (false break-out)
Y (purple) - Simple Flat
X (purple) - Contracting Triangle
Z (purple) - Zig-Zag
Bullish Swings - Patterns:
Impulse in Intermediate (1) (blue)
Extension in Minor 3 (green)
Next expected swing:
Bearish sequence in Intermediate (2) (blue)
Structure change:
Bullish continuation in an impulsive manner could lead towards more up-side for an Ending Diagonal.

VIX - Indices Trading | Elliott Wave Structures | Q2 2019*Please support this idea with a LIKE if it helps you. Thanks!
More details about me in my signature.
VIX - Elliott Wave Outlook
Pattern:
Leading Diagonal in Intermediate (1) (blue)
"Bullish" Divergence soon to launch a spike
Next expected swing:
Violent rise and a spike in volatility in Intermediate (2) (blue)
Structure change:
An impulsive continuation for the down-side could lead towards Indices rallying in a 3 of 3's.

HSI (Hang Seng) - Market Crash Cycles | Indices | Macro Trends*Please support this idea with a LIKE if it helps you. Thanks!
More details about me in my signature.
HSI has been labeled within a Sub-Millennium degree wave 4 (blue), which has been unfolding ever since the 2007-2008 Recession.
Structure - Expanding Flat Formation
Oct 2007 peaks and down until Oct 2008 bottoms - Grand Super-Cycle wave a (red)
Oct 2008 bottoms and up until Nov 2010 tops - Super-Cycle wave (a) (purple)
Nov 2010 tops and down until Feb 2016 lows - Super-Cycle wave (b) (purple)
Feb 2016 lows and up until present times - Super-Cycle wave (c) (black)
Super-Cycle wave (c) (black)
Pattern - Ending Diagonal
Sequence - 5-Wave Sequence, with Cycle Waves I II III IV V (black) decomposed as Primary A-B-C (blue)
Current PositionCycle Wave III (black)
Next expected swing
Bearish sequence in Primary B (blue)
Market Crash Forecast
Support granted at or around the 28000.00 mark and then a bull run towards the 33000.00 levels, where the Grand Super-Cycle Wave b (red) is expected to complete.
Grand Super-Cycle Wave c (red) would reflect the next Larger Degree Recession.
Structure change
Breach of the lower trend-line of the Ending Diagonal could reflect the fact that the Market Crash already started.

NI225 (Nikkei) - Market Crash Cycles | Indices | Macro Trends*Please support this idea with a LIKE if it helps you. Thanks!
More details about me in my signature.
NI225 has been labeled within a Grand Super-Cycle degree wave B (pink), which has been unfolding ever since the Tokyo Stock Bubble back in 1990.
Structure - Flat Formation
1990 bubble peak and down until Apr 2003 bottoms - Super-Cycle (w) (purple)
2003 bottoms up until 2007 tops - Cycle wave a (turquoise)
2007 tops and down until 2008 lows - Cycle wave b (turquoise)
2008 lows and up until present times - Cycle wave C (turquoise), the final leg of Super-Cycle (X) (purple)
Cycle wave C (turquoise)
Pattern - Ending Diagonal
Sequence - 5-Wave Sequence, with Primary Waves 1 2 3 4 5 (green) decomposed as Intermediate (A)(B)(C) (blue)
Current Position
Primary Wave 5 (green)
Next expected swing
Bearish sequence in Intermediate (B) (blue)
Market Crash Forecast
Support granted at or around the 21000.00 mark and then a bull run towards the 27000.00 levels, where Super-Cycle (X) (purple) is expected to complete
Super-Cycle Waves (a)(b)(c) (red) would reflect the next Larger Degree Recession or even a Depression
Structure change:
Breach of the lower trend-line of the Ending Diagonal could reflect the fact that the Market Crash already started.

NAS100 - Market Crash Cycles | Indices | Macro Trends*Please support this idea with a LIKE if it helps you. Thanks!
More details about me in my signature.
NAS100 has been labeled within a Sub-Millennium degree wave 3 (pink), which has been unfolding ever since the Dot-Com bottom from 2003 bottom, when the tech Recession tapped out.
Structure - Bullish Impulse
2003 lows and up until Nov 2007 highs - Grand Super-Cycle I (blue)
Nov 2007 highs and down until Nov 2008 Recession lows - Grand Super-Cycle II (blue)
Nov 2008 Recession lows and all the way up until Oct 2018 extreme - Grand Super-Cycle III (blue)
Oct 2018 extreme and sharp drops until Dec 2018 - Grand Super-Cycle IV (blue)
Grand Super-Cycle V (blue)
Pattern - Reversal Motive Wave
Sequence - 5-Wave Sequence within an Ending Diagonal
Current Position
Super-Cycle Wave (I) (turquoise)
Next expected swing
Bearish sequence Super-Cycle Wave (II) (turquoise)Market Crash Forecast
Support granted at or around the 7000.00 mark and then a huge rally towards the 9000.00 levels, where Sub-Millennium Wave 3 (pink) is expected to complete.
Grand Super-Cycle Waves A-B-C (red) would reflect the next Larger Degree Recession.
Structure change
Breach of the 7000.00 levels could lead towards a prolonged corrective structure and a Market Crash already starting.

FTSE100 - Market Crash Cycles | Indices | Macro Trends*Please support this idea with a LIKE if it helps you. Thanks!
More details about me in my signature.
FTSE100 has been labeled within a Grand Super-Cycle degree wave IV (blue), which has been unfolding ever since the Dot-Com bubble.
Structure - Expanding Flat Formation
2000 peaks and down until 2003 bottoms - Super-Cycle wave (a) (red)
2003 bottoms up until 2007 tops - Cycle wave a (black)
2007 tops and down until 2009 lows - Cycle wave b (black)
2009 lows and up until present times - Cycle wave C (black)
Cycle C (black)
Pattern - Ending Diagonal
Sequence - 5-Wave Sequence, with Primary Waves 1 2 3 4 5 (green) decomposed as Intermediate (A)(B)(C) (blue)
Current Position
Primary Wave 5 (green)
Next expected swing
Bearish sequence in Intermediate (B) (blue)
Market Crash Forecast
Support granted at or around the 7000.00 mark and then a bull run towards the 9000.00 levels, where the Super-Cycle Wave (b) (red) is expected to complete.Super-Cycle Wave (c) (red) would reflect the next Larger Degree Recession.
Structure change
Breach of the lower trend-line of the Ascending Channel could reflect the fact that the Market Crash already started.

CAC40 - Market Crash Cycles | Indices | Macro Trends*Please support this idea with a LIKE if it helps you. Thanks!
More details about me in my signature.
CAC40 has been labeled within a Sub-Millennium degree wave 4 (blue), which has been unfolding ever since the Dot-Com bubble.
Structure - Flat Formation
2000 peaks and down until 2003 bottoms - Grand Super-Cycle wave A (black)
2003 bottoms up until 2007 tops - Super-Cycle wave (a) (purple)
2007 tops and down until 2009 lows - Super-Cycle wave (b) (purple)
2009 lows and up until present times - Super-Cycle wave (C) (purple)
Super-Cycle (C) (purple)
Pattern - Ending Diagonal
Sequence - 5 Wave Sequence, with Cycle Waves I II III IV V (green) decomposed as Primary ABC (turquoise)
Current Position
Cycle Wave V (green)
Next expected swing
Bearish sequence in Primary B (turquoise)
Market Crash Forecast
Support granted at or around the 5300.00 mark and then a bull run towards the 6300.00 levels, where the Grand Super-Cycle Wave B (black) is expected to complete.Grand Super-Cycle Wave C (black) would reflect the next Larger Degree Recession.Structure change.
Breach of the lower trend-line of the Ending Diagonal could reflect the fact that the Market Crash already started.

VIX - Market Crash Cycles | Indices | Macro Trends*Please support this idea with a LIKE if it helps you. Thanks!
More details about me in my signature.
VIX should be able to resume the down-trend soon and complete the "greed" cycle, which in turn would translate bullish momentum for Indices and a postpone on the inevitable Market Crash sequence.
If however a break-out would occur, then a proper spike could be in play, translating into a prolonged "fear" period.Nevertheless, these are crucial times and the movements will be epic.
Just need to be on top of it and keep on tracking, confirm and then tap into the real trend.Eat, sleep, trade and visualize those pips piling up.

VIX Spike - April 2019 Sell-offVIX could be on the verge of starting a spike.
This would lead towards a sell-off in Indices across the globe.
I was able to call the previous spikes as well, related ideas below says it all.
If you like this idea don't forget to give it a like! Thanks!
BIG ugly Bear is out and hungry ... time for the fear effect ...
Let's watch to see how this would look like.
:)
Many pips ahead!

2020 Market Crash and Recession - #TNX #US03MY Yield InversionFor the past couple weeks, essentially every media channels were screaming out about TVC:US03MY - TVC:TNX yield inversion. While more scrutiny is desired, we are essentially sitting at the crossroad with heavy down-pressure in our shoulder.
Just took a step back and looked at the big forest winding all the back to the 1980s.
Let's take a look and see what's happened in the past and where we are headed in terms of the yields (long-term vs short-term yields).
So what's the deal? How does this impact the investors and banks?
In a normal occasion, long-term investments require higher yields as it requires you to take risk for longer period of time.
When yield inversion occurs it wipes out the risk premium for the long-term investments. For you as an investor, you have no reason to take extra risk and opt-in for short term investments.
For banks that borrow short-term and lend long-term, their profit margins become slim, so they cut short-term bonds, pushing up yields even further. Central banks cut M2 supply, recession begins.
M2 supply as you many of you know already is a leading indicator of the markets, especially equity markets. When there is no GDP growth, there is no EQ growth, which will negatively impact the market overall. Including, but not limited to TVC:RUT , SP:SPX / AMEX:SPY , DJ:DJI . This will also spell cascade effects in markets rest of the world.
History doesn't have to repeat itself but these key indicators are not negligible either.

Is it possible that the SPX might just hit 1535?
In my opinion this is a very good possibility. We might just be in the early stages of a recession and the market is letting us know that it is not liking what it sees coming.
Lots of investors have been overlooking all the bad data and indicators. But to tell you the truth, this does not surprise me at all, considering they did the same exact thing right before the 2008 crash.
I see a lot of volatility in the market in the next few months to come, with a potential crash sometime during the end of the summer and beginning of fall.
Let’s hope that I am wrong for the sake of the middle class!
Crypto is where I will be putting my money

U.S ECONOMY CRASH COMINGS&P 500 index, This is the stock market index and is made up of the 500 largest US publicly traded companies, now if you take the time to look at these companies individual stock charts like i have ( yes i have no life ) you will notice that recently some of them are in a downtrend, had a big fall or some are at or nearing all time highs so we could see some correction with the all time high stocks.
Now add into the mix that the US federal government is in $22 TRILLION of debt ( the largest debt the US has ever been in ) then add in the rising unemployment in the US 4% of the population ( 6.5 million people ) this only equals 1 thing.... A RECESSION IS COMING!!!
Now look at the chart, purple arrows are resistance which when hit last time saw a big market correction ( big drop ) Now price is coming back up to test this price again we can see another market correction on its way and where better to do this than at a previously really strong weekly resistance?
Circled in orange are all time highs, we cant see this been broken with all the information we have supplied in this analysis.
With weakness in the economy people normally run and buy gold so we could also see gold prices rise when we see a market correction, the US economy is like a bubble that is getting bigger and bigger and is ready to pop... if you are too blind to see this then more fool you.
So short the S&P and buy gold.... then laugh all the way to the closest yacht dealership ;p

let the market crash boisokay obviously i cant afford to trade this most likely you cant either, but this is just to show you its exhausted, and ready to crash, its already reversing so its just in the matter of time that you will be looking for food stamps and government funding, so prepare yourself for a crash and have a happy market crash!! =)

NDX Showing Signs of Reversal I believe the NDX is going to have another sell off. The stock market is going to have a correction within the next two years, In My Opinion. With the interest rates staying the same for this quarter, theres a good possibility to have some more retail money push us higher.
Signs of a new recession?This is a simple Elliot Impulsive/ Correction Wave analysis of a hypothetical upcoming market recession based on the Dow Jones Industrial Average. The crash is modeled after the 2007 - 2009 Sub-prime mortgage crisis.
This projection is based on the assumption that the ABC correction wave will drop lower then the (2) impulsive mark by -12.85%. The A B points are estimated based on a very illustrative (1) (3) (4) channel.
This concludes the C wave at 9000.
This is an extreme scenario on a very long term scale and is not intended to be a trading recommendation. Use it at your own discretion for reference purposes.

SNP500 - 2018 Buy / Sell Orders - Correction & Market Crash2018 - SNP500 - BUY & SELL Orders:
PRIMARY 4:
SELL @ 2800 with SL @ 2900 & Target @ 2500/2400
PRIMARY 5:
BUY @ 2500 with SL @ 2400 & Target @ 2900/3100
MARKET CRASH:
SELL @ 2900 & 3100 with SL @ 3300 and Target @ 800
Follow me and trade like a Champion!
P.S. Exclusive guidance available for Members.
PM me if you want to join my Sessions.

Part 1 - Risk-off August - VIX WeeklyVIX (Volatility Index) seems to be preparing for another spike in volatility.
With the start of February 2018, VIX jumped. That spike in volatility could represent the first piece of a series of similar events.
This indicator is used by analysts to measure the state of buy-sell investors’ emotions, complacency versus the fear effect. In simple terms, a rise in the VIX would or bring with it a sharp fall in Stocks and/or Indices.
A decrease in the VIX represents the periods when market participants are in the state of greed, being complacent and euphorically enjoying the bull market. A rise in VIX indicates a period of uncertainty, risk-off events that impact the markets directly and suddenly. Such spikes bring with them a fear effect, when investors are beginning to feel worried for the market’s destined directions.


