You can still get in on with me, if you have the balls :PMy 1st position running from 55 750:
prnt.sc
My 2nd (gamble) position running from 55 135:
prnt.sc
Looking to take profits on my gamble position after 30-50 % crash. Basically looking for a 10x.
This is pure speculation based on my own information. Do not attempt at home.
Marketcrash

I put my money where my mouth is. My position in descriptionThis is my last warning for the crypto crash guys... I know it may seem crazy, but i really see the rekt train coming.
my position:
prnt.sc

$SPY Looks Weak!SPY is forming a nice consolidation pattern in the last couple of days and looks primed for a move lower. We also see an inverted cup and and handle on this 15m chart. I am targeting the previous low short-term, and around $400 for the mid-term. Good Luck!

$SPY Breakdown- Next Target $404The stock market is breaking down support and we are likely to see continued downside because of this. I think that this could potentially lead to a market crash, all it will take is a little bit of bad news. Good Luck!

Shorted AppleBearish RSI, Decreasing Volume, Evergrande is the new Lehman Bros. Wyckoff is everywhere

Evergrande Explained: What Does It All Mean For Markets?Evergrande is something that most of you will have heard about lately, and if you haven’t… you should get the know about it.
This has been one of the main causes of the latest sell off in markets. Its affecting all financial markets from the stock market to the crypto market right now.
I want to explain why that’s the case and what impact it might have going forward…
What is Evergrande?
For anyone who has never heard of Evergrande or maybe has heard it but isn’t sure what it is…
Evergrande is Chinas 2nd largest Real Estate developer and 122nd largest company in the world.
They employ over 120,000 people.
They have over 1,300 building projects in China.
And importantly, they also have some of the largest company debt in the world…
They owe approximately 300 BILLION dollars.
And can’t afford to pay it back…
So What Does It All Mean & Why Is This Important?
Evergrande defaulting on its debt payments has shaken confidence in Chinese real estate markets and caused investors to “de-risk” their portfolios…
Its caused volatility and market sell offs in the stock market as investors or lender to Evergrande are no doubt selling assets to cover some the capital now at risk of default with Evergrande.
Its also made investors worry about a wider spread debt crisis or “contagion” event in markets where lenders or debtors to Evergrande are then also at risk if those debts are not paid back.
So Whats Going To Happen?
So while we outline what this does mean for markets its important to also outline what it doesn’t mean… There are fears that this could be a similar event to the real estate crisis in the US around 2008 where Lehman Brothers defaulted on their debts… and we all know how that ended right?
Well I don’t think this is the same… and more importantly I don’t think that the Chinese authorities would allow that to happen.
This event in some ways has been caused by the Chinese authorities trying to calm the excesses they knew about in the Chinese real estate market…
So I believe this is somewhat a controlled explosion by authorities in China that are looking to deleverage their market excesses.
If that is the case then the fear in the market currently of contagion risks and full blown market crisis is over exaggerated. That means there’s a real possibility that this COULD offer an opportunity to get a good entry into the market during this pullback.

$SPY ~ Why A Crash Won't Surprise MeFirstly: This is not a prediction.
I just say what I see. And what I see is, a tentative market top that looks different than all the previous "tops" this year, including the 2020 crash.
I will put "top" in quotes because of course, I cannot be sure that is indeed a top until after the fact; obviously.
What's different about this "top"? My labelled chart tells all, but in summary:
There are very few or very small gaps. A clear gap almost always represents a "shock" in the system. A fall with virtually no gaps, in my view, means a structured, calm, almost rational fall.
There is a cluster of red candles meaning this indeed "methodical" selling, also relating to the fact that there are no big gaps
Take a look at the 2020 crash, and all mini tops this year (2021). You'll see nothing but choppiness and gaps. Panicking, in other words.
Take a look at the 2008 crash:
As you can see, virtually no gaps near the top. A structured, "rational" fall, later ending up in a recession.
I'm not saying a crash will happen, obviously. But I would not be surprised, and I just say what I see.
And what I see is, a "top" that looks different from everything recently before it.
Side Note:
It also looks the "Smart Money Index" has been on a consistent downtrend since 2018.
I don't think this is my strongest point, so I left as a mere side note. Make of it what you will.

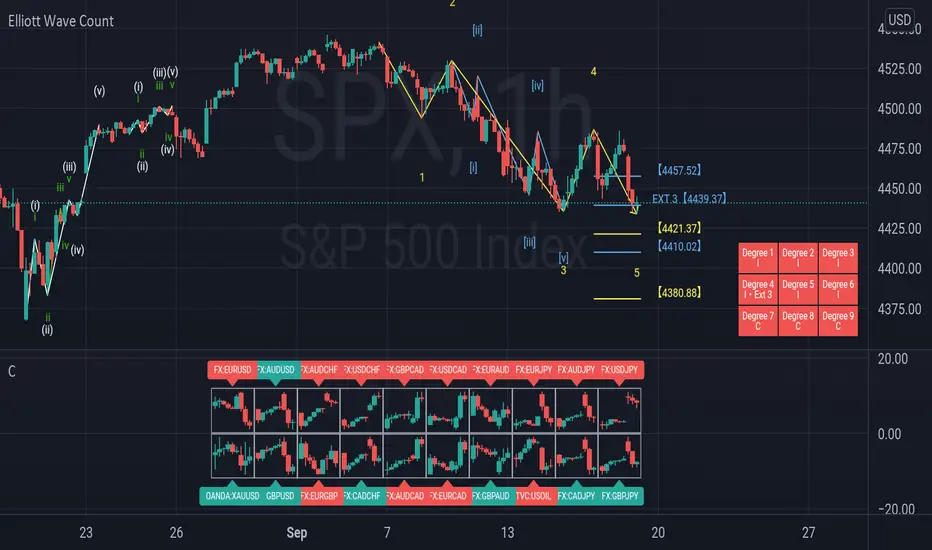
SPX 1h update Elliott wave analysis
Base previous analysis scenario which spx break the low 4435 happened.
So on new update Elliott wave count indicator
As you can see we are in wave 5 but we don't know wave 5 end or not, so if it continues to go down first target is 4420 if it break 4420 maybe next level is 4380.
VIX - BREAKOUT - MARKET WINTER CRASH ?The benchmark indices traded in a range during early afternoon trade. The Nifty index was hovering above 17,350 level. Media stocks extended gains for the fourth consecutive session.
At 12:20 IST, the barometer index, the S&P BSE Sensex, rose 161.04 points or 0.28% at 58,290.99. The Nifty 50 index gained 44.80 points or 0.26% at 17,368.40.
The Sensex hit record high of 58,515.85 in early trade. The Nifty scaled record high of 17,429.55 in early trade. Upbeat global stocks boosted investors' sentiment.
In the broader market, the S&P BSE Mid-Cap index added 0.36% while the S&P BSE Small-Cap index rose 0.65%.
The market breadth was positive. On the BSE, 1,696 shares rose and 1,494 shares fell. A total of 167 shares were unchanged.
Economy:
India's foreign exchange reserves rose by $16.663 billion to touch a record high of $633.558 billion in the week ended 27 August 2021, the Reserve Bank of India (RBI) data showed. According to RBI data, forex reserves rose to a record $633.558 billion, mainly due to an increase in Special Drawing Rights (SDR) holdings.
In the reporting week ended August 27, 2021, the country's SDR holdings rose by $17.866 billion to $19.407 billion, according to weekly data released by the Reserve Bank of India (RBI) on Friday.
Foreign currency assets (FCAs), a major component of the overall reserves, fell by $1.409 billion to $571.6 billion in the reporting week. Gold reserves rose by $192 million to $37.441 billion. The country's reserve position with the IMF rose by $14 million to $5.11 billion in the reporting week, the data showed.
Coronavirus Update:
Total COVID-19 confirmed cases worldwide stood at 22,06,89,680 with 45,67,354 deaths. India reported 4,04,874 active cases of COVID-19 infection and 4,40,752 deaths while 3,21,81,995 patients have been discharged, according to the data from the Ministry of Health and Family Welfare, Government of India.
Derivatives:
The NSE's India VIX, a gauge of market's expectation of volatility over the near term, jumped 4.24% to 15.16. The Nifty 30 September 2021 futures were trading at 17,380, at a premium of 11.6 points as compared with the spot at 17,368.40.
The Nifty option chain for 30 September 2021 expiry showed maximum Call OI of 18.1 lakh contracts at the 17,500 strike price. Maximum Put OI of 30.9 lakh contracts was seen at 16,500 strike price.
Buzzing Index:
The Nifty Media index advanced 2.01% to 1,672.75. The index has added 4.44% in four sessions.
PVR (up 3.74%), Dish TV India (up 3.03%), Zee Entertainment Enterprises (ZEEL) (up 2.44%), Network18 Media & Investments (up 1.93%) and TV18 Broadcast (up 1.24%) were the major gainers in the Media segment.
Stocks in Spotlight:
Dr Reddy's Laboratories rose 0.56%. The company signed a deal with Citius Pharmaceuticals, Inc. to sell its rights to anti-cancer agent E7777 (denileukin diftitox). In an exchange filing made on Saturday, 4 September 2021, the drug maker said that it has entered into a definitive agreement with Citius Pharmaceuticals, Inc. (Citius) pursuant to which it sold all of its rights to E7777 (an engineered IL-2-diphtheria toxin fusion protein) and certain related assets.
Engineers India gained 1.88% after the company said it secured a Rs 1,039-crore order from Chennai Petroleum Corporation (CPCL). In a regulatory filing to stock exchanges on Friday, Engineers India said, "Chennai Petroleum Corporation entrusted the project for execution of EPCM-1 with MPMC & EPCM-3 services for 9 MMTPA Cauvery Basin Refinery (CBR) Project at Nagapattinam, Tamil Nadu. The total awarded order value is Rs 1039 crore with a total project schedule of 42 months for mechanical completion."
Mahindra & Mahindra Financial Services (M&M Financial) rose 2.39% after the company said it reported disbursement of over Rs 2,000 crore for the second month in a row in August 2021. The total disbursement stood at about Rs 2,150 crore, recording a 57% Y-o-Y (year-on-year) growth, albeit on a lower base of August 2020, which was impacted by the first wave of COVID-19. The collection efficiency was reported at 97% for August 2021, further improving on 95% reported in July 2021. The collection efficiency in April 2021, May 2021 and June 2021 was 72%, 67%, 90% respectively.

Total Crypto Market Cap Retracement MaterializingIn this chart, I was expecting a probable retracement this September around the rectangle level.
Yesterday, we saw how fast what happened and $3.5B was liquidated.
Happy trading!

Is Nifty & Bank Nifty ready for correction?When we analyze Nifty's chart on Daily Candle, we see it is overbought since last 5 days.
Historically, whenever overbought indication got active on Daily Chart of Nifty, the correction started from there on.
Also, an analysis of Futures Contracts tells us that we are already at the peak. And number of contracts being sold/bought at this level are not much compared to the fulcrum.
Considering this data, the probability of Nifty going higher from this level is very little while probability of a correction is gaining ground.
The immediate support for Nifty is at 17124 and if it is decisively broken, the 17000 mark will not take much time to vanish.
Further upside, the chances of which are very low, will come only if next psychological barrier of 17450 is overtaken.
As for as Bank Nifty is concerned, it is fulcrum is located at 35915 and if the slide down starts and goes past this mark, many Buyers will be forced to liquidate their positions, which will push the price further down.
If a further upwards push comes for the bank nifty, only Entry above 37400 can be considered safe from a short to medium term perspective.

XAUUSD SHORT TO 1756 (Update from my last post)XAUUSD SHORT ANALYSIS UPDATE TO 1756: We saw Gold carry on surging higher this week like I outlined on my last analysis & we saw Wave E complete at 1826 in 200 PIPS profit! I am still looking at shorts at the current price or even possibly a little higher at 1737-1742 as there could be a little liquidity sweep to take out July highs at 1835. I have moved my invalidation level to 1847 to deal with Wave E pushing higher towards the first half of the week.
I will be catching this move on behalf of myself and my Account Management Investors✅

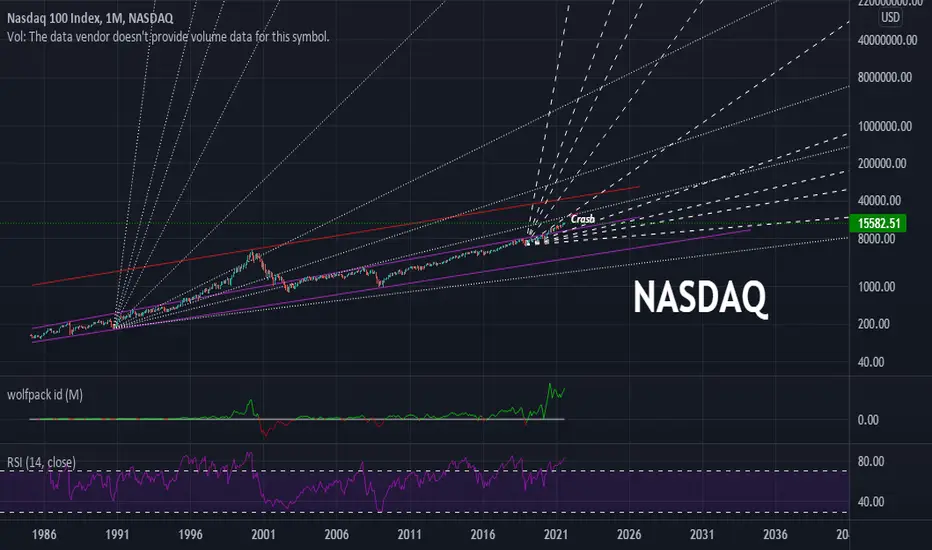
NASDAQ MACRO LOG CHART (+ Info, Targets, Crash Points...) General Info:
- On the linear scale, the NASDAQ has made a parabolic move (2009 - Now).
- The 2009 crisis was never properly fixed. The government placed a bandaid on the debt problem by bailing out all of the banks/corps.
- TECH is the future but speculation is the bubble fueler.
- Margin debt is at ATH
- Transportation Index is down
- "Meme Stocks", Robinhood era - dumb money
- COVID Massive Printing (1/3 of Economy $$ printed in 1 year)
- Joe Biden's trillion-dollar infrastructure plan + corporate tax hikes
- COVID DELTA, Afghanistan... (current events)
- Bull/Bear markets come in cycles
- Overvalued markets as a whole (real estate, crypto, NFT...)
What to expect:
Following the Log Scale, one would expect the biggest crash in history to occur when the NASDAQ reaches the red line (maybe 55K a couple of years down the road (around 2031)), however, this is not feasible. There simply isn't enough liquidity to keep the markets going in an upward direction for years. As we are over-valued, we can expect a correction/crash at the current GANN line we are approaching. There isn't an exact timeline as to when we will touch and react, but here is the scenario:
17K by end of December then crash. If we impulse then 19k. If we keep going up then 22K Q2 2022. It will either be a blowoff top or a stagnation for a couple of months around the PT before downwards movement. An impulse to 22k mid-2022 followed by stagnation can carry the crash over into 2023.
In summary, 17K, 19K, or 22K. EOY or Q2 2022. Have patience and an exit plan. Good Luck!
NDX (Nasdaq) one of the possible moves. Possibility of dotcom2.0Hey, this is one of the possible moves in of $NDX, the index is overbought and it needs to cool off, maybe we see a market crash (or just a big correction) in February 2022.
Not financial advice. Do your own research.
P.S I will be glad if this is not gonna happen. If this happens many people will lose their savings.
P.P.S If we see market crash it will not be as 'light' as 2008 but more like as it was in 2000 (dot com crash) or even as hard as the Great Crash (1929 aka the Great Depression).

Market could be a heightened version of the 2020 crash?Going into September with an RSI nearing 80 on the monthly, I think a pullback is imminent. And outside factors are not gonna help.

Mother of Market Crash is NearHere I will share my opinion about the mother of market crash, this is all about the global economy, I want to explain a little what is meant by michael burry, this has to do with elon musk and bitcoin.
Michael Burry once said: we will witness the mother of all accidents, in the midst of the greatest speculative bubble of all time. Then what does this mean? everyone is still wondering about this.
Everyone must have known that the bitcoin season will continue until the end of the year, this is called a speculative bubble if the bull is left until the end of the year, it is like a small fish eating a whale and this will probably never happen. the minor players are bound to leave before the end of the year, and this is what the big players don't want.
Michael Burry may be right again, this could be due to several factors
- United States inflation rate out of control
- Federal Reserve will raise key interest rates sooner than expected
- high unemployment rate
- Covid19
- Bank collapse
Let's try to see the chart pattern I made about bubbles
bitcoin is dancing on the edge of a knife, here I am a little doubtful about the accumulation of wyckoff and the movement is a little suspicious.
I feel like Elon Musk was hiding something during the last discussion with Jack Dorsey and Cathie Wood on the Bword show.

Market Outlook WeeklyTVC:SPX using a log chart I channeled the market since it's inception. The top of the channel (in red) is exclusively where the major stock market crashes have happened. The bottom channel (in green) is "crash free." The bold purple line is where 3 of last 4 market crashes have happened. Since the "Nixon Shock," $spx has failed to breach this line, except during the "dot-com bubble." U.S. inflation rates are rising, the Buffet Indicator (divide by US GDP on the chart) is at an all time high, and the CAPE (SPX ECY on chart) is starting to. rise, like it has at the top of every crash. However, a major crash has not when CAPE is above that black line, excluding COVID.
Note: Not claiming a crash now, just saying there are some warning signals and to be cautious.

EDU a "nonprofit organization"China's crackdown on for-profit education companies was a disaster for traders not using a stop loss.
In the 52 Week Range EDU New Oriental Education & Technology Group Inc. went from 19.9740 to 1.9400usd.
After-school tutoring institutions must transform themselves into "nonprofit organizations".
Jim Cramer (Mad Money) on China's tech crackdown: You can't own Chinese stocks!
ARK Invest dumps Chinese stocks.
It seems dangerous to hold Chinese stocks right now.
US-listed Chinese companies have three years to comply with US accounting oversight, to comply with the rules of accounting and transparency that American public companies must follow, if not they will get delisted.
This looks like the beginning of China`s stock market crash.
I`m looking forward to read your opinion about this!

Germany Is On The Verge Of Economic Collapse 2021 Euro CRASH !!If current high does not hold then watch out for 16,200!
GOODLUCK!


Giorni bui per l'ItaliaItaly might be good at FOOTBALL but NOT in FINANCE.
Dark Days Coming...
GOODLUCK!

Gold + RSI Divergence (Click to find which one)Good day guys! My team and I have been milking Gold all week with 200+ pips trading live Tuesday, Wednesday & Thursday. However, I am simply updating you all on the overall move and that is downward. As price action demonstrates to break the previous high this week, you notice there is bearish divergence present within the RSI. With the relative strength index indicator providing us a strong confirmation of a market reversal, we are now waiting to check off all the confirmations within our checklist. In other words, just because the RSI indicator is showing signs of a reversal, it is not something we trade alone. If you notice our previous analysis around June 8-10th, we were able to send a last warning before profiting over 1200+ pips. However, that was a opportunity we were watching for almost 2 months. When it comes to trading as a professional, you have to digest that you will probably spend 5% of your time actual trading and 95% waiting. Due to the fact that the markets tend to range more than they trend, you have to be patient. We could see our move occur next week or it could be drawn out until the end of the month, until the next Fed meeting. In conclusion, instead of trying to predict, we simply just react. Well, we do appreciate you for checking out our post and remember, we will see you on the other side.
Rodrick Goss (CEO)
Third Eye Traders

SPY looking bearishVix started going moving up since yesterday 7/7/2021
The 55 day EMA is a solid support level for SPY on the daily Timeframe.
So I expect that to be close to $422
BlueWave confirmed with a red dot sell signal on the daily time frame
Combined with an Overbought Stochastic RSI
