"MOTHER OF ALL CRASHES"YOU SEE IT AS "BACK TO NORMAL" I SEE IT AS "10 YEARS OF CRISIS"
JULY/AUGUST 2021: JUST BE CAREFUL!!!
IN CASE MARKET HAS NOT TOPPED YET, I'D GIVE IT MAX TILL 9TH JULY 2021!
GOODLUCK!
Marketcrash

DOW TOP PREDICTIONThis super cycle EWT & Fibonacci analysis is showing me that we are approaching the top of the quantitative easing/money printing pump. Nearly all of the EWT theory rules apply, and the fibonacci levels are scary accurate. The top of the fibonacci retracement is a projection in this case but the accuracy of the previous trend levels with the fib retracement indicates the top in this analysis. We also have the 2.618 fib multiple within the exact same price range as the projected fib retracement top, which would make sense to be a turn around level on this macro trend.
The top is projected at 36,500-37,500 which is also just before the massive psychological level of 40k, which could suck in retail participants to put the cherry on top of the crash sunday.
Also as an additional flavor, the MACD is at record highs, and we just saw a confirmed cross this is more significant than the ones previously seen in the past 2 years.
I have sold 35% of my holdings, will be selling an additional 15-20% at 36,000.
Look out below...

Markets Crash when VIX hits $9The relationship couldn't be more clear.
It will be a great summer for equities, then crash, I guess lol :)

A Troublesome Outlook for Stocks SPY on 1 Month. In the last 12 Years we have seen 8+ Corrections Occur after a Doji Candle has formed on the One Month Chart. According to Investopedia "A doji candlestick forms when a security's open and close are virtually equal for the given time period and generally signals a reversal pattern for technical analysts." I have pin pointed 12 moments in the past 12 years where these candle formations have lead to a correction. (Not all Doji candles are perfect, the main detail I am looking for is an Open and Close that are virtually equal) All percentages were tallied at close of each month not wick.
October, 2007
% Lost: 53%
On October, 2007 a Green Doji Candle Formed, after that candle formed a green candle didn't form for the next 5 months, and the market fell over 50% for the next year and a 1/2.
April, 2010
% Lost: 16%
On April, 2010 a Green Doji Candle Formed, over the next 2 months the market saw a major correction of 16%. Now what is different about this correction compared to the 2008 crash is that volume was below the average at least 3 months prior. AVG 5.7B, ACT 3.9B. Now this is a trend we will see prior to the corrections in the future.
April, 2011
% Lost: 18%
On April, 2011 a Red Doji Candle formed, over the next 4 months the market fell 18%. The Volume 3 months prior was below the average, AVG 4B, ACT 2B. A new trend that we will see from here on out is that the bottom occurs around the 55 EMA line.
April, 2012
% Lost: 9%
April 20, 2012 a Red Doji Candle formed, over the next month the market fell 9% right around to the 55 EMA. The Volume 3 months prior was AVG 4.2, ACT 3B. Below Average.
April, May, July, 2015
%Lost: 10%
These 3 months each had a Green Doji candle leading up to a market correction of 10%. Which Lasted 7 Months, and two wicks ended around the 55 EMA. The volume was below the average at AVG 2.3B, ACT 1.9B.
September, 2018
% Lost 15%
On September, 2018 a Green Doji formed, for the next 4 months after the market fell 15%, and a wick landed right around the 55 EMA. The Volume 3 Months before was AVG 1.6B, ACT 1.3B.
January, 2020
% Lost 23%
On January 2020 a Red Doji formed, over the next 3 months the market fell 23%, and closed on the 55 EMA. At its peak the market fell 33%. 3 Months prior the Volume was below average Rectangle
Future Outlook:
The Last Two Months have been shaping up like the 7 corrections previously stated. 4 out of the last 5 months have been below average AVG 1.8B, ACT 1B. with TWO GREEN DOJI CANDLES FORMING. Not to mention the Market going up 40% in the last 15 month, Rates Expected to raise soon, Inflation expectations increased drastically, the Fed Artificially Stimulating the market (possibly easing up soon), 6 Trillion+ being printed in one year (possible 3 trillion more soon) Things are not looking good for the stock market. We all need to face the fact that a stock market crash/correction is coming.
The average of the last 7 Doji Corrections is 14%. If The SPY drops 14% it will go to $360.
The Last 6 Corrections have ended on or near the 55 EMA. if the SPY falls that far, it will fall around 28% to $303.
Only time will be able to tell what happens next, but things are not looking good. What do you think.

Sad but true... It really does looks like head and shoulderTho many institutions and large companies are buying the dip, but I believe that market is going to crash in 1-2 months if not in a few weeks.
I sincerely hope that I am wrong but let's set stop limits just to be safe.

Biggest Market Crash EventsMarket Crash Events
- Black Monday 1987
- Enron scandals 2002
- Housing Crisis 2008
- Pandemic 2020

TSLA short to 500? (PT 5)Well well well... Im sure I cant be the only one who has been loading up on puts since the last spike to the 630s...
I have been bearish on TSLA for awhile now and I personally think this was its last straw... it lost all of its support levels except for this march 2020 trend line that it bounced off of before.
Now yes, it could hold the trend line again and bounce back to above 600s but it is very unlikely at this point...
PT1: 547.82
PT2: 497.99
PT3: 465.90
Overall, for the next two weeks I think we see ~500 daily demand zone where I expect bounce then another leg down to ~465
Linear Regression Outlook:
Just my thoughts, Happy Trading!

Dow Jones US30: Potential Crash?Currently @ 34645
This is a long term analysis on the Dow Jones
In the month of May we have seen high volatility in the Dow Jones, which was
fueled by inflation fears in US, seeing the Dow lose +1500 points just in 2 days
Though the Fed has assured the public & investors that they have everything under
control & their tools will be able to manage any outcome. Regardless of this statement
some still fear the worst & predict another market crash due to hyper-inflation if the
Fed's tools fail.
That been said lets look at what technical analysis is showing us @ the moment.
We love to use Harmonics as they help us spot reversals and help us capitalize on them
before they happen. Do note Harmonics are not always accurate just like any other indicator
but their accuracy is notable.
Now looking @ the 1W / weekly chart we have a bearish harmonic, though not yet confirmed
But this shows a possible reversal & if we look @ the last bearish harmonic on the 1W chart
is was last year Feb - March whereby Dow Jones fell by 10,000 points due to the pandemic
Now if history repeats itself & we see another fall this time due to something else
e.g. hyper-inflation we would expect Dow Jones to fall to at most 23,000 before
recovering. The last Bullish Harmonic is based on our prediction.
link to previous analysis below
Do note this is just an analysis based on technical analysis & current events. All investments involve risk, our analysis and trading strategy does not guarantee future results or returns. Investors are fully responsible for any investment decisions they make.

zoom out! pt 2Last seen on the weekly support and resistance lines, the previous all the high area is a crucial point right now. We’re currently swimming in those waters, and whether or not this area serves as support or resistance is the waves we’re watching closely. So far today, we’re staying above. Let’s hope it stays that way!
Here on the 1D chart, we see the 200 eRMA overall trend line has been touched. As long as we bounce upwards, combined with the previous ATH flipping to support, AND that technical analysis combined with more FA/news like upcoming changes to Ethereum 2.0/EIP 1559 and energy conservation? DTH actually may look good.

Stock Market Crash May 2021 Today, we’re going to talk about whether or not the stock market going to crash in May 2021, because for the past few weeks, the market has gone down depending on what index you’re looking at.
So today we’re going to deep dive into this. Is the market going to crash? What is happening with cryptocurrency? What would happen to your portfolio if the market crashes, and how can you protect yourself from this?
What you see looking at the Nasdaq, over the past three days, it has been gone down. Selling seems to have been accelerated so far today.
The NDX TVC:NDX is for today, at the time of this writing on May 13th, 2021, still up a little bit, but is the market going to crash? How can you protect yourself, and what will happen to our wheel positions if the market is crashing?
That’s what we’re going to talk about today. And I thought in order to do this, it would be fun to bring on another expert. The expert that I want to bring on is my head coach, Mark Hodge.
What’s Happening In The Markets?
Markus Heitkoetter: So the Dow Jones has been making new all-time highs for quite some time right now, but then two days ago, and yesterday, it plummeted down. It was the worst day since January or something like this?
Mark Hodge: I believe so.
Markus Heitkoetter: But the Dow is only part of the picture. I think what most people are concerned about are these growth stocks. The Nasdaq had quite a significant drop, and people who are in, for example, invested in TSLA, SQ, or in any of these growth stocks, have seen these growth stocks have taken a beating over the past few weeks.
Mark Hodge: Right now, this is what’s known as sector rotation. Sector rotation is when everything is going great, interest rates are low, people are bullish, people are willing to put their money in more aggressive stocks for future growth.
Stocks that you would imagine have higher future earnings and have the potential to grow faster, even though they might not be even showing profits right now. So that’s where the money is going.
Now, when you talk about inflation concerns and you talk about higher interest rates, that’s when people get more cautious, and that’s where the blue chips, or the value stocks, become more attractive because people are worried about future profits getting eaten up by higher costs and higher interest rates with these growth stocks.
That’s why the Nasdaq stocks and tech stocks are taking a bit of a hit, but as you mentioned, the Dow was sitting at record highs just last week.
Markus Heitkoetter: I just want to put it in perspective a little bit. According to a weekly chart of the Nasdaq, with the drop that we had yesterday, we are down 8.4%. So around eight and a half percent. This is something that we saw also in March.
In March the markets went down by 12.5%, and we have almost forgotten this now. First of all, a true correction in the market is defined as 10% or more.
So at 8.4%, we’re not even there yet, but let’s take a look at a few other drops that we had earlier this year here.
There was another 12% drop, a 14% drop, and then, of course, last year, this is where everybody got super spooked during the Covid drop, right? This is when the Nasdaq actually dropped 30 percent.
But I mean, things like this happen in the markets all the time. It is absolutely normal. So will we, right now, see a 30 percent drop? Even if we do, so what?
If we were to look even further back we would see these retracements happening all the time. July 2019, we also had a 9% drop in the Nasdaq.
Before that going back to April/May in 2019, we had a drop of 12%. Towards the end of 2018, it’s so long ago, we almost don’t remember anymore, but we actually had to drop off almost 24%.
We have these healthy drops all the time and they need to happen, right Mark?
Mark Hodge: Exactly, and I mean, that’s a good point, Marcus. It’s healthy for the market to pull back, to retrace, and it does create a buying opportunity. So a 10 percent retracement or correction is normal. Now a 20% drop is a bigger deal.
The 30% drop that we saw with the pandemic, was a big deal. You know, that’s where people are getting fearful and they’re pulling money out of the market, but right now, people aren’t pulling money out of the market.
Money might be going into blue chips and then people might be seeing a buying opportunity in tech, but it’s definitely not the same thing, at least at this point.
Where Does The Money Go?
Markus Heitkoetter: You know what, Mark? Let’s actually talk about “buy the dip,” what it means and why it exists. First of all, money doesn’t disappear.
You see after we see a run-up, or even when the markets are making new all-time highs, traders who bought at this point are eventually going to sell at some point and take profits.
Now, what happens when you’re taking profits? Money is being deposited into your account. The key question is, what do you do now with this cash? That’s where we have kind of the Holy Trinity, where we have, on the one hand, money market accounts.
This could be like CDs or something like this where we are earning interest rates. So this is one way where you can put money in it. Mark, what is the interest that you are getting, 0.1% or 0.15%?
Mark Hodge: Not much, say just say zero.
Markus Heitkoetter: Then, of course, you have the stock market that you can invest in.
So the stock market is another way where you can put money in, and then finally, you also have real estate. So this is where we have this holy trinity. So money is not just sitting in cash because I mean, cash is trash, right?
You might have heard about this, and since right now in the money market accounts, you’re not getting any interest, this is why a lot of money is right now flowing into the stock market.
But then at some point, you are taking profits. When you’re taking profits, what do you do now? The real estate market is super hot. I mean, Mark, we talked about it the other day.
I mean, houses are going on the market, and within a day or two, they’re being snapped up.
So it is clearly right now a seller’s market, and in a seller’s market, you don’t want to be a buyer.
I invest in real estate, and right now I don’t want to be a buyer. Mark, you had an example of something that happened in your neighborhood, right?
Mark Hodge: Yeah, in Sacramento. It was, I think about a month ago, I believe it was 122 offers on just the normal three-bedroom, two-bathroom house in one weekend with multiple offers over the asking price.
I want to say they haven’t turned down a $500,000 offer because they wanted to extend the whole process. But anyway, real estate, it’s crazy right now. Marcus, I mean, you were looking at even buying a resort.
Markus Heitkoetter: You can’t buy a resort right now if you wanted to. I mean, I’m trying to buy an apartment complex, and you can’t, I mean, it’s crazy the prices they’re asking for them.
The other thing that is interesting is that the stock market and the real estate market, both historically just go one way, and that’s up.
Now, what about interest rates? Interest rates, on the other hand, fluctuate and they stay in a range. Remember the time when we had 10% interest rates? Nine% was this in the 90s? Mark, do you remember?
Mark Hodge: I believe it was before the 90s. I think it was more the 80s. It’s been a while.
Markus Heitkoetter: So it has been quite a while, and right now there’s not much money in cash. So it is fluctuating between the stock market and the real estate market, and it is not really that interesting right now.
If you were to look at a monthly chart of the Nasdaq, one thing that you see in the stock market is it is constantly going up.
Now, in between, there are a lot of little dips, and those are absolutely healthy. Those are happening when there’s profit-taking.
What Causes The Market To Crash?
This is why in the long run it has paid off to invest in stocks long term. So why, besides the profit-taking, do we have these dips? Why could the market crash and why could we possibly see a market crash now in May? Right.
So the two reasons why markets go down. Number one, there is just simply some profit-taking.
If a market is getting too hot, then profit needs to be taken out of the market. Now, number two is uncertainty. Traders don’t like uncertainty, and right now, we do have some uncertainty going on.
Let’s talk about the economic calendar. I want to bring up last week first. Last week, we had pretty bad news from the stock market. The unemployment rate actually jumped up from 5.8% to 6.1%.
That’s not good for the economy because when people talk about how is the economy doing, the one key indicator, Mark, is jobs. Right? When you say in an economy that is doing good, unemployment is low.
Last year when we had the pandemic starting, it was just going out like crazy, the unemployment rate and it was going down, down, down, but now it is going up. So one thing that traders are concerned about when it comes to the market is unemployment.
The other thing, Mark, and this is what has been spooking the investors this week is inflation.
So inflation is the next spooky thing. And inflation, the Fed has a target of 2%. What does it mean a year over year? We are OK with prices going up by 2%. Now Mark, let me ask you, how does the Fed control inflation?
Mark Hodge: With interest rates.
Markus Heitkoetter: Right, Interest rates. So what the Fed does is if inflation gets high, are they start raising interest rates and therefore inflation usually goes down again.
This is the tricky part because we need interest rates low because low-interest rates are leading to jobs.
How do low-interest rates lead to more jobs? You see, this is why we are talking about this today. I think it is super important that you understand a little bit of what’s behind the market so that you don’t panic when you see the market going down for two days in a row, and dropping maybe 8% in a week or two.
How do low-interest rates create more jobs? Well, first of all, lower interest rates allow companies to borrow money cheaply for expansion.
So today, everything is pretty much in the green. Growth stocks are usually in the Nasdaq, while value stocks are more in the Dow.
So especially these growth stocks, how do you grow a company? By borrowing money. And as long as interest rates are low, it is easy to borrow money and to grow to have healthy profit margins.
Now, if interest rates start rising, this is increasing your costs, and when the costs are increasing, it means that profits are decreasing.
This is the point and this is what it all boils down to. So it’s Interesting for you to see how this all ties together.
What Do We Do When The Market Goes Down?
Now the question is “what do we do when the market is going down like this?” I mean, Mark, we have several trading strategies, and one of the trading strategies that we would really like to trade is The Wheel strategy.
So what do you do when it is going down?
Mark Hodge: One of the benefits to the market falling is that when the market is dropping or there’s uncertainty in the market, then that means that options are getting more expensive.
So options are derivative and they are based on stock prices, and when the market is just kind of going up, things are complacent. Nobody’s worrying about options.
Prices are cheaper, but when there’s uncertainty, they expand, they get bigger, which means that we get to collect more premium.
So, I mean, that’s what we are doing this week. We are selling options on some stocks that we liked and that took advantage of the opportunity, took advantage of the drop.
Markus Heitkoetter: Absolutely. So a few puts that we sold is, for example, AAPL. We sold the 119 put, and this was just perfect. We got a lot of premium for it on the way down.
So this is one of the trades that we did. Another trade that we took was Boeing, (BA). So Boeing here also really a good trade as Boeing comes down, and especially over the past few days as we had the dip.
This is when we can make a lot of money selling options.
We sold the strike price of 217.5. So if Boeing stays above $217.50, we just keep the premium. Otherwise, we are getting assigned.
So then we have of course LVS. (LVS) is actually one of the stocks where we were assigned, so we bought it at $58.
Right now it is trading at $56.17, and we were able here now to sell calls. So this is what we did earlier this week.
We sold a call with the strike price of 59, and we were able to buy this back today.
So if you know how to play the markets, it is actually a good thing when the markets are going down because this is when you can pick up some really nice stocks.
We also picked up (SNAP) and again, Snapchat was going down. So therefore we picked up the put. We sold this with the strike price of 47 expiring tomorrow (March 14th, 2021).
Right now, it is trading at $51. So this is great.
And then we also had (SQ) is pretty interesting because it really seems to be bound to bitcoin here and BTC right now is tanking.
Mark Hodge: Yeah, this one does some exposure to Bitcoin. I think it was like one hundred and fifty million or something like that, I mean not the one point five billion that Tesla bought, but they have some bitcoin exposure.
So the lows today that were established with SQ were lockstep, the same move that Bitcoin saw.
Markus Heitkoetter: Yeah, absolutely. So this is where trading The Wheel strategy when the market is going down, as it is right now when others are taking profits and selling.
This is when we go on a shopping spree. This is what we have been doing this week.
We just sold puts this week. Then based on what the stock price does, you might or might not get assigned. If you do get assigned then you are selling calls.
Summary
Markus Heitkoetter: I mean, this is just a strategy that we like to trade. It’s not for everybody.
Because while you have these stocks, you can experience a drawdown in your account so you can have a huge unrealized loss.
For example. (RIDE) is a stock that I was wrong about. So I sold the 21.50 and this is where I got assigned.
RIDE keeps going down. So right now (March 13th) it is trading at a little bit less than $7. Now I was able to lower my cost basis to $15.23.
I actually was able to collect premium of more than $9,000, which is lowering my cost basis to a break-even of around $14.30, but as you can see I’m still underwater water.
So what you need during these times, it’s of course nicer when you have the index because the index is bouncing back fairly quick.
Again, you see how many weeks does it take after a drawdown before it bounces? One, two, three, four?
When we had this huge, massive drop because of Covid, it took us 11 to 12 weeks. That’s only three months here. Often see this also in stocks.
So the question is, should we be concerned about a crash? First of all, having a retracement here? This is not even a correction. Having a retracement of 8% is nothing.
I mean, unless we start seeing something like we had 10 or 15 percent or 12 percent or 12 percent, or if you are going back in time, if you are going before the covid drop where we had, what, 24%?
This is when we are selling puts and by doing so we are getting paid for selling points and as the market bounces back up, we are buying it back.
And if we are in a stock, we start selling calls. So having a down market mark, for me that’s not scary. It’s a matter of can you deal with it? And yes, as a trader, you need to have a stomach for this.
I mean, it is not for everybody, right? I mean, this is where we are going back to the Holy Trinity.
If this is not for you, these fluctuations, then consider money market accounts. I mean, right now, you’re not making a lot of money there, but this is where you can’t lose money. Well, you kind of do because of inflation.

Are you ready for the Crypto Crash? In today's video we share our analysis for the high probability of a wider market crash in cryptocurrencies.
For our own portfolio this means that we are looking to secure some profits and position ourselves to take advantage of any discounted levels that present themselves.
Let us know your thoughts in the comments.

NASDAQ 100 STILL SHORTTech stocks have been getting hammered and i still believe the stock market is headed for a big correction. Smart investors are seeing more gains in crypto-currency. We are not seeing anymore stimulus packages thus far and inflation is getting higher month by month. Bond Yields are all on an uptrend. That's a negative correlation with high growth stocks. Looking for a big correction then i could long from there. If we crash guess we all will be rich if you know how to short the market.I did buy the dip thursday but I'm still in my swing sells from (14000-14100) range. Comments and like please. thanks.

NIO - The Rise and Fall-Published a stronger-than-expected set of Q1 2021 results, beating market expectations on both revenue growth and adjusted earnings, driven by surging luxury electric vehicle sales and rising margins. Nio delivered a total of 20,060 vehicles over the quarter, marking an increase of 423% year-over-year, helping revenues rise 482% to around RMB 8.0 billion ($1.24 billion). Gross profit margins were particularly strong, coming in at 19.5%, up from negative 12% a year ago, indicating that the company is getting better and more efficient at producing its vehicles. For perspective, the broader global auto industry sees gross margins of under 10%.
-Although Nio had a relatively solid Q1, the near-term outlook appears muted. While Nio says that it continues to see strong demand, it is facing production issues on account of the global semiconductor shortage, which has hurt the automotive industry particularly badly. Nio says that deliveries for Q2 are projected to stand at between 21,000 and 22,000 vehicles, marking a sequential growth of just about 10% on the upper end.
-Nio stock is priced for robust growth, trading at about 10x 2021 forward revenue, and if the supply crunch in the semiconductor market persists through this year, holding back delivery growth, investors will likely re-rate the valuation of the stock lower.
-Currently with the given market condition our target price for Nio is standing at $30.

GOLD - Ready for the GOLD RUSH?As Market crashes, mine for GOLD Ladies and Gentlemen!
Entry point: Current market price
Stop-Loss: 1,760
Take Profit: 1,880

SPXL - End of the Bubble!After a long positive run full of speculation and non-ending green days, the time has come for stocks to go back to their real values.

SPY should try to reach $430 before it dropsI used the Fib channel to see these target points.
$430 seems to be a major resistance point, might take us few weeks to a month to reach this level.

Massive Double Top? What's next? You decide.Hello everyone,
In my opinion, it's good to be honest with yourself. And if I am being honest, it appears that the S&P 500 may have just printed a massive double top signaling a potential bearish trend in the foreseeable future. Now before you scream chicken little, hear me out. With what's going on in the world there is a lot of uncertainty, and the market does not like uncertainty. If you consider the politics, the unrest, the extreme overvaluation of stocks, the pandemic, the trade wars, the low-interest rates with rising inflation, the devaluation of the USD, and recent stock gurus selling off massive swaths of their positions, like Warren Buffett who recently sold 11 positions, it definitely appears there are a lot more negative factors than positive. If you look at the Warren Buffet indicator, it shows that the total market cap of the stock market is more than 2x the size of the US GDP (209% to be exact). With this factored with the recent announcement of the capital gains hike from 15% to 43% as well as the crypto sell-off where you saw big names like DOGE coin and Bitcoin lost about 25% of their value in the blink of an eye, there are a lot of things to be concerned about. Not to mention that due to the low interest rates, home prices are at all-time highs with a massive shortage of 11 million single-family homes we are entering a massive housing bubble, which may make the 2008 housing market crash look like peanuts. Could this be the perfect storm? I hope not. And this is coming from someone who has a long-term bullish sentiment. We need to be honest here. Is anyone else seeing this or is it just me? And this is just scratching the surface of something that is much broader and worldwide. What will it take? Another COVID resurgence? War? Time will tell.

SPX500 - ED with little throw-over The market has been bunny jumpy and funny over time. If this will confirm and the grand super cycle will end we will see some major correction to the 1800-2200 area. Who will trigger it? Btw retailers have too much fade on the FED, pity. At the time market is very overbought and in the weekly RSI you could see huge divergence on the weekly chart and low volumes but the market keeps going. After all, at least we should correct it very soon and we will see some movement down. If not, then later consequences will be much harder.
Feel free to comment
Good luck guys and stay positive!

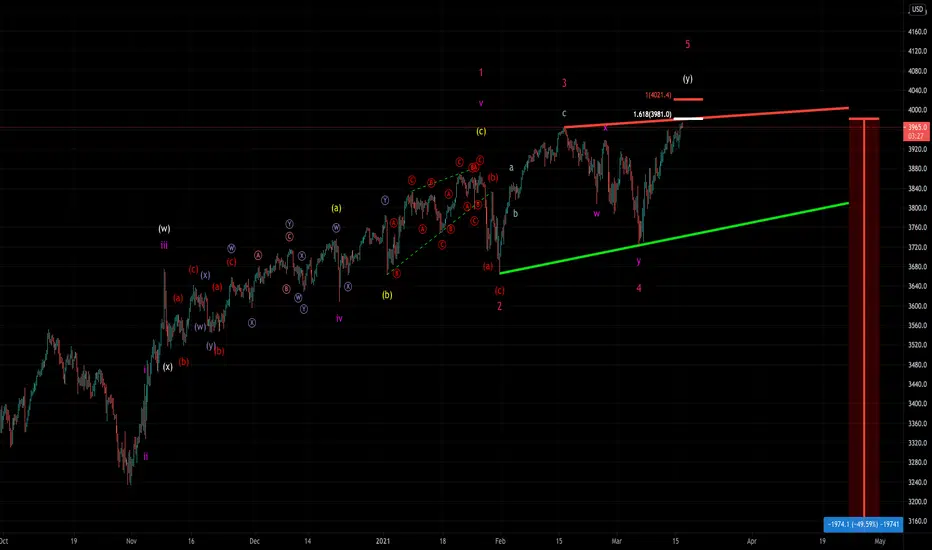
SPX 500 DONE??!As stated before, the recent sell off was nothing but a corrective wave and I was calling for buys when everyone was selling..
I am not saying the market will collapse now but if does then it makes sense and there is enough evidence to support it! On the other hand, more ATH's still makes sense too! It's all about assumptions, biases and having a set up.
My current assumptions:
1- EDT and we are finishing the last Wave. Assuming that means that Wave 1 here is the longest and hence Wave 5 must be shorter than Wave 3 so it cannot under any circumstances touch 4,021.4!!!
2- Wave 5 (primary degree) = 1.618 Wave 1 (Primary Degree)
Disadvantage: Market can still go higher to 0.618 of Wave 1+3 to 4.1k
Invalidation: 4,021.4!
Short term: It can react to this major level and retrace to 3,872 so it can be used as scalping :)
GOODLUCK!
Close Bitcoin Trade (TP SMASHED)Good day guys! I am now closing my bitcoin long positions from 52526.72, 52579.78, 52699.91 & 52762.98 level. We do see this trade going higher, because we noticed PAYPAL just added crypto to the checkout feature on their platform. This is huge! Again, it is always good to book profits and look for the next set up. We believe in actually withdrawing from your accounts not being excited how high price got. This trade did wonders and we know that those who took this signal from us profited tremendously. Be sure to like and comment below on your thoughts and/or if you profited from our analysis. We do appreciate you for checking out our post and remember, we will see you on the other side.
Rodrick (CEO)
Third Eye Traders

It's time to ZOOM OUT and get REALPlease have a look at this chart. Scroll all the way back to 1999.
At present day we are very far above the 50d moving average. It's frightening how high we are.
Bearish divergence from Jan 2020 to present day.
Bearish divergence in 2018, leading to a 20% retracement.
Bearish divergence in 2007, leading to the global financial crisis.
Bearish divergence in 1999, leading to the tech/telecom bust.
History will repeat itself, I think. We are currently in a very worrying position. Look at what these bearish divergences have shown in the past. To return to 50d MA levels would mean a 13% correction for S&P 500. If we fall below that, we should start considering a full blown crash/bear market.

"MOMENTARY" Bitcoin DOOMS DAY Scenario - 6 DAY ChartA friend sent me down the road of looking at the spider charts again, and and kind of spotted something on the 6 DAY Broad View, that has nothing to do with the current situation of course; but it is intriguing, as well as frightening perhaps to some who don't protect their assets with Stop Losses...
This is somewhat of a "what IF" type of scenario... Against some very real possible realities.
On the more grand scale of things with regard to price supports, we really only have a few major supports to catch BTC if a major market crash happened, which many are saying is on the near horizon...
- Even looking at the VPVR; the ranges of support diminishes greatly beyond 12k
- The few stops along the way that I can spot on this chart are:
50k
42k
19k
12.4k
So be ready to by some of that 12k BTC if the markets make a nearly 400% dump.
You will have to act fast as the Fire Sale will only last for minutes or hours at best. Haha!!
I just had to post this for posterity in case it ever happens, so I can say I told you so. LOL!!
Remember, keep your friends close and your stop losses closer!!
CryptDude (CryptDollar)

MARKET CRASH - JUNE 2022 ?Hello everyone
I was doing a research about market crashes in history (what was the reason, what happened next and how it was solved) ...So I read many titles about financial instruments in US (Loans,credit cards,mortgages etc) ...yeah and those freaking BONDS...we have two types of bonds - short-term and long-term..and here comes the trouble. They should go in the same direction. That means if short-term bonds(STB) rise,then long-term bond yields (LTB) should rise as well...so what is wrong ? Every time in history before a market crash these STB and LTB yiels were going in different directions - STB were rising whereas LTB were falling. We can talk about divergence.
Crash Confidence Indicator is in it s highest value since latest market crash in 2007 - that means that many investors believe that market crash is not going to happen... the same scenario was right before 2007 crash
Citi group‘s indicator about euphoria or panic in the stock market is in euphoria sector and is steadily rising
Another indicator..VIX ..is down 28%...that means that fear has crashed
Stocks are expensive relative to 10-year average earnings. We are above number 24 which is much higher than the long-term average of 16.
Relative to GDP,the US stock market looks very expensive
Now look at the chart below. As you can see there is the VIX indicator, SPX (S&P500 index) and 10-y Bond (blue line).
I found interesting correlations between these instruments. As you can see, before every market crash we had scenario when VIX fell and Bonds rised. Afterwards bonds lost their value,VIX skyrocketed and SPX and economy crashed. These days we have a lot of "positive" sentiment in Bonds and we are grateful that VIX is falling...really ? look at the chart...VIX is falling and bonds are rising. From history performance I expect an upcoming market crash in 2022...and in my personal opinion I expect this carsh in the beginning of June.
Take it serious, I am not joking and I put a lot of my time into this research.
Thank you for your time and good luck !
