TRADING PRINCIPLES THAT EVERYONE SHOULD KNOW. PART 2.Hello traders!
Today we will continue to explore the principles that every trader should know and do.
READ THE NEWS.
The impact of news on ALL markets is enormous.
Every news can turn the market against you and break any trading plan.
Read news, professional analytics, reports, any information that may be useful.
You should always be up to date with the latest news in order to correctly assess future movements.
MAKE A TRADING PLAN.
Every trader should have a well-built strategy and a clear plan of action.
Before each trading session, the trader analyzes the market and outlines the possible direction of the market and opportunities for opening positions.
Even before the market opens, you should be ready and know what you will do.
After each trading day, you have to analyze positions and work on mistakes.
BE RESTRAINED AND DISCIPLINED.
Do not give in to emotions.
Don't go into a new position often.
Don't change your mind every five minutes.
Don't forget about the risks!
A good strategy will help you not to drown in this emotional storm.
ACCEPT YOUR LOSSES AND MOVE ON.
There are thousands of profit opportunities on the market every day.
But if you lose all your money in the pursuit of winning back the lost money, you will not have the opportunity to trade for a long time and will not have the opportunity to become a successful trader.
Trading is a long distance where you need to be able to stay on track, be able to accept losses and move on.
Traders, if you liked this idea or if you have your own opinion about it, write in the comments. I will be glad 👩💻
Marketmaker

DeGRAM | EURGBP short to 0.847The currency pair is in a downtrend. The beginning of the third downward wave is forming. I'm waiting for a slight pullback and the continuation of the price drop to support 0.847
-------------------
Share your opinion in the comments and support the idea with Like.
Thanks for your support!

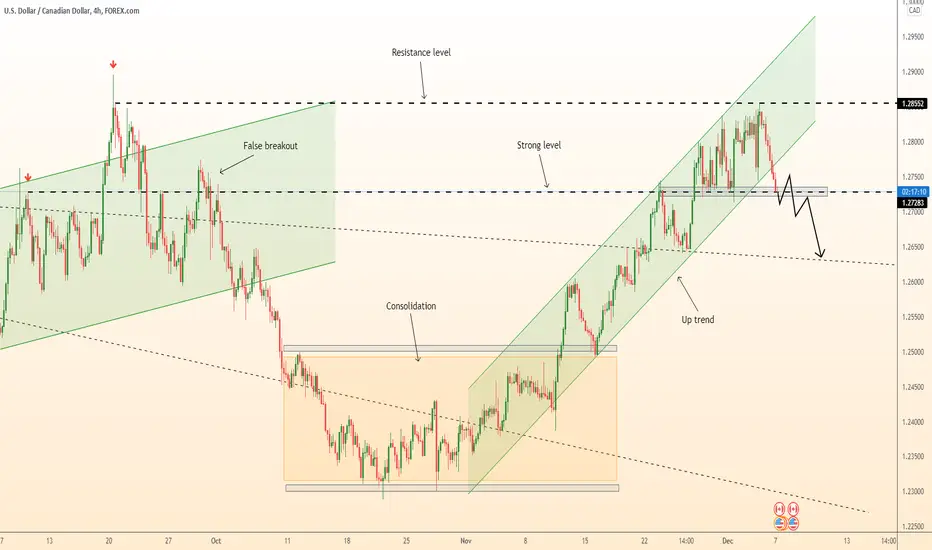
DeGRAM | USDCAD breakout support. Short to 1.263The instrument breaks the ascending channel down and falls to the support level, I think there may be a breakdown of the level, but there should be a slight pullback before the breakdown. I'm waiting for the breakdown of 1.2728 and the price drop to the level of 1.263
-------------------
Share your opinion in the comments and support the idea with Like.
Thanks for your support!
DeGRAM | EURUSD short to 1.1225The currency pair continues to decline, the price zone is quite complex and there is no specific definition of direction. The trend is downward, there is no update of local tops, I think that the local support can be broken and the price fall to the level of 1.1225
-------------------
Share your opinion in the comments and support the idea with Like.
Thanks for your support!
UNSUCCESSFUL vs. SUCCESSFUL TRADERUnsuccessful Trader
You are trading without a Specific Trading Strategy
The main reason for opening positions for you is not clear strategy rules, but your own intuition. And even after several failures, you continue to repeat your mistakes due to the lack of discipline and the lack of a trader's trading journal.
You often over-trade and get Margin Calls
Your instincts make you trade too much, open new positions again and again, forgetting about the risk and thus getting frequent margin calls. Because of such disorderly market entries, you become very emotional, lose control and lose money quickly.
You get attached to Open Positions
Following your own emotions, you often hold on to an open position for too long, hoping that the profit will become even greater, while forgetting about the take profit that you set yourself. As a result, a profitable position becomes unprofitable, and you begin to believe and expect that it will become profitable again, overstaying the unprofitable position.
You're Too Emotional
Your mood changes with every price reversal. Forgetting about the analysis, you often open new positions and lose more than your risk management can afford.
Successful Trader
You have an Effective Trading Plan
You have written on a piece of paper a strategy of actions for any market situation and always follow the rules prescribed in the strategy. You often analyze your trades in a trade journal and always remember your mistakes and hits.
You Understand What Risk Is
You have clear rules of risk management. Even before opening a position, you know how much you can lose in this trade and do not lose more than allowed by the rules of risk management. You don't move your stop loss and you don't act emotionally.
You Control Your Emotions
You clearly follow your strategy, leaving no room for emotions. Even before opening a deal, you have analyzed everything and know exactly what to do – you have a plan of action.
You always fix a part of the profit
You do not forget to protect your capital, so you close part of the position in plus or zero, and let the rest of the position grow further. Now you will not only not lose your money, but you can also earn.
-------------------
Share your opinion in the comments and support the idea with Like.
Thanks for your support!

DeGRAM | GBPAUD short from resistance to 1.8765The currency pair tested the resistance and did not follow the impulse in the continuation of the movement. I am waiting for a consolidation below the level and a fall in the price to support 1.8765
-------------------
Share your opinion in the comments and support the idea with Like.
Thanks for your support!

DeGRAM | EURUSD short to support The currency pair is in a downtrend. At the moment, the resistance level is worked out and after fixing below the level, the price begins to fall. I think that after stopping at the local support of 1.1264, the price will continue to fall to the lower border of the range - 1.1225
-------------------
Share your opinion in the comments and support the idea with Like.
Thanks for your support!

DeGRAM | GBPJPY short to supportThe price does not update local tops after testing support levels. Most likely, the sellers' pressure on the market has not calmed down. I look forward to a fall to a strong level of 149.3
-------------------
Share your opinion in the comments and support the idea with Like.
Thanks for your support!

DeGRAM | GBPAUD long after consolidation. Target - 1.8918The currency pair is in an uptrend and the price breaks the resistance at 1.8765. I look forward to a consolidation above this level and a rise in the price to the next resistance level, which is the key.
-------------------
Share your opinion in the comments and support the idea with Like.
Thanks for your support!

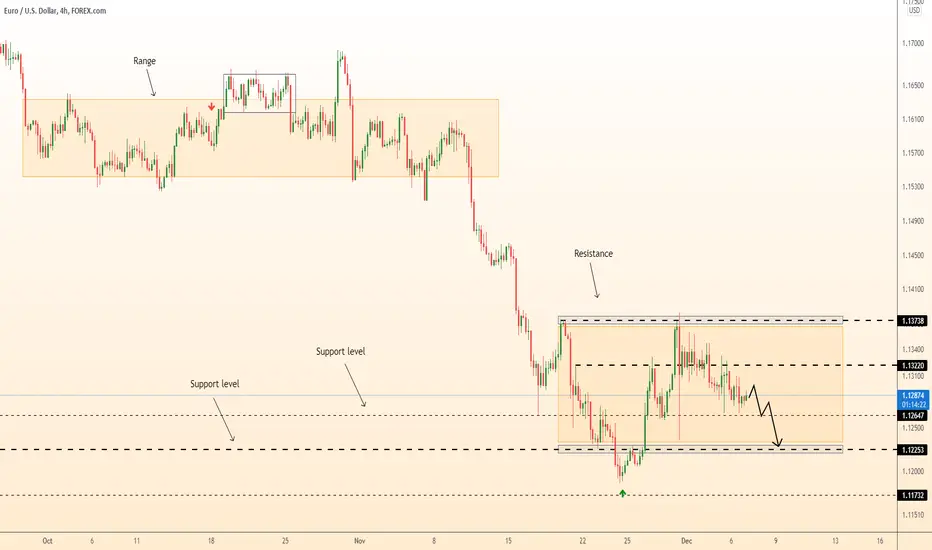
DeGRAM | EURUSD short from resistanceThe instrument in the range above the level of 1.1322 could not gain a foothold, breaks through it and rolls back to the level. I think that from the level the price may fall to support 1.1265
-------------------
Share your opinion in the comments and support the idea with Like.
Thanks for your support!

TRADING PRINCIPLES THAT EVERYONE SHOULD KNOW. PART 1.Hello traders!
For a long time, the Forex market has created a large number of trading methods.
Finding your strategy that suits you specifically is one of the main steps in achieving success in the Forex market.
And it is worth remembering that successful traders do not use anything magical in their trading. Everything has been invented for a long time for both a novice trader and a successful trader.
The main task of beginners is to choose a fairly easy strategy and strictly follow its principles and rules.
So what does a beginner need to know in order to trade profitably?
Price levels.
It is difficult for a beginner to determine price levels and trade them correctly.
There are no specific rules in this topic, since the price does not draw clear points, but forms zones.
Many traders use support and resistance levels in their trading and for beginners, the main task at the beginning of the journey will be the concept of selling from resistance and buying from support.
There are three types of trading systems based on price levels.
1. If the price moves within the framework of a sideways movement, the trader can sell from resistance and buy from support.
2. If there is a prevailing trend in the market, for example, bearish, a trader can sell from resistance and expect support to break through.
3. The same rules work in the bull market, only in a different direction. If the price breaks through the resistance, then this zone becomes a support from which you can buy.
Consider the principles of trading from price levels.
#1 Understanding the market context.
The key to profitable trading from the levels is the ability to correctly understand the market context.
Bearish pressure leads the market movement through an impulse movement that breaks through support and creates new lows – in this context, selling strategies will not work well.
That is why it is so important to follow the concept of the market context:
When the market falls, creating new highs and lows, we are talking about an impulsive bearish context.
The correction is created by an impulse that is weaker than the main trend.
A sideways movement occurs when both demand and supply are approximately equal and the price cannot move in a certain direction.
As soon as the bulls or bears take over, the price will make an impulse in the direction of the strong side.
#2 Top-Down Analysis
The market is ruled by big money, which pays great importance to large timelines.
And it is vital for an ordinary trader to know where smart money is pushing the market.
To do this, it is worth noting strong levels on the monthly-weekly-daily timeframes in order to know exactly where the price is most likely to rebound.
On the other hand, if the price is above the key levels, then the market is bullish.
#3 Candlestick Patterns
Almost every trader uses candlestick patterns in his analysis, which are a very strong analysis tool.
Reversal candlestick patterns create an excellent opportunity to enter a trend reversal.
The higher the timeframe on which the pattern was formed, the stronger its signal will be.
Knowing candlestick formations is a very important part of a trader's professional growth.
#4 Risk Management
Any trader should be aware of the risks and be able to control them.
Although this topic goes beyond the definition of the market context, it is still very important.
There are many ways to control risks.
An important rule is to set a stop loss and risk in each position, as recommended, no more than 2% percent.
Hedge fund managers risk an even smaller percentage in each transaction, sometimes 1% or even lower.
It is better to grow slowly than to fall quickly.
If you lose 2% of the capital, in the next transaction, in order to get your money back, you will already need to make 4%, which in general is not difficult to do.
But if you lose 50%, you will need to make 100% profit already, which is almost unrealistic.
Conclusions
Summarizing the above, you can make the following sequence of actions:
Identify the key support and resistance levels.
Wait for the candle to form in the desired direction.
Stop loss above or below the candlestick pattern.
Take profit is placed at the following support or resistance levels.
Always make sure to use proper money management for each trade, and never take on a risk that exceeds the return.
Traders, if you liked this idea or if you have your own opinion about it, write in the comments. I will be glad 👩💻

DeGRAM | USDCHF short from resistance to 0.9125After a false breakout, the currency pair changes the local trend and continues to fall, breaking through the support levels. The price rolls back after falling to the nearest resistance at 0.922 and consolidates below the level. I expect that after consolidation the price will continue to fall to support 0.9125
-------------------
Share your opinion in the comments and support the idea with Like.
Thanks for your support!

DeGRAM | EURUSD long to 1.1374The instrument begins to recover. In relation to the local support level, the price is consolidating higher, the situation is similar to the emergence of a limit buyer. I think that from the support the price can rise to the resistance of 1.1374
-------------------
Share your opinion in the comments and support the idea with Like.
Thanks for your support!

BEST CANDLESTICK PATTERNSCombinations confirming the reversal of the "bearish trend"
1. Inverted hammer and combinations of hammers. The hammer has a large shadow under the small green body, and the inverted hammer has a large shadow over the small red body. It appears, like all subsequent combinations, at the base of the downtrend, before the reversal.
2. "Bullish harami" consists of two candles: the first with a long red body, which covers the second with a short green body. A distinctive feature is that this model assumes a price gap. The fact is that "harami" in Japanese means pregnant, so if you look closely at the drawing, you will see that the body of the right candle is, as it were, inside the body of the left candle.
3. Short candles in the "star position". A "star" is a candle with a fairly small body, formed after the break with the closing of the previous candle, usually having a large body. Therefore, in this model, the candle should appear at the bottom of the downtrend, have a short body and open with a break down compared to the previous candle. The third red candle with a short body should close above the first candle.
4. "The morning star in the position of three candles." Here, the first candle should be red, which indicates a strong downward movement, the second has a short body and is formed with a gap relative to the first candle, and the third candle is necessarily green, the price of which has increased to at least a value at the level of half the body of the first candle. Ideally, the morning star should have a gap before and after the second candle, but the gap between the second and third candles is rare.
5. A short candle in the "harami" position. This combination is similar to the "bullish harami" that we described earlier, only in this case the second candle is short and red, but it is also located in the body of the first candle. The third candle is necessarily green.
Combinations confirming the reversal of the "bullish trend"
6. "Bearish harami" is the same as "bullish harami", only a long green body should appear first, and a short red body should appear second, and the body of the right candle is absorbed by the body of the first candle. The next candles go out.
7. "Bearish absorption". Here, the first is a short green candle, and the second is a long red one, and if you look, the body of the left candle is inside the body of the right candle. After that, the price decreases.
8. "Shooting star" is a short candle with a missing lower shadow and a very long upper one.
9. The bear cross "harami" is formed when the first candle is long and green, and the second candle ("child") is a "doji".
10. "A three-line star in thought" or in another way "the repulsed offensive of three white soldiers". This combination reflects a gradual steady increase in prices and consists of three candles, the opening price of each of which is located inside or near the previous green body. The closing price of candles is equal to or approaching the maximum prices. If the second and third candles (or only the third candle) show signs of weakening, that is, their bodies gradually decrease or relatively long upper shadows form, then the "repulsed offensive of three white soldiers" model is formed. This pattern should cause particular alarm if it appears after a long uptrend.

DeGRAM | GOLD breakout flat support. Short to 1756Gold is starting to come out of consolidation. Let me remind you that the global trend is downtrend, so I expect the price to consolidate below the broken level and fall to support 1756
-------------------
Share your opinion in the comments and support the idea with Like.
Thanks for your support!

DeGRAM | USDCAD growth from support to 1.285The instrument is in an uptrend. After the breakdown of the resistance level 1.2728, the price consolidates above this level, I think that a false breakdown of the support is possible, a return beyond the level and the price rise to resistance 1.285
-------------------
Share your opinion in the comments and support the idea with Like.
Thanks for your support!

DeGRAM | GBPJPY short from resistance level. Target - 149,3The price is in a downtrend, after a fall and testing of support, a countertrend pullback to the downtrend resistance is formed. The market has a strong dominant position of bears, I do not think that the level can be broken. I look forward to testing resistance and falling prices to support 149.3
-------------------
Share your opinion in the comments and support the idea with Like.
Thanks for your support!

DeGRAM | EURUSD long after consolidation. Target - 1.1374Yesterday's bright move based on news collected the feet of all players. Now the price is consolidating above the previously broken level 1.1322. I look forward to growth after the end of the consolidation to the resistance of 1.1374
-------------------
Share your opinion in the comments and support the idea with Like.
Thanks for your support!

DeGRAM | GOLD breakout flat support. Short to 1771Gold in flat. The trend is downward, inside the flat the local tops are going down, I'm waiting for the breakout of support and the price drop to the level of 1771
-------------------
Share your opinion in the comments and support the idea with Like.
Thanks for your support!

DeGRAM | USDJPY breakout supportAfter the formation of the third wave, the price forms a correction at 100% of its movement. I expect the support level to break down and the price moves to test the support level of 110.865
-------------------
Share your opinion in the comments and support the idea with Like.
Thanks for your support!

DeGRAM | NZDUSD breakout support. Short to 0.675After testing the lower border of the range, the price is not going to roll back, but is consolidating in the continuation of the movement. Waiting for the price to fall to support 0.675
-------------------
Share your opinion in the comments and support the idea with Like.
Thanks for your support!

DeGRAM | EURUSD in flat. short from resistance. The price rolled back to support and returns to retest from support, I do not think that the level can be broken, it seems to me that under the pressure of the downtrend, the price from the resistance can again fall to the level of 1.1264
-------------------
Share your opinion in the comments and support the idea with Like.
Thanks for your support!

DeGRAM | GOLD in flat Gold in flat. Until I see pre-references where the price will go, globally the instrument is in a downtrend. The price is trading between two price levels - 1800 above and 1783 below. I think that locally the price from 1800 will fall to 1783
-------------------
Share your opinion in the comments and support the idea with Like.
Thanks for your support!
