DeGRAM | USDCHF pullback to supportThe currency pair breaks the upper border of the trend and is ahead of the resistance level, which can stop the price.
Waiting for a rollback from the level to support 0.9238
-------------------
Share your opinion in the comments and support the idea with Like.
Thanks for your support!
Marketmaker

DeGRAM | SILVER false breakoutAfter trying to change the trend. which turned out to be a false breakout, the price went down and tested the support at 22.92.
The price made a false breakout of this level and is now trading above the level.
Waiting for growth after consolidation
-------------------
Share your opinion in the comments and support the idea with Like.
Thanks for your support!

DeGRAM | BRENT Long The tool has tested local strong resistance and begins to roll back. After a rollback,
I'm waiting for the price to return to retest the resistance level of 76.13
-------------------
Share your opinion in the comments and support the idea with Like.
Thanks for your support!

DeGRAM | GOLD false breakout levelGold fell by 2.8% in a day, and now the instrument is being bought back.
I am waiting for a return for the level and a rise in the price to the resistance of 1780
-------------------
Share your opinion in the comments and support the idea with Like.
Thanks for your support!

DeGRAM | BTCUSD growth to 50500After consolidating after a strong fall below the support level,
Bitcoin did not go down, broke the upper border and consolidates above the level.
I look forward to growth to the nearest resistance 50525
-------------------
Share your opinion in the comments and support the idea with Like.
Thanks for your support!

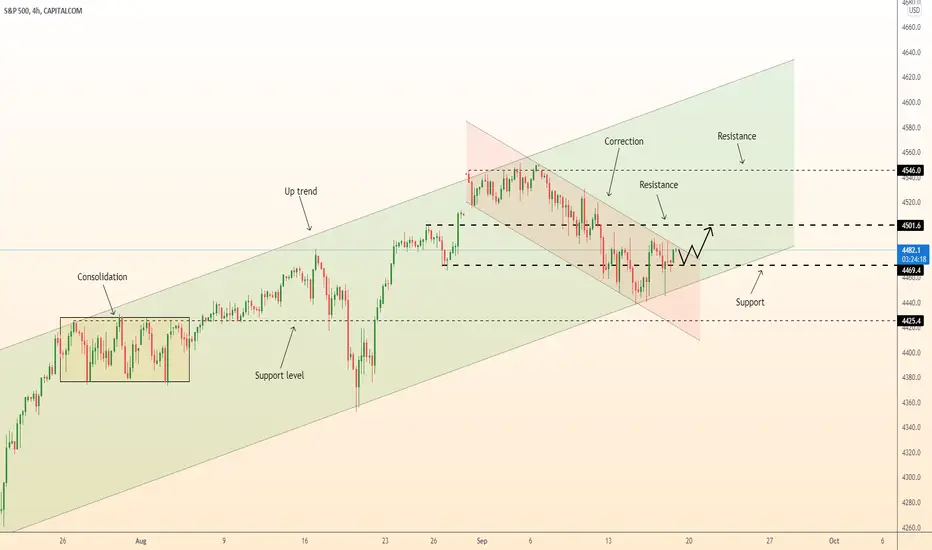
DeGRAM | US500 the end of the correction?Index corrective movement tested the support of the global uptrend.
The level is strong and was not broken, after the test, the price returns to local resistance,
I wait for a breakout with consolidation and subsequent growth to the level of 4501.6
-------------------
Share your opinion in the comments and support the idea with Like.
Thanks for your support!
DeGRAM | EURUSD short to 1.1700The currency pair has tested the channel border and is working out it by pulling back to resistance. I am waiting for consolidation under the resistance and the price drop to the level of 1.17
-------------------
Share your opinion in the comments and support the idea with Like.
Thanks for your support!

DeGRAM | GOLD pullback from supportGold falls after the breakout of the level to support the accumulative flat on increased volatility.
I think that the lower border can stop the price and the instrument will roll back to the level of 1793
-------------------
Share your opinion in the comments and support the idea with Like.
Thanks for your support!

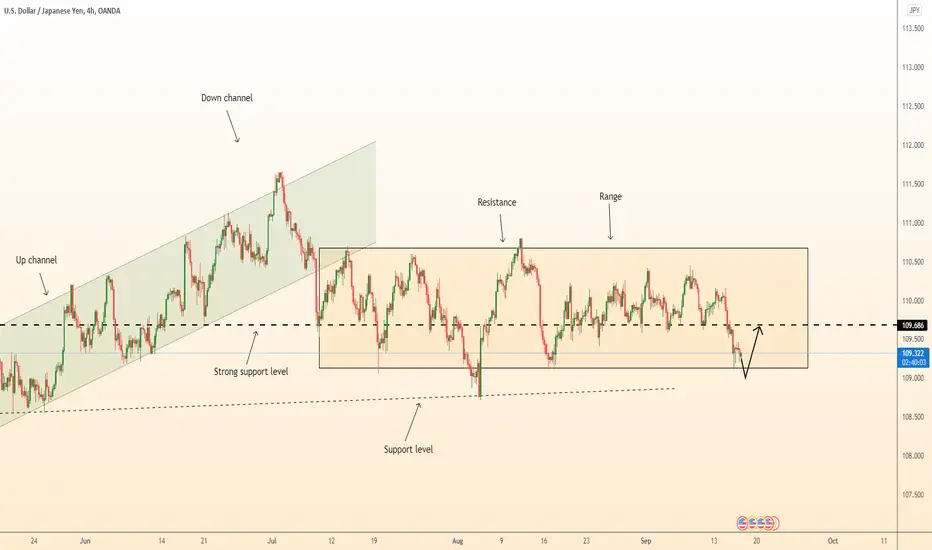
DeGRAM | USDJPY range support testingThe currency pair is moving down to the support level of the range.
The level is quite strong and the trend is neutral. Looking forward to growth from 109.1 to 109.68
-------------------
Share your opinion in the comments and support the idea with Like.
Thanks for your support!
DeGRAM | GBPUSD in flatThe instrument is in flat.
The range is narrow and it is quite difficult to trade it; all that remains is to wait for the price to exit accumulation.
I'm waiting for a slight rollback to the border of the descending channel and growth from the level to 1.388
-------------------
Share your opinion in the comments and support the idea with Like.
Thanks for your support!

DeGRAM | EURUSD breakout support The currency pair is gaining energy in order to break through the support level.
After a false breakout, there is practically no reaction, it was returned back to the retest level.
Waiting for the price to fall for the level to the support of 1.17
-------------------
Share your opinion in the comments and support the idea with Like.
Thanks for your support!

DeGRAM | GOLD false breakout?For gold, there is a shake-up of the relative boundaries of the accumulative flat.
I'm waiting for the local peak to be updated and the price return to accumulation and fall to the level of 1792
-------------------
Share your opinion in the comments and support the idea with Like.
Thanks for your support!

DeGRAM | AUDUSD long from support levelThe currency pair rolls back to support 0.729. Earlier, the downtrend channel was broken to the long side in an attempt to change the trend to an upward one.
I expect that under the pressure of buyers the level of 0.729 will be so important that the price will rebound from it into a long one and the uptrend will continue.
-------------------
Share your opinion in the comments and support the idea with Like.
Thanks for your support!

DeGRAM | EURJPY short after pullback The instrument breaks through the support with the impulse and trades below the level, in the short zone at the moment.
I'm waiting for a rollback to the level, consolidation and a further price decline from 129.6 to support 128.3
-------------------
Share your opinion in the comments and support the idea with Like.
Thanks for your support!

DeGRAM | EURUSD breakout support The currency pair does not react to a local false breakdown of the base, it returns to the retest of the 1.18 level.
I am waiting for the breakdown of this support and the price decline to the level of 1.17
-------------------
Share your opinion in the comments and support the idea with Like.
Thanks for your support!

DeGRAM | NZDUSD shake-upA shake-up in the currency pair gave an impulsive movement to a long one, which broke through the resistance and at the moment the price consolidates above this level,
I suppose that the mood of the market is long at the moment.
I look forward to growth at the end of consolidation to resistance - 0.731
-------------------
Share your opinion in the comments and support the idea with Like.
Thanks for your support!

DeGRAM | GBPUSD in rangeThe instrument, after the breakdown of the upper border of the price channel, went into a sideways range,
I think that for some time the price will move from the upper border to the lower one and vice versa.
-------------------
Share your opinion in the comments and support the idea with Like.
Thanks for your support!

DeGRAM | EURUSD short The currency pair is within the range, after testing the upper border, it falls and has passed half the potential distance.
At the moment, support levels are being worked out, but I think that this will not give a big reaction.
There is selling pressure in the market and therefore I expect the price to fall to the support level of 1.17
-------------------
Share your opinion in the comments and support the idea with Like.
Thanks for your support!

DeGRAM | GOLD Short Gold is consolidating without strong pullbacks. Selling pressure in the market. I'm waiting for the price to go down and fall to the key level - 1767
-------------------
Share your opinion in the comments and support the idea with Like.
Thanks for your support!

DeGRAM | EURGBP is not ready to go upThe price returned after the shake-up and consolidation above the level back to the level, the market is not ready to buy out the instrument.
I look forward to a fall after consolidation.
I am interested in the support level 0.85
-------------------
Share your opinion in the comments and support the idea with Like.
Thanks for your support!

DeGRAM | GBPJPY buyer's pressure on the marketThe tool is fixed above the resistance level.
The level is strong enough and after a long struggle the players have finally decided.
I expect the price to rise from level 151.9 to resistance 153.5
-------------------
Share your opinion in the comments and support the idea with Like.
Thanks for your support!

DeGRAM | EURUSD in range The currency pair is in a sideways range.
The upper border of the range is being worked out and the price falls towards the lower one.
Local support is on the way,
I expect a small rollback followed by the continuation of the downward movement to the level of 1.17
-------------------
Share your opinion in the comments and support the idea with Like.
Thanks for your support!

DeGRAM | CADJPY keep falling The currency pair is starting to work out the support level, but I think that the consolidation has not been completed yet, the consolidation phase continues. I look forward to a fall after this stage to the support level 85.55
-------------------
Share your opinion in the comments and support the idea with Like.
Thanks for your support!
