PCC & QQQ: PUT TO CALL RATIO / MARKET BOTTOM NEARING???DESCRIPTION: In the chart above I have included an overlapping analysis of PCC which is a PUT TO CALL RATIO INDICATOR & QQQ a LEADING INDEX in the OVERALL MARKET.
POINTS:
1. A PUT TO CALL RATIO LEVEL OF 2:1 HAS ALWAYS BEEN INDICATIVE THAT A MARKET BOTTOM IS NEARING OR IN.
2. MACD is has officially shown a complete flip in buying to selling pressure by touching +0.1 and falling closer to -0.05.
3. RSI is showing a distinct decline seen in past market bottoms.
IMO: With an overabundance of overall bearish market sentiment and spikes being seen in PUT TO CALL RATIO INDICATORS FOR EQUITIES & INDICES it should be safe to bet that market bottoms occur when the majority of retail investors are buying PUTS as MARKET MAKERS would not allow their CONTRACTS to EXPIRE IN THE MONEY.
SCENARIO: Continuous spikes to 2 POINTS for PCC and above is most certainly a sign that a MARKET BOTTOM is in the making already.
FULL CHART LINK: www.tradingview.com
USI:PCC
NASDAQ:QQQ
Marketmaker

BTCUSDT - Who is next to liquidate? Guess or Chess? Hallo to all. Here, we present something we wanted to share publicly, since we started the development of the Liquidations Levels indicator, 1.5 year ago.
We think it is useful, because It has to do with the accuracy of the result and the indicator.
We compare what you might think it happened (when using the indicator) with the reality, what really really happened in the charts.
To be honest: The accuracy of the results was always a question inside our mind. If we couldn't validate the calculations in reality, then the indicator is useless or it might lead to misunderstanding or, worse, misinterpretation.
Some things first:
The indicator is trying to calculate the other traders large over-leveraged positions at the time they opened, plot them in the chart exactly when they opened and to track the pair Price Action (recaction) for these.
The Market Maker, is always, hunting these positions and is trying to create Max Pain for these type of positions, by hitting them, usually in bunches/groups of them, with wicks or aggressive moves.
Liq Levels calculations: In order to do the correct calculations, we were forced to make (like on every algorithm) some mini-assumptions about the calculations.
It's like the Fast Fourier Transform sampling (FTT) coming from the Signal Processing Theory, we have learned in Communications on University, many years ago.
The sampling , the interval , the period are extremely important parameters. Especially here, for each parameter, even a change of 0.01 percent will lead to different results. So we must be accurate.
So... The 1 million dollars question: Does the indicator shows real liquidations? Is the MM actually liquidate trades positions in the indicators levels we have calculate?
Can we trust the indicator in the Trading View?
The answer is YES. It is a 100% validation.
After a long time, we have finally managed to plot all the real time liquidations that happened in Binance Futures pairs, directly in the chart. These data are collected by the official feed from the Binance API.
So, every green "X" you see in the following chart, is a single liquidation of a Long Position and every red "X" is the liquidation of a Short Position. On the same chart there are also plotted the Liquidation levels indicator with their lines. I think the chart speaks for it self.
Where the liquidation levels plot a line, and when the price went there finally, there exactly, the liquidations happened.
The validation of Liquidation Levels with the real liquidations:
If someone asks me, about what will be the next move, I will answer to him/her with something else:
Noone knows (except the MM), but with the use of the liquidation levels indicator, you can help yourself, and transform your trading style, from a Guess game, to a Chess game. Use your mind, evaluate the situation, and think like the MM.
What you will do next?
This will be another story to analyze.
Best regards to all,
the Mobility in Life Applications TEAM
(developers of the Liquidations Levels indicator)

ES1! RALLIES & FALLS (UPDATE)DESCRIPTION: In the chart above I have provided an updated version of my previous chart for ES1! .
POINTS:
1. Price Action has broken previous pennant and fallen into a consolidation phase.
2. Breaking through this consolidation phase would either require breaking 3900 to the upside or 3800 to the downside.
Current Fall Percentage = -9.47%
Current Fall in Points = -1585
Average Fall Percentage = -14.63%
NOTE: *Highlighted Channel 3800 - 3900 is current price action range where DIX HAS SHOWN TO SPIKE THE MOST.
CME_MINI:ES1!

XAUUSD UPDATE Hello traders
I think that the gold correction has completed and another bullish impulse wave has begun

Is YOUR Broker Regulated? Find out hereHere is a list of eight of the main financial regulatory agencies that are backed with strict regulatory enforcement in other countries…
You’ll need to make sure the broker you choose is approved by one of the below.
South Africa (FSCA) - The Financial Sector Conduct Authority
USA (SEC) – Securities And Exchange Commission
Eurozone (MiFID) – Markets In Financial Instruments Directive
UK (FCA) – Financial Conduct Authority
Australia (ASIC) – Australian Securities and Investments Commission
India (SEBI) – Securities and Exchange Board of India
Japan (JSDA) – Japan Securities Dealers Association
Switzerland (FINMA) – Swiss Financial Market Supervisory Authority
Am I missing any? Let me know in the comments :)
Trade well, live free.
Timon
MATI Trader
Financial trader since 2003

How to Choose the Right Broker -10 pointsHere’s a list you may follow to help with your decision.
My top 10 list to choose the best broker
1. Only choose reputable brokers that are regulated and recognised by the main financial regulatory bodies. (See answer to question two for the list of financial regulated authorities).
2. Find a broker who offer a list of trading instruments that you prefer i.e. shares, CFDs, Spread trading or futures.
3. Make sure their cost fees are low and their withdrawing and depositing structure takes place within three working days.
4. Make sure they are insured and deal with the top banks in the world and don’t run their own finance firm where they can take your money and run.
5. Go onto Google or ‘Hello Peter’ and read as many reviews from REAL people to see their experiences.
6. Browse through their website and read through everything before you decide whether they are for you or not.
7. Avoid any broker who promises any too-good-to-be true returns or are very marketing orientated – most times these are scams…
8. Analyse their portfolio growth they’ve achieved for their clients over the last five years. This will help you see their consistency or even the validity of what they have to offer.
9. Choose a broker who meets your trading needs i.e. trading platform, available markets, trading indicators, economic calendars and even copy-trading plug-ins.
10. Make sure the broker you choose is able to help in terms of customer service needs, trading education, live videos and even trading events for their clients.
If you found this useful, let me know in the comments.
Trade well, live free.
Timon
MATI Trader
Financial Trader since 2003

BTCUSD: Wyckoff Accumulation on the 4HIt looks like the market makers performed a quick Wyckoff Accumulation phase on the 4H of BTCUSD.

Market stagnation before the retraceDue to low liquidity during the weekends we are going to see most likeley not much action on the Market.
We have 2 Major Liquidity Zones that should be recovered on Sunday evening latest Monday.
Expect a retrace to 16445USD
Short orders are favourable.
Another possibility is before retracing to the 16445USD zone a touch of the 800EMA before we retrace.
Wait and observe the behaviour, on Sunday latest monday we will know more about the market intentions.
Stay calm and wait for the liquidity to come into the market.
Enjoy the weekend.

False Rally to upside to recover liquidity vectors and crashWe have two un-recovered vector candles that represent ranges where the market maker plans to bring price action back to in order to recover liquidity.
And then continuation to the downside and lower lows.

Markup Markdown patternFrom where we are now, I anticipate a pump to at least 17.1 and could go up to 17.4k then down to complete pattern.
Immediate long opportunity and then a short that could ride a larger drop

US100 Weekly breakdownA more in depth video is coming based on this breakdown, the week was comfortably bearish on Nasdaq. From Tuesday we have been getting a lot of proper displacements creating FVGs that gave us clear opportunities to go short, but Wednesday's trading session was most lucrative and the move was quite easy to catch.

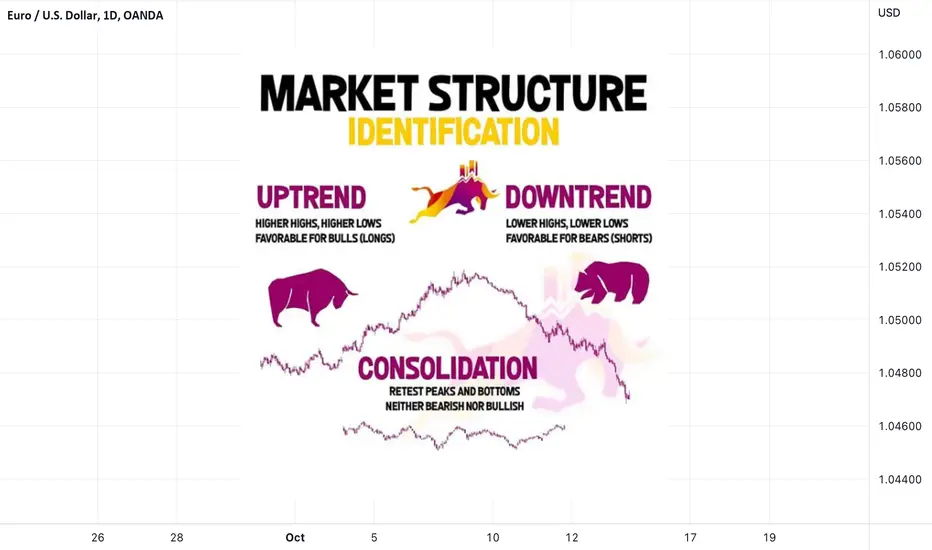
Market Structure Identification ✅Hello traders!
✅ MARKET STRUCUTURE .
Today we will talk about market structure in the financial markets, market structure is basically the understading where the institutional traders/investors are positioned are they short or long on certain financial asset, it is very important to be positioned your trading opportunities with the trend as the saying says trend is your friend follow the trend when you are taking trades that are alligned with the strucutre you have a better probability of them closing in profit.
✅ Types of Market Structure
Bearish Market Structure - institutions are positioned LONG, look only to enter long/buy trades, we are spotingt the bullish market strucutre if price is making higher highs (hh) and higher lows (hl)
Bullish Market Structure - institutions are positioned SHORT, look only to enter short/sell trades, we are spoting the bearish market strucutre when price is making lower highs (lh) and lower lows (ll)
Range Market Structure - the volumes on short/long trades are equall instiutions dont have a clear direction we are spoting this strucutre if we see price making equal highs and equal lows and is accumulating .
I hope I was clear enough so you can understand this very important trading concept, remember its not in the number its in the quality of the trades and to have a better quality try to allign every trading idea with the actual strucutre
GBPUSD H1 potential short positionHi
As chart
If price breaks out of the below supply zone (red block below)
Uptrend has momentum to continue rising
But it has possibilities to meet selling pressure since there is a resistance zone that hasn't been successfully broken since 9/22 decline.
When price hits the upper supply zone and there is a "clear bearish singal" could be bearish engulfing, evening star... so on
I'll consider placing short position for short term
After all, it has gone up for a while
RR 1:2 but depending on the situation
DXY drops and there is a new UK minister, unsure what policy he will do on currency.
UK also took office as a new prime minister, and he doesn't know what policy he will have on the currency.
All are personal opinions, not investment advice,
all suggestions and feedback are welcome!

Market Maker Pattern with Multiple Long / Short TradesIf this Market Maker pattern plays out in symmetry to the left side, which is more visible even on the 5m chart, then there will be several long opportunities and several short opportunities with opportunity to either reverse positions right into the next drop or retrace. There is also a large red candle on the left side, seen on linked chart of 30m timeframe, that was only partially recovered and these red candles typically always get recovered by a corresponding green candle to the right side of the chart. Thatt gives additional strength to the idea that price will return to previous high of the structure to reclain the red candle. And each of these drop and recoveries is a significant percentage move, ranging from 9% to 30% and with 20x leverage that could make for a fairly safe and profitable series of plays.
Of course, these patterns don't always play out completely symmetrical, but even if it fulfills a few of the moves or does so in smaller proportion to the moves on the left side, it's still a solid opportunity due to likelihood of move to upside to reclaim red candle and then likelihood of fulfillment of at least approximate fulfillment of the markdown / drop phase of the pattern.

BTCUSD H1 Potential short positionpersonally tend to place short position at the higher supply zone (is given on chart)
The finance market's volatility also impacts cryptocurrencies e.g., DXY
So place orders only if apparent signal appears
when price hit supply zone and appears bearish signal then try short position (could be bearish engulfing, evening star...so on)
All data are given on chart
Just personal sharing, not investment advice.
Any suggestions and feedback are welcome!

LUNC about to rocket as MM in controlThere is a huge amount of BUY LIMIT stop losses on top. I expect reaccumulation of long position and rocketon 80%

EURJPY H4 potential short positionAfter retracement, price goes upside and is close to previous H(9/22)
but the upward momentum has slowed down
and it is close to HTF supply zone( is given on chart) which is also 8 years high
If the price goes up to supply zone
and bearish signal appears, consider entering the short position
SL: 145.8
TP1: 143.03
TP2: 142.60
TP3: upper edge of the demand zone which is141.1
(short is still against the current trend, please evaluate carefully)
all are personal opinions, not investment advice.
any suggestions and feedback are welcome!

BTC DOMINION COULD BE ON SELL NEXT BTC DOMINION OPTION
Hello traders this market could be facing selling part to Bull alt market next
According to wave counting, wave 1 and 2 is done and now Wave 3 and 4 is the following plans if it is going to work out for me, I think we are in a complex correction for the next wave. If we look at the corrections A and B is done, Wave C is forming an ending diagonal ( WEDGE.
Let us wait till it is complete and see if the bearish can continue

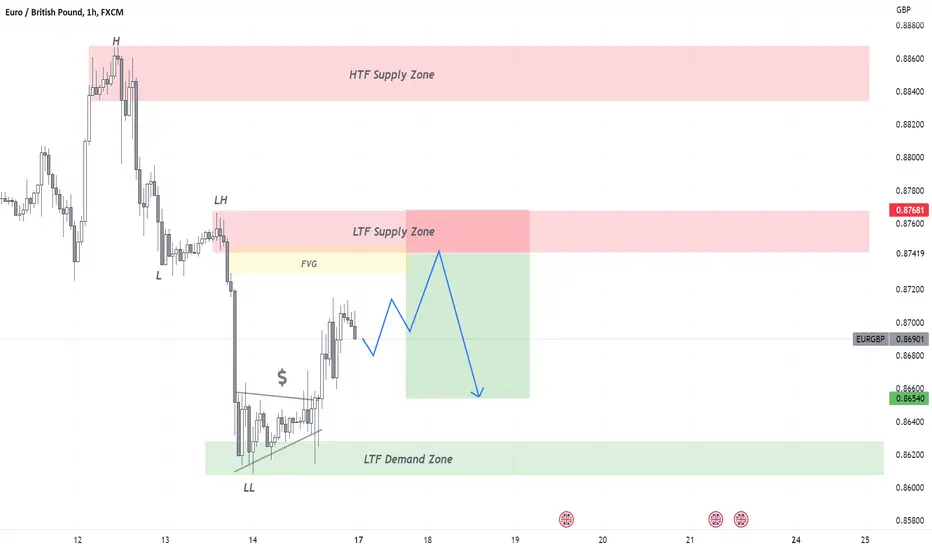
EURGBP H1 Potential short position After price plunged, the demand zone is formed
price gradually went higher, keep forming LH
If continue to go uptrend and hit supply zone which is 0.8743-0.8768
"try short position only if K bars appear bearish signal"(LTH)
SL upper edge of SL supply zone
TP 0.8654
All are personal opinions, not investment advice,
any suggestions and feedback are welcome!
EURJPY LONG IDEAHello Dear Traders.
My idea on Eurjpy with layered and incremental TP levels. Follow your own R:R:R rules and do not trade blindly.
And please, do not forget that we are retail traders, with limited access to the right tools like banks. So, we have to adjust our Stop loss levels far away from the most predictable areas in order not to be heat. We have to provide space for our traders to breathe and evolve in such a way that it will definitely end up giving profit hit even of few pips e.g. 30. I am not fond of huge R:R:R if the SL is pretty close to a support and the price grabs the liquidity trapping us and then reverses on the way to TP.
Good luck1!

Stop using bullish/bearish - how markets work - pt.1Stop using the words bullish and bearish in trading, these are emotion-based terms, add these terms to your vocabulary instead:
1. Accumulation
2. Distribution
3. Mark-up
4. Mark-down

AUD/USD sell continuation with NZD/USDHello traders
AUD/USD is expected to follow NZD/USD for the bear rally. Traders should start watching for these two pears next week and also look for a way in joining the selling market.
Thanks

BTC D short-term ideaHi
this is my idea about BTC for few days
since the August CPI announcement, the percentage of downtrend after important data releases (at least for now)
has been getting littler
(9/13→August CPI)
(9/22→FED Interest rate releasing)
(10/7→FED Non-farm Payrolls)
***but the Sep CPI announcement on the coming Thursday should impact prices (just a matter of how big)***
BTC price has been in an uptrend tunnel since 9/21
continue to make HL,
even NFP impacted, the price stopped falling once it hit demand zone (is given on chart)
if uptrend tunnel is still valid after CPI announcemt (10/13),
I will consider finding a bullish entry point that should be found in LTF and match demand zone is better (LTF & HTF''s demand zone)
TP set at the lower edge of supply zone (is given on chart as well)
that's is just personal opinion, not investment advice
any suggestion and feedback are welcome!
