"Crypto Charts Whisper—Are You Listening?"As I’ve mentioned before, the market is manipulated. In a previously published idea, “VSA vs BTC: Into a Bearish Scenario or Not?”, this manipulation becomes obvious. The big players—whales, institutions, banks—are deliberately engineering traps to absorb liquidity from uninformed retail traders, boosting their profits and power.
Some informed retail traders like you and me understand that behind these entities are teams of insiders and highly trained traders operating around the clock—24/7, 365 days a year. That’s what it takes to survive in such a demanding environment.
This is especially true in the crypto market, which—despite its explosive growth—is still a baby in terms of total market cap. That’s why price fluctuations are so extreme, whether it’s Bitcoin, Ethereum, or altcoins.
Many of you who have been in the space since the early days already know: Bitcoin is the king. As the first coin built on cryptography, Bitcoin leads the way—and where it goes, altcoins follow. These movements often align with changes in Bitcoin Dominance.
So, yes, Bitcoin is the king—but its movements aren’t random. Bitcoin follows rules, and these rules are shaped by data—especially macroeconomic data. One major example is the Consumer Price Index (CPI), released monthly by the U.S. Department of Labor and Statistics.
And here's the key: the big players often have early access to this kind of information. They prepare accordingly—days before the official release—and when the data hits, they move the markets up or down. Even whales don’t act on gut feelings. They follow a framework.
We, as retail traders, must adopt a similar approach. We may not have insider access, but we do have knowledge—and with an open mind, we can act in advance.
As I’ve emphasized before: learning to read Market Structure lets you decode not just market psychology, but also the intentions of the big players. Their large positions leave footprints, just like a ship cuts a path through water. That trail is visible—for those who know where to look.
If you study volume correctly, you’ll start to notice certain zones that keep coming back. That’s all I’ll say—for now.
Unfortunately, many traders rely blindly on strategies like swing trading, expecting price to react at predefined swing highs or lows. But this rarely happens on schedule—especially in crypto. Yes, swing highs and lows exist—that’s the nature of all markets—but in between those levels, the big players create hidden structures that act as signals.
These aren’t just random formations—they’re part of how the big players "communicate" with one another. First, to maintain balance within their own circles. Second, to create FOMO and trap emotional retail participants.
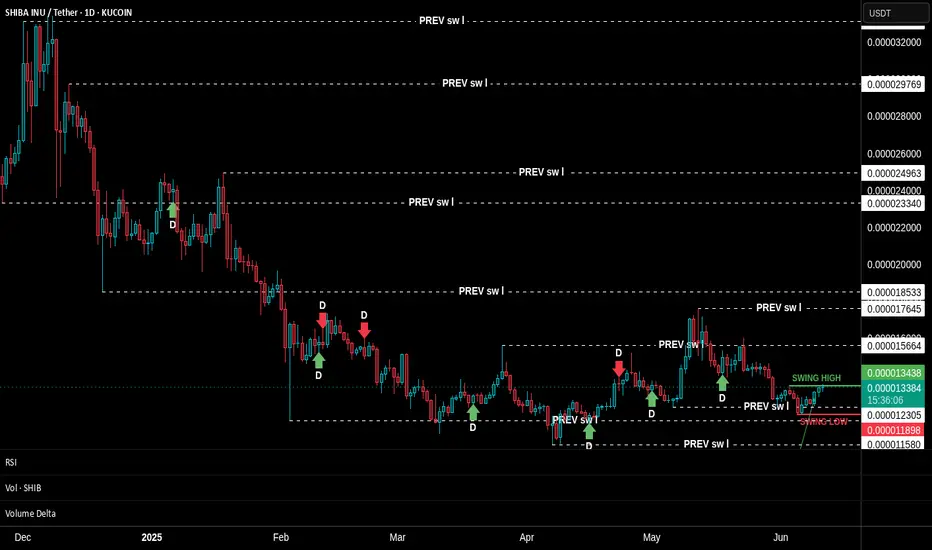
Look at the SHIBA INU chart I’ve shared. This technique is unfolding in real time. Do you notice how the structure is compressing? How price and new swing levels are squeezing in? Look closer at the footprints I’ve highlighted—some of those levels are being respected and reused in the future.
We’re taught from childhood that "we can’t know the future." But is that really true? Repetition of such beliefs is common—worldwide. But again, is it true? I think not.
Think about this: if you drive a car full-speed toward a wall and don’t brake, what happens? You crash. Isn’t that a form of future reading? It’s based on logic, observation, and probability. The same tools we use in market analysis.
So, I hope my words challenge your thinking.
📅 As of this writing (June 11, 2025), Bitcoin is trading at $109,588.
Today’s candle still has about 17 hours left to form, and price action on the daily timeframe is sitting within a previously established supply zone. Bulls and bears are clashing here. But zoom in: what's happening on the lower timeframes? Which signals have been tested, and which haven't?
Are we about to see a breakthrough above the all-time high?
Could this be the launch of the next leg of the bull run?
Marketmechanics
Do we near to another crisis?Dear All
As you see this is the Will5000PR to GDP Ratio !!! I think it is clear that we are so close to another crisis in USA and afterward whole world Markets !!!
Maybe it is time to take care of your money !!!

Market Vs Gold - MYTH BUSTEDAfter Russia started the invasion of Ukraine on 22-Feb-2022, Nasdaq increased 17% and then fell 31% (until 10th Oct 2022)
Precisely during the same date range, Gold rose 9.75% and then fell 21.94% - in Sync with Market
Similarly, once Israel Hamas war started on 7th Oct 2023, Nasdaq had a mourning for 2 days (fell down) and then had no stop rise of 47%
During the 2 days of "Mourning" - Gold rose for 2 days, then fell for 2 days and then rose 35% until 15 Jul 2024
Both Market and Gold Fell down together and Went up Together forming a beautiful Rounding Bottom Breakout
Then How are we saying Gold is a Safe Haven and when Markets Tumble, Gold will increase ????
Who is propagating this misinformation? And we have been blindly believing these Guys without doing our own Analysis for ages
These might have the fact during the World War II era or late 20th Century... But Grow up - the market is not the same 1 Century ago
Learn what is the Current Trend and Follow it. First thing - UNLEARN the Baggage that each of you are carrying (Traditional Knowledge which is no longer valid)
Disclaimer:
Stocks-n-Trends is NOT registered with SEBI. We do not provide Buy / Sell recommendations - rather we provide detailed analysis of how to review a chart, explain multi-timeframe views purely for Educational Purposes. We strongly suggest our followers to "Learn to Ride the Tide" and consult your Financial Advisors before taking any positions.
If you like our detailed analysis, please do rate us with your Likes, Boost and share your comments
-Team Stocks-n-Trends

75: Silver Analysis: Is it Lagging Behind Gold?Silver, often considered the "poor man's gold," has been under scrutiny lately as it seems to lag behind its more illustrious counterpart. Traders and investors are closely monitoring silver's behavior relative to gold, seeking potential opportunities amidst this divergence. Let's delve into the technical analysis to discern potential trading scenarios.
Currently, silver is hovering around the $24 mark, displaying a notable gap in performance compared to gold. This gap prompts us to consider whether silver is presenting a buying opportunity or if further downside is expected.
Long Entry Points:
Primary Entry: A compelling long entry presents itself around $23.37, where historical support levels align. This level could serve as a strong base for a potential bullish reversal.
Secondary Entry: For more conservative traders, a secondary entry around $20 offers an additional opportunity. This level provides a wider margin of safety but may require patience as price action stabilizes.
Potential Scenarios:
Bullish Continuation: If the support at $23.37 holds firm, we anticipate a bullish continuation towards $30 and beyond. This scenario would validate the long positions and affirm silver's potential to catch up with gold.
Bearish Breakdown: However, if $23.37 fails to hold, a deeper retracement towards $15 becomes a possibility. Traders should closely monitor price action and consider implementing risk management strategies to mitigate potential losses in such a scenario.
silver's divergence from gold presents both challenges and opportunities for traders. With long positions eyed around $23.37 and a secondary option near $20, traders can capitalize on potential bullish reversals. However, vigilance is crucial, as a failure to hold support may result in further downside towards $15. Ultimately, a successful hold at support levels could pave the way for a rally towards $30 and beyond.
As always, traders are advised to conduct thorough research, manage risks prudently, and adapt to evolving market conditions. Stay tuned for further updates as we navigate through the intricacies of the market. Happy trading!

$ETH 💎💎💎I'm seeing a diamond pattern on $ETH. From my knowledge where diamonds enter they in most cases exit. I still think there is a small possible bounce to the highlighted circled area around the 1770 area then down. My thought is that the price target down is between the 2 green horizontal lines at 1650-1625 area with a possible extension down to the 1580 area. Why I say the possible extension is that is where the last real push to its current price came from and before the market moves to new destinations whether higher or lower it usually retest old break outs. I will go further into my future thoughts after this move is completed. If it plays out exactly I think we may have a nice move before things possibly get nasty again.

XRPUSD Daily Breakdown Wed.Mar.23.2022Please like and comment as it pushes me to keep creating content on pairs and my bias on it :) -This is merely MY outlook and not advice on what YOU should do just my opinion on what I see - yonsfx

XRPUSD Daily Breakdown Tues.Mar.22.2022Please like and comment as it pushes me to keep creating content on pairs and my bias on it :) -This is merely MY outlook and not advice on what YOU should do just my opinion on what I see - yonsfx

XRPUSD Daily Breakdown Mon.Mar.21.2022Please like and comment as it pushes me to keep creating content on pairs and my bias on it :) -This is merely MY outlook and not advice on what YOU should do just my opinion on what I see - yonsfx

WEEKLY FOREX OUTLOOK SUN.MAR.20.2022 - FRI.MAR.25.2022Please like and comment as it pushes me to keep creating content on pairs and my bias on it :) -This is merely MY outlook and not advice on what YOU should do just my opinion on what I see - yonsfx

XRPUSD Daily Breakdown Fri.Mar.18.2022Please like and comment as it pushes me to keep creating content on pairs and my bias on it :) -This is merely MY outlook and not advice on what YOU should do just my opinion on what I see - yonsfx

XRPUSD Daily Breakdown Thurs.Mar.17.2022Please like and comment as it pushes me to keep creating content on pairs and my bias on it :) -This is merely MY outlook and not advice on what YOU should do just my opinion on what I see - yonsfx

XRPUSD Daily Breakdown Wed.Mar.16.2022Please like and comment as it pushes me to keep creating content on pairs and my bias on it :) -This is merely MY outlook and not advice on what YOU should do just my opinion on what I see - yonsfx

XRPUSD Daily Breakdown Tues.Mar.15.2022Please like and comment as it pushes me to keep creating content on pairs and my bias on it :) -This is merely MY outlook and not advice on what YOU should do just my opinion on what I see - yonsfx

WEEKLY FOREX OUTLOOK SUN.MAR.13.2022 - FRI.MAR.18.2022Please like and comment as it pushes me to keep creating content on pairs and my bias on it :) -This is merely MY outlook and not advice on what YOU should do just my opinion on what I see - yonsfx

XRPUSD Daily Breakdown Sun.Mar.13.2022Please like and comment as it pushes me to keep creating content on pairs and my bias on it :) -This is merely MY outlook and not advice on what YOU should do just my opinion on what I see - yonsfx

XRPUSD Daily Breakdown Sat.Mar.12.2022Please like and comment as it pushes me to keep creating content on pairs and my bias on it :) -This is merely MY outlook and not advice on what YOU should do just my opinion on what I see - yonsfx

XRPUSD Daily Breakdown Fri.Mar.11.2022Please like and comment as it pushes me to keep creating content on pairs and my bias on it :) -This is merely MY outlook and not advice on what YOU should do just my opinion on what I see - yonsfx

XRPUSD Daily Breakdown Thurs.Mar.10.2022Please like and comment as it pushes me to keep creating content on pairs and my bias on it :) -This is merely MY outlook and not advice on what YOU should do just my opinion on what I see - yonsfx

XRPUSD Daily Breakdown Wed.Mar.9.2022Please like and comment as it pushes me to keep creating content on pairs and my bias on it :) -This is merely MY outlook and not advice on what YOU should do just my opinion on what I see - yonsfx

XRPUSD Daily Breakdown Tues.Mar.8.2022Please like and comment as it pushes me to keep creating content on pairs and my bias on it :) -This is merely MY outlook and not advice on what YOU should do just my opinion on what I see - yonsfx

XRPUSD Daily Breakdown Mon.Mar.7.2022Please like and comment as it pushes me to keep creating content on pairs and my bias on it :) -This is merely MY outlook and not advice on what YOU should do just my opinion on what I see - yonsfx

WEEKLY FOREX OUTLOOK SUN.MAR.6.2022 - FRI.MAR.11.2022Please like and comment as it pushes me to keep creating content on pairs and my bias on it :) -This is merely MY outlook and not advice on what YOU should do just my opinion on what I see - yonsfx

XRPUSD Daily Breakdown Sun.Mar.6.2022Please like and comment as it pushes me to keep creating content on pairs and my bias on it :) -This is merely MY outlook and not advice on what YOU should do just my opinion on what I see - yonsfx
