USDCHF Technical Analysis – Potential Rejection from Resistance USDCHF Technical Analysis – Potential Rejection from Resistance
🔍 Chart Overview:
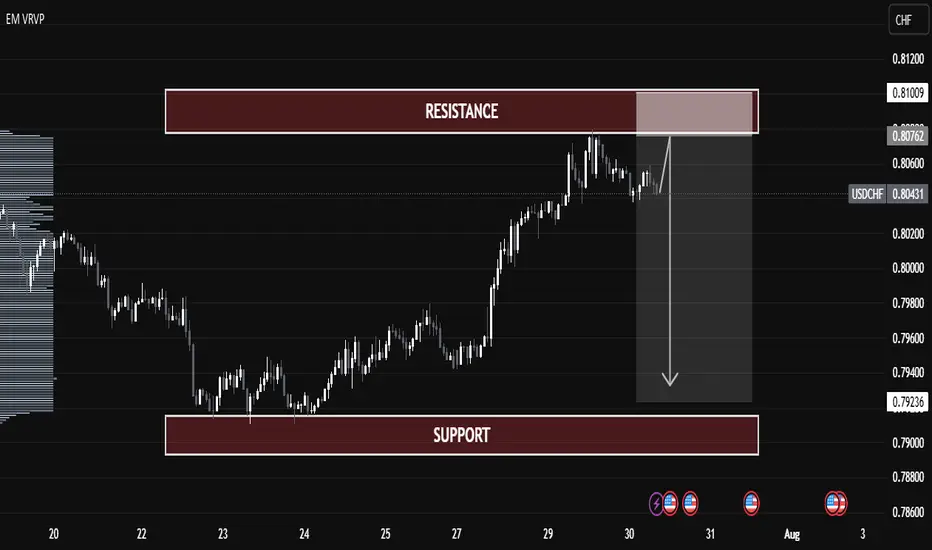
Current Price: 0.80456
Resistance Zone: 0.80760 – 0.81009
Support Zone: 0.79000 – 0.79236
Price Action: The pair has rallied into a strong resistance zone but is showing signs of exhaustion.
📌 Key Observations:
Volume Profile Insight:
Price has entered a low-volume area near resistance, indicating potential weakness in demand above 0.80800.
Resistance Rejection:
Price tested the 0.80760–0.81009 resistance range and failed to break through decisively.
A potential fake breakout or bull trap could be forming.
Bearish Projection:
If price confirms rejection from resistance, we may see a drop toward the support zone (0.79000 – 0.79236).
This would complete a classic resistance-to-support rotation.
Bearish Confirmation:
A bearish candle formation or break below 0.80350 can trigger short entries.
Ideal risk-reward favors a short setup here.
📉 Trade Plan (Educational Purpose Only):
Entry Zone: 0.80750 – 0.80950
Stop Loss: Above 0.81100
Take Profit Target: 0.79250
Risk-Reward: Approx. 1:2.5
🔻 Summary:
USDCHF is trading near a major resistance zone with weak bullish momentum. If confirmed, a sharp reversal toward support is expected, making this a potentially strong short opportunity.
Marketprofile
MSOS Long with 150% Upside - Cannabis Rescheduling Catalyst💠 Catalyst : Cannabis is currently classified as a schedule I drug alongside heroin, bath salts, and synthetic opioids that kill thousands every year — all while being safer than Tylenol and legal in over half the country. Cannabis is likely to be rescheduled to a schedule III drug soon after Terry Cole is confirmed as the head of the DEA. The vote to confirm him is expected to take place...TODAY
As a schedule I drug, cannabis companies can’t deduct regular business expenses for tax purposes, have limited access to banking, must transact with customers in all cash, and US multi-state operators are unable to list on the major US exchanges.
Terry Cole will be confirmed as the new head of the DEA, and when he is confirmed, the stalled process to reschedule cannabis from a schedule I to a schedule III drug should resume. If cannabis is rescheduled, that will pave the way for further research, destigmatize it, and open the door to banking and uplisting of US multi-state operators to the major exchanges in the near future.
This trade capitalizes on the fact that investors are not positioned for reform and further positive catalysts. The worst-case scenario is priced into the MSOS ETF, and when good news on rescheduling hits the tape, that should start a NEW Bull market in the MSOS cannabis stocks.
💠 Technical Setup:
Bear Market
• Multi-year bear market throughout the entire Biden administration on promises to reschedule that were never followed through on
• Capitulation when Trump won the election on the prospect of potentially another 4 years of no reform
Bearish to Bullish Technical Transition!
• LT Stage 1A Bottom Signal (Price > 50D SMA)
• ST Stage 2A Breakout (First day Price > 10D EMA and 20D SMA)
• Hourly Chart – Breaking out above Weekly Value Area
• Daily Chart – Trading above the Monthly Value Area
• Overlapping prior monthly value areas in sight!
• VPOC in sight!
• Weekly Chart – Targeting a retest of the Yearly POC
💠 Trade Plan
ENTRY: $2.72 (Break above weekly value area high)
STOP: $1.97 (Below the prior all-time-low)
TARGET: 6.92 (A retest of the yearly point of control from 2024)
RISK: 27.6%
REWARD: 154.4%
R/R Multiple: 5.6X
Probability of Win: 50%
Expected Value: 63.42%

GOLD: Pre-market PrepSo for gold today, I see a lot of confluence around the prior week's high, prior day's high, and the prior value area high. We also had a poor high last Friday that we've clearly broken through.
Right now, we're in balance up above these key levels. My immediate plan is to continue going long up to the prior month's value area high. If we get a pullback to the confluence area, I want to take it up from there.
If the market opens and we accept back into the previous area, I'll be looking to go short from that area and take it down. That's my main analysis for gold today. Let’s trade smart, peace!

Trading Day SummaryTrading Day Summary
Today wasn’t a winning day on the books, but it was a major win in discipline.
I hit my daily loss limit before 10 AM, stopped live trading, and switched over to paper trades to protect my capital.
The setups I took—especially in Gold and Euro—lacked full confirmation, and one overnight trade didn’t align with my plan.
I experienced around $200 in slippage, which added to the loss.
The bright side? I stayed in control. No revenge trades. No emotional spirals.
My paper trade afterward was textbook—5R+ potential. That tells me the strategy is sound. Execution and timing just need to be sharper.
Bottom line: this is a marathon, not a sprint. I’m proud of the discipline and the mindset. Tomorrow, we reset and refocus.

GRASS might finally pump! GRASS - "A retail trader´s dream": I have an eye on the chart since some days. It could have went for a lot higher prices while being at 2.10, but unfortunately it didn´t. Maybe fortunately? The profile probability up there at the pmVAH wasn´t given. What´s the story now? Price rejected the pmPOC for a potential bullish FTR. As long as this remains valid, we are targetting the origin of the move. In this case this is all the liquidty up there at the pmVAH, where price came from. So the bullish FTR with the pmPOC as your key level is your foundation for a long setup. Yesterday it wicked again into the monthly liquidity level, which is like a pmVAL. This was your long. I didn´t take it, because I was in LDO, INJ and DEGEN. I just longed it tho at 1.62 a few minutes ago because of aggressive shorts and decreasing selling volume in the 30 min timeframe. These boys are trading against the probably bullish FTR (bullish rotation). For me this was a good local pullback to take a long. Probable 4 hr higher low here aswell, good. The pwVAH is the main target number 1 at 1.9390. Target 2 is the pmVAH at 2.1610, being the origin of the move and providing liquidity for the grab. Sometimes I like to have a look at sequences to have a higher timeframe direction and more importantly get a better understanding for the higher timeframe structure / foundation. Is it weak or strong? This one is strong as hell. IF the price can break the high blue "A" after the bullish FTR, it would activate a bullish sequence. Let´s say that sequences increase the chances for an expansion based on the price structure. The special thing is that the blue "A" is so close to the yellow "A" which would activate another bullish sequences. Two sequences like this mean that price will likely just expand super high and fast without stopping at the high or 100 extension. So we are having a high probabilty to run for the ATH, once the blue "A" gets broken.
Then it would also activate the biggest bullish sequence, revealing likely ATH targets of 4.30$ and higher. It is a very good long term outlook. There was a bearish sequence that was bringing the price below the big 100 extension, but with the current foundation it is more likely to run for the highs than to keep expanding lower.
I want to stress that I won´t hold my long until 4.30 or higher. I am trading profiles. The sequences only provide a possible long-term outlook, but you rarely see such a good "ladder" of sequences, at least once the blue "A" get´s broken (the high).
So I am planning to TP at the pwVAH (most of it), then a small runner for the pmVAH and a smaller runner for 4.30 (new expanded ATH).
If the price would lose the pmPOC and the monthly level and starts to find acceptance below, then I would need to think about cutting the long. Price would likely rotate to the pmVAL to finish the bearish rotation. For now, after rejecting the pmPOC and being above the monthly and fresh pwPOC, looking for longs is a damn good idea. No trade or a long.
We are also having local aggressive sellers on decreasing volume. Such a bad spot to hard sell, if the bullish FTR is your likely scenario.
Cherry on the cake at GRASS. Last week price was dropping also into the 1.272 expansion from the previous week. There are most of the stops. Such a nice confluence with the pmPOC and monthly liquidity area. So if most of the stops got taken and retail got punished, is an expansion to the downside probable? I am buying.

LDO is bullishHere is the LDO picture and I want to explain why it is offering buying opportunities right now: The price had a big move to the downside and broke out of the bracket on lower volume than it can be found within the bracket. So being below the bracket is not the time to sell. We can also see that aggressive short-term sellers were in control to liquidate the longs. A lot of longs could have been found on the previous move to the upside, that lead the price into the pmProfile. So the 4 hr low on the left, that got taken out on this move to the downside, was the origin of the previous bullish move. This was the FTR draw (liquidity grab). Aggressive short-term sellers always compete against long-term buyers. The LTB will always win. It is just a matter of time and to find a good spot, when the market will be depleted of selling potential. It won´t be able to go any lower and the shorts will get squeezed afterwards. If we look at the 4 hr price structure, I don´t think that´s a lower high downtrend structure. It is really a bracket with some proper downside deviations. Once the market is depleted of selling potential, we can expect a full move to the high of the bracket and eventual a proper deviation of the bracket. So a full rotation of the pmProfile is very likely imo. In the local picture we can see low volume bracketing but then many aggressive sellers came in once more even after the strong downtrend. So far they were not even able to take out the low which could be a sign that the market can not go any lower right now on LDO. So really: 1) below the bracket 2) below the monthly (support) liquidity 3) below the pwProfile 4) at the lower end of the developing pwProfile which is b-shaped (short-term sellers against long-term buyers, LTB will always win in the end 5) below the pmProfile 6) local shorts can not even take out the low. Give this baby some time and then ride it.

Let’s break down what's currently happening in the GBP/USD.GBP/USD Analysis in a Simple and Beginner
Let’s break down what's currently happening in the GBP/USD market, in a way that even someone without any trading experience can grasp easily.
At the moment, the market attempted to break out on the buy (upside), but it faced rejection, meaning it tried to go higher but couldn’t sustain that move and started falling down.
As the price dropped, it reached a point where a bullish engulfing pattern had previously formed this is a special pattern in trading which often signals a potential strong buying opportunity.
Now, here’s the key point:
📍 If the market comes back down to this engulfing buy zone, there's a high probability that it will bounce back up strongly from there think of it like a spring that’s been compressed and is ready to launch upward.
On the other hand:
📍 If the market doesn’t come down and instead continues moving upward, then we already have a bearish engulfing pattern waiting at a higher level. This is a zone where the market could face resistance and fall sharply again.
So what should you do?
✅ Be patient — let the market come to these important engulfing levels.
✅ Don’t rush into trades. Let the price touch these zones and then observe the reaction.
These engulfing zones are like magic they often predict powerful movements. Wait for the price to reach the level, and then watch the magic unfold.
Even if you're new to trading, this kind of analysis helps you understand when and where the market might turn without needing complicated indicators.
DYOR! Not Financial Advice.

Can look for buy opportunities?EUR/USD Analysis Based on Engulfing Zones:
The red zone that has been marked is based on a weekly engulfing sell. The market has already touched this zone and dropped from there.
Now, among the green zones marked, the first one is taken from a 4H (4-hour) engulfing pattern, which has slightly less potential compared to the weekly one. However, the market can still go for a buy from here.
For now, wait until the market taps into any of the buy zones—then we can look for buy opportunities.
Three zones have been marked.
DYOR (Do Your Own Research)! Not Financial Advice.

BTC on the way to 113k BTC keeps showing strength.
The price is building value above the pmProfile and it rejected the pwPOC. This will cause a FTR draw (failure to rotate liquidity grab) at the 112k high.
I am using the fib expansion levels for the previous week candle to project some targets for the price discovery.
It seems like the 120k direction is still on the table. 113k next.

GRASS will DOUBLE in price within the next weeks. Grass has built a strong foundation during the past months. Price is very corrective and contracting every since. Locally it looked like a rejection off the upper pmPOC (previous month point of control) which is bearish. Well yes, it rejected but just short term. Market structure remains bullish. The price is building value above the pmProfile (previous month profile). Locally it is just leaving liquidity behind.
In my opinion GRASS is really setting up for a meaningful really and 2.15 ish will be one of the very last buying opportuinites.
4.67 is my main target and once it breaks the upper key level, it will just keep going.
The current FTR draw target (failure to rotate - because it can not bearishly rotate the pmProfile below) is slightly below the key level.
The stars align pretty well.
Honestly, this is one of the best charts I have seen lately.

JTO will pump 20%JTO is building value above the pmProfile. That´s bullish and not bearish, because people are accepting the price above the profile. This "building value" tells us that the price is preparing for another leg to the upside -> We have to find out main targets above the current range. There are some untapped levels like the pwPOC and pwVAH above 2.300. They are in confluence with the bullish sequence target zone. That´s why I am planning to sell off at the upper pwPOC. What´s the invalidation? When do we need to exit the trade? Only if JTO starts to build a lot of value below the pmVAH and even pmPOC. That´s something we would need to observe during many 4 hr candles. It isn´t likely to happen. Especially because we can see long-liquidations (b-pattern) based on the pwProfile. The market is too short to substantially go lower. This information combined with the value that is building above the pmProfile, will lead to higher prices. We have bought JTO multiple times in the past days and sold off at pwVAHs. It made sense because price likes to came back to the good entry zone multiple times, for example because market makers are forcing long liquidations first. (b-pattern).

15-minute chart, there exists another Fair Value Gap!Gold Price Technical Analysis.
At present, gold is exhibiting signs of continued bearish momentum as it trades below the 50% retracement level of the 30-minute Fair Value Gap (FVG). The fact that this critical level has been broken suggests a weakening of bullish strength in the short-term timeframe, and reinforces the likelihood of further downward pressure on the price.
Moreover, on the 15-minute chart, there exists another Fair Value Gap just below the current market level, which is offering minor support for the time being. This area has been acting as a temporary cushion, slowing the pace of decline; however, its sustainability remains uncertain under the current market sentiment.
Should gold decisively break below the 15-minute FVG as well, it would indicate a deeper structural weakness and open the possibility for an extended bearish move. In such a scenario, the next potential support level lies around the 3293 mark, which could act as a short-term target for sellers and a critical level for buyers to watch for possible reversal signals.
Traders and investors are advised to monitor price action closely around these key levels, as further developments could define the next major move in gold's short- to medium-term trend.

ETHUSD Futures: Breakout + Momentum Buy SetupEthereum has broken above the local trendline and flipped structure bullish. CCI confirms upward momentum with a breakout from consolidation.
📌 Entry: Market buy (current price ~2583)
🎯 Targets:
TP1: 2628 — prior high and minor resistance
TP2: 2678 — strong liquidity zone
🛡️ Stop-loss: Below 2520 support block
Bullish momentum supported by EMA cross, structure break (CHoCH), and CCI triangle breakout. Potential to extend toward 2729 if volume follows.

TAO is ready for another leg upI just bought TAO with the average entry price of 441. It still looks very bullish to me and should see some continuation. Those untested pwVAHs above will be next. 619 (pmVAH) is the main target. Compared to last week, it is clearly building value higher. Even above the monthly liquidity level, so this dip below is likely just a trap. Also no acceptance into the pwProfile below which will cause this bullish FTR. All signs on green honestly.
It only becomes bearish if price would somehow find acceptance in the lower pwProfile and builds a lot of value there. This scenario isn´t the likely one tho.

No bearmarket yet? Can BTC go to 120k next?Damn was I wrong with my last bearish idea, calling a potential top for BTC.
Well, it was an idea and we had good reasons for it. At that time price did not build value above the pmPOC, so a FTR (failure to rotate) could have happened.
I was able to cut my short a break even and swing with the bullish momentum on a few altcoins for example like ADA or JTO. Ideas are given in my profile.
So what now? Did the bearish chances vanish? Not yet.
BTC is currently facing resistance at another pmPOC, which is critical once again. In the same way the lower pmPOC has been.
Bulls really need to push through and build value higher. If that happens, I will become less bearish and open minded for new all time highs.
If bulls won´t be able to build value above the pmPOC, the bearish doomsday scenario will be in the cards.
There are some levels below that normally require reinspection. For example the 95400 pwPOC. I would be very surprised if we don´t see some bigger shorts at least for a while.
The FTR draw target at 74k will only be the main target, if bulls will fail against the 104900 pmPOC.
Trying to not be too biased here again. We will follow value. The bearish scenario is still an option, but it will become less likely once bulls start to build value above the pmPOC at 104900 ish.

Fartcoin update for previous bearish ideaQuick update for you:
Fartcoin took out the initial high at 1.46 several times but we are only seeing swing failures. We do not see the price closing several candles above the pmVAH and pwPOC for an attempt to build value, to then swing up for higher prices.
As long as we spend the majority of time below these levels, I am still looking towards the pwPOC below, maybe even 0.96 ish to fully take all the liquidity.
The price is ranging here (blue). If it breaks down, we will keep observing the potentially big range (white) for future price movements.
So nothing has really changed here. We know what to look out for.

Fartcoin should retrace, which would be healthyI am in a short on Fartcoin. Price is above the fresh pwPOC -> highest risk for new longs, biggest opportunity for shorts. Also the last pwProfiles are overlapping which is a sign of a potentially aged trend. The bearish sequence is not active yet, but the foundation that is currently forming would be an amazing confluence for the trade. Also, price did not find acceptance above the pmVAH yet (so far) and this is also a rejection off the pwPOC for a potential FTR, which would lead to lower prices aswell. So this is really no trade or a short. If the current high gets broken, it would destroy a potentially bearish foundation for the sequence and potential for further downside. Then price could start to find acceptance above for bullish continuation. So the current high is the invalidation for this idea. If price would manage to bust through the pwPOC, then we have targets below but it becomes more tricky there. The fresh pwPOC would be the easiest TP and I would take most profits there.
Also: Since the beginning of last week value mostly built lower. Yes, we had aggressive shorts down there but they got squeezed. If this would be a lot more bullish, then value needs to shift to the current upper place. It didn´t so far, which could be an additional confluence.

BTC bullmarket is over. Friday was the last high for a while.In my previous idea I was talking about the end of the bull market, that BTC won´t go for new ATHs. I am still sharing this opinion as long as BTC won´t claim the pmPOC above, as long as it doesn´t build value above.
All we have seen was a "look above and fail" which indicates weakness. This could result in a huge FTR (failure to rotate), bring the price back down to the origin of the move, 74k ish and potentially lower.
I was describing how such a short could get confirmed for example with:
".. if the pmPOC (previous month point of control) will be approached on high volume but claimed on lower volume, we will likely see a FTR.
I have marked the approach of the pmPOC with the yellow arow in the volume delta chart at the bottom. We had damn high volume and started closing above on lower volume (likely no acceptance). So I already started taking shorts at 96800 ish.
Bulls need to do something and claim the pmPOC asap + build value above.
If not, then my bearish targets will be in focus.
For now, I am convinced that it is setting up for a huge dip to 72k.

last chance for the ADA bullsI have been very bullish on ADA in the previous idea. We bought at 0.61 ish for good reasons and dragged it all the way up to the pmPOC at 0.73. It was a major TP level for good reasons. Price did not show any acceptance above, which is bearish. This could result in a complete FTR (failure to rotate). In this case, we will target the origin of the move. All the way back down to where we came from (check the FTR draw target below in orange).
On Saturday we had a strong volume backed breakout to the upside of the bracket. Normally price could have went for a lot higher prices. It didn´t even tap the pmPOC tho, fell back into the bracket (acceptance), so that was extreme weakness, bringing the price back to the low of the bracket quite fast.
If bulls won´t reclaim the bracket, then the pmPOC below will be next. Potentially this will last a lot longer until the FTR draw will be hit.
If bulls will reclaim the bracket, then we will simply see the top of it. Then we would need to assess if price is doing a good job to go higher or not.
So for now: short, with potentially a lot lower target., pmPOC (previous month point of control) below will be the next target.
Bullish only if: .. the bracket will be reclaimed.

EOS will go for a liquidity hunt!EOS is leaving a huge liquidity trail behind. Just look at the 4 hr higher low wicks. All these wicks are just representing stop losses.
The pwProfile (previous week profile) is showing us short-covering. Aggressive short-term buyers are competing against long-term sellers who will target all the lower liquidity at some point.
I took a small short already here above the pwVAH (previous week value area high). I might add at the FTR draw (if it will get hit) and I am even open minded for a surprising run to the upper pwVAH.
Hard to tell if it will break down from here or if it will go higher first to generate some more liquidty. Overall I am prepared for downside and I want to see the lower pmPOC (previous month point of control). This level is my main target.

BTC IS NOT setting up for another bull run! In my previous btc idea I was looking for lower prices, more into the 72k region or even lower. We got a lower low, some nice shorts and gains but that was it. No touch of 72k or lower prices. The bigger pullback to the upside was expected, but came a bit earlier tho. That´s fine tho.
Is it bullish now? Are the bears exhausted and will bring the price to new ATHs? Forget it. It won´t happen. Now is a good time to get rid of your btc holdings and start accumulating short positions (if you want to short the market). Why is that?
I strongly believe that we are in wave "B" of an A-B-C correction. The way up to the ATH was the 5th wave. The downtrend was wave A. The current wave is wave B which will inject hope once again. The people who won´t realize that this is a fake and the last opportunity to get out, they will get hurt very bad. The next wave, the C-wave, will be impulsive and brutal.
So I am mentally prepared for a big short, but I didn´t take a short yet.
I am interested in the pmPOC above.
Let´s say it will get approached (and touched with the same candle) on high volume and then claimed by low volume, then it could be a good opportunity to get into a short for a potential FTR (failure to rotate scenario). This scenario would target at least the liquidity at the origin of the move, but price could fall even lower.
Eventually the POC will get approached on high volume, not even claimed and we see retests on lower volume. Then I would be also interested in a short.
We need wait and see how things will develop.
If the price claims the pmPOC on strong volume and builds value above it, then it will keep going higher. In this case the pmVAH at nearly 100k would be the next target.
I am remaining cautious with aggressive btc longs. I am open minded for continuation but once I will get the confirmation for a short, then I will be aggressive and prepared for a big swing short.
If you would ask me today: We will definitely see prices below 70k, once this wave to the upside is over.
Stay safe, have a clear mind.
P.S. Please extend the pwProfile from last week until now (28th of April, 4 p.m). You will see that the POC did not shift higher. BTC´s price is moving a lot higher, but it isn´t building any value up here. Price is advertising an opportunity right now. It will likely get pulled back to value. It is very similar to my previous SUI idea. SUI also moved a lot higher without building any value. I am expecting the same outcome (drop) for SUI sooner or later.

The long liquidations depleted the market of selling potentialJTO looked terrible for a looong time. Now the market is way too short on it, which is visible in all the b-shaped profiles. That means we had very aggressive sellers that forced the price to the downside to liquidate the longs. Once that is completed, it leaves the market without underlying selling potential. So the aggressive sellers will become the victim, as they are acting against the long-term buyers which are currently accumulating.
As the pmProfiles (previous month profiles) give us our main targets, the upper b-shaped pmProfile needs to get re-inspected. The pmPOC becomes target number 1.
"Long liquidation depletes the market of
selling potential, which will often set the stage for a meaningful rally that
carries price substantially beyond the levels that triggered the liquidation
in the first place."
That´s why I think bulls have a very good chance to even run for the pmVAH above 2.5$.
I bought some JTO here, might buy a bit lower if the price goes a bit lower once again. Looking for the pmPOC as TP1 and pmVAH as TP2.

SUI rising without building value +short-covering, ready to fallSUI had a significant rise in the past week. By extending last weeks pwProfile, we can see that the POC didn´t move at all. Value is far more important than price. Price is simply advertising opportunity. That´s why I strongly believe that it will retrace a lot. We also had some short-covering in the past days. Those profiles need to get re-inspected, making their POC an important target. There is pretty nice confluence with the pmPOC at 3.28 ish. Selling here at the highs of the current pwProfile or even above is a very good idea imo. Biggest risk for bulls, biggest opportunity for bears. I wanna see the pmPOC (previous month point of control) and pdPOC (previous day point of control) below. If price would break below, I would focus on the pwVAL next.
