Scenarios for EURUSD 10/06Fuchsia zones are HTF value area limits with supply zones from march, green zones are VA limits with demand. Flag movement with black line showing pole and rectangle showing flag. Looking for continuation once tests green dotted line at 1.1285. Exit at top of area 1.1379. 11/22 tick stop. If top gets tested first you could go for the pullback instead of continuation.
Demand zone from yesterday shown at lower time frames (hence the green dotted line entry):
Fib is just for kicks
Marketprofile

Big Long opportunity for ZBVery large value area + demand zone play as ZB is approaching new lows. Both of those drawn on the chart. Looking for longs at 174'02 but my favorite place to go long would be 173'02. Once it bounces, expect a pullback from the down move at least to previous swing lows and VAL of yesterday at 175'08. For stops go for 8 ticks (based on lower timeframe structure at the top of area not shown on this chart, if they get broken then we cut the trade expecting a swing lower down the macro value area)

Boeing - Swing S/R key levelsHello Guys and Community,
Check out my analysis on Boeing. BO is on strong and key S/R levels right now. I am going to look for long setup if will come. Target will be key weekly levels.

TMUS LONG idea. BUT! Against Double TOP!Very strong set-up in the TMUS Stock Market today. Let´s analyze that!
T-Mobile went up with confidence, but then, because of the COVID-19 collapsed. What is interesting, however, TMUS recovered very quickly and is again above the channel, which was respected for a long time. Whether you like it or not, IT´S A LONG SIGN!
INSIDERS are those guys, who stopped the falling market. Why would you buy your own company if you don´t believe that its Stocks will go higher?
Price Action brings nice patterns such as trend-lines, pinbar, rejection, and double top. Why am I thinking about Long trade against the DOUBLE TOP? The answer is simple - there are more signs that confirm Long SETUP. And that is the reality of trading. You will always have something you don't like. The decision is yours.
Good trading,
Jakub
FINEIGHT

Retest of initiative move at T-BondLong scenario for today
Give me reputation if you want to see my top down approach and how I got to this scenario since I need to put more images to do so and TV doesn't let me.


GBP/USD Short idea 🧐After 1-2 Days accumulation was created one significant volume clusters...
This Volume clusters will be good enter for the short trade.. 1.22088
Because i expect that this strong sellers will be defend their short positions.
This is so simple setup..
Move down.. Accumulation.. Another move down.. and waiting for come back to the accumulation.
Happy trading
Dale

GBPUSD - Intraday Key levelsHello Guys,
Check my analysis on GBPUSD, after dump there is the same S/R profile resist like in the morning. I am going to look there for a trade setup.

SUGAR - CHEAP for coffee! #COMMERCIALS LONGHi traders,
today´s analysis contains information about possible COT trade in the SUGAR. Commercials increased their Long positions, and we are near the extreme SUPPORT level - Edge of the Value area!
Sugar also created a nice REJECTION that confirmed our expectations. Do you remember "Buying tail" from the last videos? Sugar´s tail is one of the most beautiful ones.
Do I enter the trade right now? No!
I am waiting for the 123 pattern that is safer. It´s the last confirmation I am looking for.
Remember - trading is about connecting the dots. And that's what we do in the video.
Good trading,
Jakub
FINEIGHT

USDCAD Swing trade tutorialHey Guys,
I wanna show you how I trade swing trades based on my SR levels.
Firstly I am waitting for a market to arrive in a SR area and then I am looking for a trade setup. In this case we can see strong buying activity which can be confusing, but mostly its good sign. Then I see pinbar with our formation which shows bigger volume and possible trade signal.
So I entered trade command with SL and was looking for the first TP. I saw that in RRR 1:1 is strong gap and stargap formation which can be strong SR zone ( this significant zone was first TP ). When first TP was filled I moved SL on BE and let UC run to the second TP or BE :)
Hope it will help you. Very similar trade you can see on EU idea from monday.

SPX Vs Tick Vs ADRN comparisonThe chart displayed the comparison between SPX Vs Tick Vs ADRN daily index which shows the divergence, which indicates that next 1-2 days will be range bound or possible reversal.


EUR/JPY: How to Combine Volume Profile and VWAP 📊 Today, I would like to show you a nice confluence of two trading strategies on EUR/JPY.
The analysis I am going to do will be an intraday trade analysis and I will do it on a 60 Minute chart.
Volume Profile analysis
The thing which got me interested first in this chart was a tight rotation, which was followed by a rejection of higher prices and then an immediate sell-off.
The reason why it caught my eye was that a tight rotation followed by a sell-off is what I look for in my Volume Accumulation trading strategy.
What I also want to see with this strategy is heavy volumes traded in the rotation.
In this case, those volumes were really easy to spot because they show very nicely on the Weekly Volume Profile.
If this wasn’t as easily visible on the Weekly Volume Profile then I would use my Flexible Volume Profile to look just into this rotation area. However, in this case, there was no need for that.
So, what I think happened there was that sellers were accumulating their selling positions in the rotation area (blue rectangle). Then they rejected higher prices aggressively, and then they started the sell-off.
Now the price is slowly making it’s way upwards. If the price gets in the heavy volume area again, then those sellers who were accumulating their shorts there will want to defend this area. They will want to defend their short positions!
What I think will happen is that those sellers will start aggressively selling again and they will push the price downwards again.
This is why I think this will work as a resistance (around 116.62 )
There doesn’t need to be another sell-off from there again, maybe just 15-20 pip reaction. But even if it is only this small reaction then it should be enough to take an intraday trade there and grab a quick profit.
Weekly VWAP confluence
What I also like about this resistance area is the Weekly VWAP, and mostly it’s First deviation (the grey line). The upper first deviation of this week hasn’t been tested yet and it is almost exactly at the resistance which I identified using the Volume Profile!
If the price touches this 1st deviation then I expect a selling reaction. And it does not need to be today. It can also be the next week…
This is the kind of trading signal I like to see most! When a Volume Profile strategy points to the same level as VWAP trading strategy then this creates the strongest trading levels.
hope you guys liked this analysis, let me know what you think in the comments below!
Have a nice weekend, stay safe and happy trading!
-Dale

(ALI)BABA LONG setup - channel trading!Hello traders,
Yesterday´s trade in the CURRENCYCOM:BABA market is the perfect educational content for today´s video!
Channel trading, trend-lines, adjusting zones from the volume profile, and more.
Everything included in the video with real trade description (including SL and PT)!
Parameters of the trade (LONG ALIBABA):
Entry: 196.15
SL: 184.56
PT: 219.33
Good trading!
Jakub
FINEIGHT

TTEK - prepare for the HOTSHOT!!!Hi traders,
I am here again with an analysis of the stock market . My favorite ticker for today is NASDAQ:TTEK .
There are many confirmations for my thought, that we "will" go higher. Notice the quotation marks - the market shows us what is really right.
Today´s video contains information about:
1) Insiders
2) High volume nodes
3) Low volume nodes
4) Fibo retracement
5) PinBars
6) Support levels
7) Inside-out trades
and more...
I believe that this trade is full of educational content and we are a small step to OPEN THAT TRADE.
Have a nice weekend,
Jakub
FINEIGHT

TAL confident TRADE - INSIDERS FOMO entry???Hi traders,
this video is slightly different because I would like to show you, how I analyze the market.
Everything starts with fundamental analysis. INSIDERS are NOT my FRIENDS , but they know, what´s happening in their company. And I want to play like them .
TAL ( NYSE:TAL ) trade was really interesting for me. I saw higher prices and INSIDERS rapidly increased their LONG positions.
Compared to the SPY ( AMEX:SPY ) market, decline of TAL was very small! Another LONG sign.
Once we have the fundamental analysis done, we can move on to the Price Action analysis (Support/Resistance, trend-lines, value area, major highs/lows).
And what are the parameters of the trade I took?
Entry: 51.74
SL: 44
PT: 67.01
The video describes what am I focusing on in the markets and I hope it will help you in your own trading.
Good trading!
Jakub
FINEIGHT

GARMIN upcoming RALLY? How to do ANALYSIS $$$Hi traders,
today we have Monday, the first trading day of a week. I went through almost 1000 markets over the weekend and picked one market, which is in my WATCHLIST for the upcoming week ( in total there are almost 100 markets ).
Why did I choose GARMIN ( NASDAQ:GRMN )?
The answer is simple - we have plenty of educational material there :
- Volume profile
- Gap analysis
- Low volume area
- Trend-line
- Finished business (Nobody wanted to TRADE LOWER prices)
Enjoy the video and prepare your WATCHLIST!
Good trading,
Jakub
FINEIGHT

EUR/USD Resistance 🔪After nice profit on my Volume cluster for long trade...
Can see other one for short trade... This significant Volume cluster is around 1.0866...
There is good enter for short trade...
Today is morning and i dont expect " Trend day " but just rotation...
Happy trading
Dale

$NEO$ LONG trade! INSIDERS with you!Hi traders,
today is Friday and there is little time left to finally start the weekend - free time, cool...
BUT not for a swing trader, haha.
If you are a long-term trader you have to spend many hours during the weekend in front of a computer. You have to pick the best stocks with the highest possibility of a move and create the watchlist for the next week . And that´s work, I do every week.
And what am I looking for? Fundamentals, INSIDERS - big changes in their behavior...
I would like to share yesterday´s trade in the NASDAQ:NEO market, where INSIDERS believe in a continuation LONG move. = VERY STRONG PATTERN
Entry point: 28.57
Stop-loss: 25.66
Profit target: 34.39
Have a nice weekend!
Jakub
FINEIGHT

ALKS - INSIDERS SHORT sign + SPY WEAKNESSHi traders,
I am going to share yesterday's trade with you, that we opened in our accounts. It was a SHORT in a market that is in a pretty nice downtrend.
You will probably have a question - Why do you open short trade in this falling market?
Because INSIDERS increase their SHORT positions - and that´s a SHORT sign ! Trading with them is much easier than against them.
In the video, I focus on the volume profile too, and how to use SPY for the confirmation.
Trade parameters ( NASDAQ:ALKS ):
Direction: Short
Entry: 15.90
Stop-loss: 18.44
Profit target: 10.79
Good trading!
Jakub
FINEIGHT

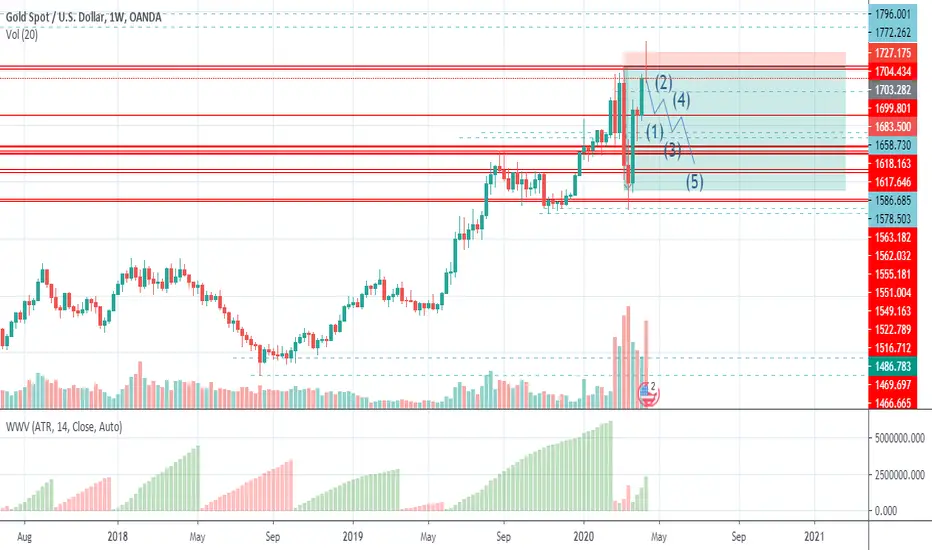
XAUUSDAs simple as that just because a big size of pendingorders in market thats why market reject the level and as you can see market is totally in down trend for next 1 month
EURUSD support zone ✔️After strong buying activity can you see in the chart significant Volume cluster.
From this Volume cluster i expect reaction.
I expect that this strong buyers will be defend their buying activity and push the market up again.
Happy trading
Dale

Very "old" trend-line in Starbucks - **IT WORKS**Good morning traders,
Starbucks NASDAQ:SBUX hit a very strong Trend-line. We connected two points that are several years away and it's really interesting because it really stopped the market!
This analysis contains not only a description of the current situation but is also partly EDUCATIONAL.
The video content is as follows:
1. Market Profile (PinBar)
2. Volume Profile
3. Value Area
4. Trend-lines
5. Gaps
6. Zone trading
We combine these points to create the whole picture.
In the future, we plan to set up an alert manager for this type of trades so we can share it faster.
Have good trading,
FINEIGHT team
