#BTG Volume Analysis Prediction 8/24/2018Hi, friends.
BTG is in the main balance with the range 17.68-21.70. Intraday balance (range 14.80-17.68) after fixing goes up, that means we have a bull priority in intraday charts at the moment. The support level 17.68 is very important. If the main balance goes down and the price will break down this level, bull priority will change to bearish again. As long as the price is in the balance we trade inside from the its borders.
The chart shows the label notes, how to operate at key points.
Glossary of terms
Point of Control (P O C) – The price level for the time period with the highest traded volume .
Value Area (V A) – The range of price levels in which a specified percentage of all volume was traded during the time period. Typically, this percentage is set to 70% however it is up to the trader’s discretion.
Balance - Accumulation Area.
F L - flat level.
T L - trend level.
Fixing (fix, culmination) - reverse price reaction then the markets stops i'ts movement for a short time. The trend stops when it passes through 1-3 fixing movement.
Marketprofile

Commodities and Construction Market - Deep Analysis14th Aug 2018
FUNDAMENTAL ANALYSIS
The analysis that follows in my discussion is quite deep, be prepared for some solid insight into the market for commodities, global economic analysis and the current situation of this 'trade war'. As such, I will endeavour to succinctly tie up fundamental and technical analysis to provide you with a good understanding of the market for construction metals and materials. These include: copper, lead, iron ore, zinc, aluminium, lumber wood and to a lesser extent nickel, platinum and other rare-earth metals.
The reason why the global construction will affect those metals and materials, is that most of the mass building done in China and US (the two largest economies with high average GDP growth rates) will rely heavily upon those commodities. For example, residential property developments will use a large amount of lumber wood as a structure, copper will be used for wiring approximately 65% is used in electrical applications* (switch gear, wiring and circuitry, semi-conductors, conductors and transformers) and 25% is used directly in construction for industrial applications (Irrigation and agricultural sprinkler systems, piping at distillation plants, seawater feed lines).
*https://www.thebalance.com/copper-applications-2340111
As we all know China and US are having a bit of diplomatic relation strains. The Cold War mentality of a burgeoning trade war does not bode well for the global economic climate. In fact today, Reuters news released an article stating that China is hoping to expedite plans of investment: " The Chinese government is expediting plans to invest billions of dollars in infrastructure projects as its economy shows signs of cooling further, with investment growth slowing to a record low and consumers turning more cautious about spending."
"With its trade war with the United States threatening to pile more pressure on China’s already slowing economy, Beijing on Tuesday reported downbeat economic data, rolled out a $14 billion urban railway plan and pushed local governments to speed up issuance of special bonds for funding infrastructure projects."
www.reuters.com
The implications of declining investment is that aggregate demand falls (AD = Consumption + Investment (private)+ Government Expenditure (investment) + Net Exports), enabling a lower economic growth rate. The reason why economic growth increases and decreases are important to the commodity market for construction metals and materials, is that increases in economic growth are highly correlated to increases in those commodities. China, in particular has a urgent need to spend on 'infrastructure projects' or otherwise capital goods -goods that are used in producing other goods, rather than being bought by consumers. This is a just fact that China is an emerging economy with a high population, so has greater need to spend on improving infrastructure than the US.
So my analysis continues that by having a trade war, tariffs, subsidies, quotas and other protectionist policies become the main bargaining tool. This puts considerable risk on global economic growth, as naturally trade quantities and values lower due to a greater inefficiency in the production and exportation of goods. As this risk increases, business investment gets put on hold so less construction of new buildings, warehouses, storage facilities etc. This decrease in investment will be multiplied throughout the economy (the multiplier effect) and a perhaps $250B decrease in business investment actually has a $1B to $1.25B actual effect on the economy. The effect on commodity prices is that a trade war decreases demand and supply for exports, which leads to a decrease in economic growth, leads to a decrease in investment, leads to a smaller intention for businesses to expand or do construction, which leads to a huge decrease in demand for building supplies, leads to a decrease in the price of crucial metal and material construction commodity prices. See how it is very important to follow the money trail.
The economics is really important for long to medium commodity trading and prices as economic growth always reflects a demand for raw materials i.e commodities. Strong economists out there may comment to me, " you forgot about the time lag, decreased demand in copper doesn't happen over night". Well, yes but there are two major fundamental factors affecting it. The first one being that the financial markets (all globally traded markets including that pesky bitcoin) always reflect the most recent information as speculators (you and me) are merely hoping to make a profit not actually take delivery of 1000 tonnes of iron ore. Speculators represent the majority of financial market participants, look at FX, only a very small percentage of buyers and sellers are trading currency to settle imports and exports. That's why when economic data comes out or major events unfold (think Brexit and GBPUSD) changes happen within a couple of minutes. The other crucial factor is that lack of trustworthy in the Trump Administration by world leaders in business and commerce don't want to see how 'it plays out'. They will not take such risks, so will be risk averse, putting even more pressure to halt any type of capital expenditure. The market will reflect this sentiment.
TECHNICAL ANALYSIS
This neatly bring me on to my technical analysis. In the chart, I have two securities: Copper (line is copper colour) and NAIL - a leveraged ETF that provides 3X exposure to home construction and supplies businesses operating in the US. I have put these two together as they show a strong price correlation as copper is commonly used in homebuilding industry. As you can see, the inclines, declines, tops and bottoms are quite similar. Copper, after falling from its high, has developed a descending triangle. This is the most significant triangle pattern as it shows a quite a strong bullish outlook. The support line is horizontal, showing that bears have failed to push it lower, and a decline a resistance line also states that the bears are running out of momentum. Also, there is low volume, always a good signal that major move is coming usually but not always bullish. (I think I read it was like 71% success rate of bullish outcomes following a descending triangle, but don't quote me). There are two momentum indicators colour-coded for ease of reference. So Copper Momentum is trading in a bullish price channel indicating that there is a strong bullish sentiment, albeit not yet reflected in the price. It provides some insight to a potential reversal coming.
Also, NAIL ETF has developed a price descending wedge. Given it is descending and following a recent bottom, it points quite strongly to a bullish breakout. Further consolidating this point, is that NAIL momentum indicator is also in a triangle pattern. Triangle patterns can go either way, and it is incredibly hard to determine which way it will break out. All I know definitively, is that following a triangle breakout, the price can trend 1 to 1.618 even 2.618 the vertical height of the triangle, so be ready for a break out.
Also, I have constructed another correlation chart with lumber wood futures and NAIL ETF, it shows a similar representation of the current chart, however there is an almost perfect 5 month time lag. I'm not yet confident on my analysis for that pairing yet but it still provides some insights that can be related to my analysis here. I have linked it at the bottom. Take a look, its very interesting.
Link:
A very important point to consider for NAIL ETF, is that rising interest rates play havoc on mortgages which is an extension of home owner and investment property mortgages. This is also a another variable that will negatively impact the NAIL ETF, however, I am not sure to what extent it manipulates price.
CONCLUSION
Combining all my analysis both fundamental and technical, I can conclude that the commodity market is at a general 12 month low. This is the result of downgraded global economic growth forecasts at the beginning of 2018, a significant equities and cryptocurrency correction as well as the worsening trade war between the world's two biggest and most important economies in the world. As a result, the broader economic situation has put significant selling pressure on commodities, with declines more pronounced in construction metals and materials. This is most likely due to the fact that the demand for capital good spending for both economies has declined given tangible impedances to economic growth for both China and US. The market sentiment has changed quite rapidly since January of 2018. As economists and market analysts have increasingly pointed out, there is a range of serious issues affecting the global economy and it seems to be spiralling out of control.
At this stage, my analysis points out that my long term view(6 to 18 months) is quite bearish, there are no signs of negotiation in the trade war, the equities market has posted its high in January, increasing interest rates, approaching a yield curve inversion - a sign of short term angst and instability (GFC was reported to have a inverted yield curve) and no safety nets such as the global investment and global commodities boom that helped us get past the GFC so quickly. So naturally I have a bearish outlook, unless there is a major change in trade war negotiation or the like, we are poised to slowly reach 2016 commodity price lows.
My short term view is however, slightly bullish, at least for copper. As both securities are showing strong divergence in price and momentum, and both showing bullish chart patterns, I am 70% confident that a short term bullish trend may evolve, however no longer than a month. Also, my view is consolidated by China's recent decision to issue considerable amount of treasury bonds to finance its plans for capital goods and infrastructure. As such, a demand in iron ore, copper, aluminium and lead is feasible, pushing up those prices. However, the extend of the price rise is directly related to the amount of capital expenditure they plan to do. Nevertheless, a short term trend reversal seems probable given all the information available.
That's my analysis, I hope you enjoyed it. I know its long but I spent a lot of time writing it and researching. Please give a like, comment and follow. This is the quality I give.

EURJPY still have potential for the pullback to continue to 50%JPY made a strong start yesterday night moving all related pairs, and the Euro is not the exception. Price will most likely continue to drop to the 4h 50% Fib line @ about 129.62 (you can probably have a short entry on 30 min chart at the resistance between 130.10 and 130.00 with TP @ about 129.65 ) Once it reaches this level, the 4h 50% retracement might be completed and trend continuation to the upside might begin again.
Wait to see how the market reacts at 50% level as market makers will most likely manipulate the zone to create liquidity and stop you out. God Bless!

Selling Value Area In The USD/CADFriday has brought a myriad of challenges to currency players. Trade war hysteria has boiled over, with the USD fading against the majors. It appears that selling the Greenback is the play across the early U.S. forex session. The 1.3134-40 area has set up as value in the USD/CAD for the last two days. If this market tests it once again, a nice position to the short will be in play.
Here it is:
1)Entry: Sell 1.3134
2)Stop Loss: 1.3176
3) Profit Target: 1.3092
4) Risk vs Reward Ratio: 1/1
In the event that this trade goes live before today's forex close, the short position will stand over the weekend. If not, scratch the trade.

Banknifty Trade ideas and plan this week-25JunBNF: Last week , Played out all 3 scenarios that we laid out, a test near 26150, consolidation and 26300 levels and a upward test for 26800 levels.
BNF continues to trade within the trading range formed on the 1st week of June. Testing the 78.2 % retracement, from there an upward push up to 27000, 27350 zones is a possibility. On the downside 26480-580 will support immediate support and a move below will be a good zone to test for a downward push
Now we could play out the below scenarios for next week
I.Continue upwards to test 27000, 27350 zones or higher, but given OI accumulation at 27000 I will be cautious for this scenario.
II.Move below 26750 and test the zones of 26580-480.
III.A break below 26350 to try and test 26150 and lower levels. Again at this point a break of 26100 looks difficult this week based on month end OI

EUR/USD LongYou can see strong side way price action after trend up... There was a volume accumulation area from which strong buying activity started. For that reason I think that the volumes accumulated in this area were volumes of strong buyers. I waited for pullback to this area. I think EURUSD is ready for correction higher. Because this is the strongest Volume accumulation of this year and THE LAST YEAR too!!

Zcash/USD (Zcash) Coming Into A Tradeable Low!Zcash/USD (Zcash) setting up for short-term cycle low with the medium-term cycle up. 2018-0510, 6:50 p.m. EST. By Michael Mansfield
With current structure, the proportions would fit best to see one more low to complete big Wave B, or Wave 2 of 5 low, at between $254.00 to $249.00 area. It is possible the low is in, but I think not yet. However, if $266-$265 is the low, within a few hours, it makes it a Flat Correction, in Elliott Wave terms. One more low to the $254-$249 area, and its a Flag Formation. Both formations are likely bullish! So either way, a tradeable low rally for two weeks or longer, should be in within 24-48 hours, possibly sooner.
NEGATED:
The potential bullish breakout scenario would be negated if Zcash broke below the lowest Andrews lower fork's resistance line, currently at 207.
PRICE VOLUME ANALYSIS:
Bulk visual price/volume distribution resistance area (dashed blue line) is the major resistance area. That price level is currently at $289.00. The blue line is slightly lower at $286.00, so as not to cover up the peak of the graph (located at the right margin of the chart).
A break above that "blue dashed bulk volume line," or the "pink Andrews Pitchfork" upper resistance line (currently sloping down), will likely confirm a new uptrend or at least a significant upthrust in the case of a Wave C corrective wave structure.
TRADER TIPS: The minimum volume attractor area is shown by the ""dashed red line" and the low price volume distribution graph (also at the right margin of chart). This low volume area can be a magnet for price to quickly magnetize to, then reverse. Sometimes markets go back later to fill those areas to form a duel bell curve distributions.
Conversely, the bulk price volume distribution area (think thick part of a bell curve in statistics) are often longer-term support and resistance areas where price has traded at and around that area for a significant amount of time in the past. This is especially when this data parameter is set based on the number of price ticks, price changes, rather than just the amount of volume at a given price). Watch these areas for price changes.
CYCLES:
The long-term cycle (not viewable at this price scale) is heading down, while the medium-term cycle in green is up. Since long-term cycle moving down will tend to dominate, I would expect a price peak prior to the green up cycle's peak date of July 15th. As with other cycle comments, these are young markets without a lot of price history, so there maybe longer cycles at play, either up or down, that we cannot yet account for.
TRADER TIPS: When a larger cycle is down, while a middle-term cycle is up, prices will tend to peak earlier than the short-term cycle's peak date would indicate. The reverse could be true if the long-term cycle was up and the shorter-term cycle was down. In that case, you might expect an earlier bottom. Finally, when both cycles are up, the actual medium-term top will likely come further to the right, time wise. This skew is called "Right Translation." Earlier peaks are called "Left Translation."
Cycle lows in stocks tend to be easier to pick out than cycle tops. But over the years I found that in many commodities, cycles tops are far more regular and easier to pick than cycle bottoms. For instance, Gold has a very regular 8-year cycle top. The next 8-year cycle top is due in late 2019-early 2020. That does not mean it will be a higher high. Gold may form a lower high, than the September 2011 high. So a bounce in gold lasting 12-24 months may be underway. Should gold, for example, clear $1550, then hold on for a likely higher high at $2200-5500, in 2019-2020, 8-yrs to 8.6 years from the September 2011 top. Some contracts topped in 2012, if I remember correctly.
Digital assets seem to trade more like commodities in this regard.
DISCLOSURE:
This analysis is meant for educational purposes only. You trade at your own risk!
Michael Mansfield, CIO

EUR/USD - Using WA + MP - Potential ShortThe red boxes on the chart represent the Asian session as I came to notice that during the LSE session the pair would either come to the 50% of the TSE range, or all the way down retesting/breaking the low of the TSE range. Of course the opposite could apply, retesting/breaking the high in case of a downtrend.
Details are laid out on the chart.
For risk and money management purposes, always determine a max. of 2% risk on every trade.
For example on a $50,000 account, this would be equivalent to 1,25 Lots with an 80 pip stop loss.
Entries, targets and closure of positions may be subject to alteration throughout the course of the trade. This is due to the ever-changing and unpredictable nature of the market.
This post is set to be used and serve as an example and in an educational manner and is not to be taken as direct investment advice.

USDJPY longYou can buy on this support or wait for breaktrought red trendline and then open buy trade.

GBPAUDPink rezistance is powerfull weekly level .
Red is Daily rezistance, and we are under both rezistance. If breaktrought cross trend line , we can expect corection..

EURGBP long analysis by market profile with price actioneurgbp is on Volume POC from accumulative and breaktrought short trendline and we pullback this VPOC... EURGBP creating high lows ,
I expect long now or reflection from second support 0.8800

GBPCAD short if...I prepared short if breaktrought 1.8090 . TP is 1.7940 with small SL . On this price is strong volume and we can opened intraday long with small SL and TP...
GBPCAD

EURUSD short with market profileEURUSD short on VPOC with sl and tp. Possible continue move downtrend after hit TP

AUDJPY short limitI set it up short limit on Audjpy . This level is very powerfull with Price action and Market Profile VPOC from down move.
Watch this pairt with me and I will tell you when set up SL and TP

EURAUD next moveEuraud is on the very powerfull support now. I expect small corection with SL an TP .

EURUSD short with TPEURUSD is under Rezistance 1.2400 and if will not come breaktrought this price we stay downtrend. IF breaktrought the price rezistance to be converted on support.
Very powerfull support is on the price 1.1800 but before that will tested price 1.2050

EURCAD short with market profile analysisEURCAD is on VPOC power rezistance and i expect corection now. If breaktrought this level we can continue uptrend.

GBPJPY short limit by Market profileI set it up short limit 148.97 because on the price is strong level VPOC and then it happened a sharp drop . Now GBPJPY coming testing this VPOC

EURJPY analysis with MArket ProfileEurjpy dropped yesterday and asian session has returned up test VPOC . I expect go down.
Check this pair with me

USDCAD limitsThe best price on opened short is around 1.2890 , because this price is strong volume from accumulation usdcad.
The best price on opened long is 1.2690, because this price is strong level from Price action pullback and high volume from uptrend.
Watch pair with me

EURAUD analysis Market profileEURAUD heads to strong price 1.5680. This price is very powerfull support and will be than magnet for downtrend euraud.
Check this pair with me

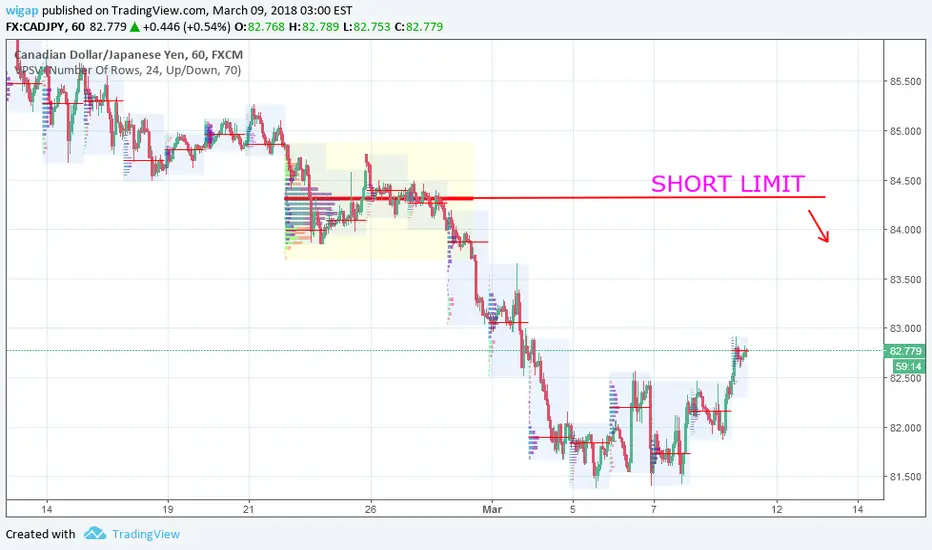
CADJPY Short limitI set it up Short limit on CADJPY on price 84.30 because is strong VPOC from consolidation and after strong sell. I expect reaction on the price!
Check this pair with me and i will write SL and TP next time .
EURCHF by Market Profile AnalysisEurchf is on rezistance now. On the price came big sale on EUR yesterday. I expect continue decrease eurchf today .
Check this pari with me
