Fartcoin will lose a lot of valueFartcoin offered a very nice long opportunity below the bracket, because price broke to the downside on decreasing volume. That´s not what strong bears wanted to see. So over there one could have accumulated a lot, wait for the bearish auction process to come to an end and then trade it to the upside. The minimum target was, of course the top of the bracket. After reaching the top of the bracket, we need to judge the volume. Price broke to the upside on very weak buying volume. That´s not what strong bulls want to see. Price also broke through the pmPOC with low volume. Only afterwards price pumped higher on a lot of buying volume in comparison. I really believe that all these buyers here above 1$ will be trapped. They are the foundation for a lot of downside, that we will see in the next days. My minimum target is once again the low of the bracket at 0.78 ish - a decrease of roughly 30%. Then we will judge the volume and a potential breakout attempt once again. So right now I am just accumulating shorts, waiting for the bullish auction process to come to an end and then it will fall back down relatively quick.
If we will see the breakdown, price will naturally lose the pmPOC which will cause a FTR (failure to rotate), because obviously then price was unable to fully rotate the pmProfile. We will then target the origin of the move, which is minimum all the liquidity below the bracket.
Another important fact to mention: The freshest pwProfile (previous week profile) below is pretty balanced. Above, the highest risk for new longs is given but the biggest opportunity for sellers. Of course the current move is very extended for good reasons, but it is still an important factor that requires some good risk-management and understanding of the profiles and auction process. I´ll see you at the low of the bracket.
Marketprofile

Gold at the $3394-3392 level citing the presence of an engulfingGold Buying Opportunity Analysis
Considering buying gold at the $3394-3392 level, citing the presence of an engulfing buy filter zone that indicates pending buying orders. This technical setup suggests potential support at this level, which could lead to a price bounce.
Potential Upside:
- Conservative estimate: 40-70 pips
- Optimistic scenario: up to 100 pips or more, depending on market conditions and momentum
Key Factors to Consider:
1. Engulfing buy filter zone: This technical indicator suggests buying interest at this level.
2. Pending buying orders: These orders could contribute to a price increase if executed.
3. Market sentiment: Overall market conditions, news, and trends will influence gold's price movement.
Important Reminder:
This analysis is for informational purposes only and should not be considered financial advice. It's essential to conduct your own research (DYOR) and consult with a financial advisor if needed. Trading carries risks, and it's crucial to manage your positions responsibly.
Next Steps:
You'll be waiting for the market to reach the specified level. If it does, carefully evaluate the market conditions and make an informed decision based on your trading strategy and risk tolerance.
How do you plan to manage your trade, and what are your risk management strategies?

Even if you don´t like ADA, it looks very bullish! The March price action was based on aggressive short-term sellers. Who are they fighting? Short-term traders are always competing the long-term ones. So in this case the opposition is formed by long-term buyers. They are only accumulating while the aggressive sellers enjoy the gains, shooting for more until they end up being under water. The pwProfile (previous week profile) and the prior week profile are also b-shaped. We are having the very same picture there. I have already drawn the developing profile because in a few hours it (as we head into Monday) it will be the fresh pwProfile. Again: b-shaped = aggressive sellers. So to me, ADA is a really really good buy. Have a good risk management, don´t overleverage and ride it to the upside soon, together with the long-term buyers which are already known as the winners. The minimum target is the top of the old bracket (range, white) at 0.77 ish. But honestly, ADA should fully rotate the pmProfile up to the VAH at 0.91 ish, which is what I am aiming for. I don´t see it stopping before. Stopping for example at the top of the bracket won´t be any pain for the aggressive sellers that started to build within the bracket. We really need to deviate them. A full pmProfile (previous monthy profile) rotation only makes sense. See you at 0.91 ish.

BTCUSDBitcoin is currently trading near 84,949 after a strong rally, now approaching a critical order block resistance near86,000. While the overall structure remains bullish, the chart signals a potential shift in market behavior—creating a clear discrepation between price structure and projected move.
Discrepation Breakdown:
1. Rising Trend vs. Order Block Reaction
- Expected: Uptrend to continue, breaking through the resistance zone.
- Actual: Price is hesitating and forming a double-top structure inside the order block, hinting at buyer exhaustion.
- Discrepation: A bullish structure failing to maintain momen…
- Recent candles show weak buying volume near the top despite higher prices.
- Discrepation: Price is rising, but volume is not supporting it—bearish divergence, weakening the bullish outlook.
4. Fair Value Gap (FVG) Overlap
- FVG zone around 82.2k aligns with the bearish target, giving confidence to downside movement.
- Market may seek to fill that gap, creating a conflict with the bullish price structure currently visible.
Discrepation Summary Table:
| Technical Element | Market Expectation | Observed Conflict
| Uptrend + Higher Highs | Continuation toward 86,000+ | Double-top …
Although Bitcoin remains in a short-term uptrend, this chart shows clear bearish discrepation. The failure to break the order block, combined with volume divergence and trendline pressure, suggests a potential drop toward $82,232, especially if price confirms the double-top and breaks the ascending trendline.
Would you like a short version of this for social media captions too?

GBP/JPY SELL SETUP 250 PIPS1️⃣ Macro Fundamental Analysis (GBP vs. JPY)
🔹 Interest Rate Differentials (Carry Trade Impact)
Bank of England (GBP)
The BoE has kept rates high to fight inflation.
Higher GBP rates → capital inflows into GBP assets.
Bullish for GBP/JPY.
Bank of Japan (JPY)
BoJ is still ultra-dovish, keeping negative/low interest rates.
Japan’s government wants a weak yen to support exports.
Bearish for JPY, Bullish for GBP/JPY (carry trade flows into GBP).
📊 Institutional View:
Hedge funds & large investors prefer long GBP/JPY due to high interest rate spreads.
GBP/JPY remains fundamentally bullish due to carry trade inflows.
🔹 Global Risk Sentiment (Risk-On vs. Risk-Off)
GBP/JPY is a "risk-on" pair → it rises when markets are bullish and falls when investors seek safety.
If stock markets are bullish, GBP/JPY tends to rise.
If there’s a global crisis, investors move into JPY (safe-haven), causing GBP/JPY to fall.
Current Market Sentiment:
Stock markets are uncertain, but no full risk-off move yet.
Watch equity markets & US bond yields for risk sentiment confirmation.
📊 Institutional View:
Mild risk-on bias → GBP/JPY has support, but volatility remains high.
🔹 Institutional Positioning (COT Data & Hedge Fund Flows)
Hedge funds have been buying GBP against JPY due to the rate differential.
Commitment of Traders (COT) Report:
Shows institutional investors are still net long GBP/JPY but reducing positions.
Some profit-taking could lead to short-term downside.
📊 Institutional View:
Long-term institutional bias is bullish, but hedge funds may reduce positions if risk-off sentiment increases.
2️⃣ Technical Analysis (ITPM Style) – Multi-Timeframe Breakdown
🔹 GBP/JPY (Daily Timeframe)
📈 Trend: Still in an uptrend, but approaching resistance.
📌 Key Resistance: 195.00 - 196.00
📌 Key Support: 191.00 - 190.00
🔹 Price is struggling at resistance near 194.00.
🔹 Possible pullback to 191.50 - 192.00 before resuming higher.
🔹 GBP/JPY (H4 Timeframe)
📉 Short-Term Weakness, but Still in an Uptrend Channel
📌 Key Level to Watch: 192.50 - 193.00
🔹 Bearish Rejection at 194.00, but still inside an uptrend structure.
🔹 If price breaks below 192.50, a deeper correction to 191.00 is likely.
🔹 GBP/JPY (H1 Timeframe)
📉 Intraday Weakness, Watch 192.50 for Breakdown
📌 Key Levels:
Resistance: 193.50 - 194.00
Support: 192.50 (short-term support), 191.50 (stronger support)
📊 Institutional View:
Intraday traders may take short positions below 192.50, targeting 191.50 - 191.00.
3️⃣ Institutional Trade Setup (ITPM Style)
🔴 Bearish Scenario (Short-Term Correction)
Entry: Sell below 192.50 (Break of key support).
Target: 191.50 → 190.00 (support zone).
Stop-Loss: Above 193.50.
Rationale: Short-term hedge funds taking profits → minor pullback in bullish trend.

Why eurgbp will sell this newyork session!!In my analysis, we are observing signs of weakness in the Euro, as indicated by recent candlestick formations that reflect a notable lack of buying pressure. This behavior appears to be aligning with key Fibonacci retracement levels, suggesting a potential transition towards lower price levels. I anticipate that in the pre-New York session, we may witness a temporary fake-out before a subsequent downward movement. Traders should exercise caution and consider these factors in their decision-making process
Follow me for more breakdown!!

GBP/USD LONGHi !
Based on the current price action and I have prepared 2 trades for next week.
First is a long position from 1.287 where is VAL , price has respected this area, making it a good level for initiating a smaller long position with limited risk.
Forward I am looking at 1.3 area and looking to scaling in after confirmation above 1.302 ensures that I participate in the trend continuation without overexposing prematurely.
Step 1: Small Entry at 1.287
Entry: Long position at 1.287.
Stop Loss: Below 1.2800.
Take Profit: Partial profit near resistance at 1.3000, or hold until breakout confirmation.
Step 2: Scale In After Breakout
Entry Trigger: Wait for price action to break and hold above 1.302 (confirmed by strong candlestick close or volume spike).
Entry Price: Enter larger position at 1.302.
Stop Loss: Below recent breakout level (~1.295).
Take Profit Levels:
First Target: 1.3200.
Second Target: 1.3400.
FX:GBPUSD

USDJPY SELL SETUP!!From a technical perspective, examining the USD/JPY chart, we might notice that prices are forming a lower high, which often indicates a potential downtrend. The price respecting Fibonacci retracement levels can also suggest that the market is reacting to key support and resistance levels. When traders see the price approaching these levels and behaving predictably, it can bolster their confidence in the direction of their trades.
Overall, the expectation is for a continuing strength in the yen, especially if the market sentiment remains focused on potential rate hikes from the Fed. This scenario might lead to more bearish moves for the USD/JPY pair, making it important to watch for any significant economic data releases or comments from central bank officials that could signal changes in monetary policy.

Will ES go more deeper ?The E-mini S&P 500 futures contract ( CME_MINI:ES1! ) exhibited a liquidation profile (Profile A), characterized by two distinct distributions. The subsequent session (Profile B) formed a balanced profile and remained entirely below the lower distribution of Profile A, indicating continued bearish sentiment.
Profile C emerged as a short-covering profile, with its upper boundary testing the high of Profile B by a minimal margin. Both Profile B and C exhibited trading activity around the lower distribution of Profile A without breaching its low. Profiles A, B, and C established a base at the C Line, identified as a longer-term support or demand zone.
Yesterday's session (Profile D) also presented a liquidation profile, briefly trading below the C Line before recovering and maintaining balance around this level. The market demonstrates reluctance for further downside, with lower prices consistently triggering short-covering rallies rather than initiating new selling. Even though Profile D traded lower, it did not exhibit significant selling conviction.
Given the prevailing geopolitical risks, including the ongoing tariff disputes and the unresolved Ukraine-Russia conflict, further liquidation during today's Regular Trading Hours (RTH) remains a possibility.
However, sustained buying interest above the balance of Profile C, driven by short covering and new long positions, would indicate a potential shift in market sentiment towards accumulation on a higher timeframe. The market's behavior during today's RTH session will be crucial in determining the next directional move.

xauusd 30m chart analysis the breackout of resistance.Hello traders
trust on my analysis
here the breackout occure and the gold is on the moon .
As i mentioned if breackout of resistance here the the gold will move upword so watch the gold is flowting there
500+pips profit done .

XAUUSD Refocus Trendback📌Gold price extends the rebound early Monday and re-focuses on the $2,900 level.
📌US Dollar falls as EUR/USD rallies hard on potential Ukraine truce; market mood improves.
📌Gold price recovers but remains below 21-day SMA at $2,895 amid the bullish daily RSI.
🔥Buy Gold
$2832 -> $2834
SL $2825
TP 1->$2840 >2->$2850 >3->$2860
🔥Sell Gold
$2882 -> $2886
SL $2890
TP 1->$2875 >2->$2860 >3->$2855

Market Anticipation: Geopolitical Tensions Signal Volatility ATitle: “ES Futures: Tensions Ahead of the Trump-Zelensky Confrontation”
As markets gear up for what could be a pivotal geopolitical showdown, the S&P 500 E-mini Futures ( CME_MINI:ES1! ) are reflecting cautious positioning. The recent price action has been telling: early-day balance on Thursday gave way to late-session liquidations, and Friday saw a near mirror reversal. This behavior may point to either month-end rebalancing or anticipation of the Trump-Zelensky meeting, where market sentiment seems to be taking cues from factors beyond conventional U.S. policy narratives.
Key Insights:
• Intraday Dynamics:
Thursday’s session witnessed initial equilibrium followed by marked liquidation toward the close, suggesting profit-taking or defensive rebalancing. On Friday, the reversal of Thursday’s moves hints at market indecision—a potential prelude to heightened volatility.
• Geopolitical Catalysts:
The upcoming Trump-Zelensky meeting appears to be a significant driver. Beyond traditional economic factors, markets seem to be pricing in geopolitical risk, as evidenced by the nuanced trading patterns observed in early March.
• Market Breadth:
While the spotlight is on ES futures, other instruments are in play:
• European Front ( EUREX:FDXM1! ): Watch for reactions post-meeting, as European leaders might rally in response.
• Safe Havens ( COMEX_MINI:MGC1! & NYMEX:CL1! ): Gold and oil futures are likely to serve as bellwethers for risk sentiment.
• The Dollar ( CAPITALCOM:DXY ): Expected to strengthen amid a flight to quality, reflecting broader risk-off sentiment.
The market, as always, seems to understand dynamics that sometimes elude policymakers. As we approach this high-stakes meeting, prepare for a potential surge in volatility across asset classes. What are your thoughts on this geopolitical gamble, and how are you positioning your portfolio in anticipation of these events?

DAX futures after Trump - Zeleansky clash meetingMarket Analysis: Anticipating March Volatility
The market is demonstrating superior collective intelligence through recent price action. The EUREX:FDXM1! index has established balanced profile patterns over several consecutive sessions, indicating a lack of directional conviction among participants. This consolidation phase suggests market participants are in a holding pattern, awaiting catalytic information before committing to directional positions .
Friday, February 28th marked both month-end rebalancing and a critical geopolitical event as markets positioned ahead of the Trump-Zelensky meeting. The subsequent contentious Oval Office exchange between the US and Ukrainian presidents on February 28th has created significant geopolitical uncertainty . This high-stakes diplomatic confrontation, which ended without the anticipated minerals agreement being signed, has introduced a new variable into market equations .
Projected Market Impact
Early March is likely to experience heightened volatility across multiple asset classes:
- **European and US Indices**: The breakdown in US-Ukraine relations and resulting implications for European security policy will likely trigger significant price swings in both US and European equity markets . With European leaders now forced to reconsider their defense strategies in light of potentially diminishing US support, market participants must reprice risk premiums accordingly .
- **Commodities**: Oil and gold NYMEX:CL1! COMEX_MINI:MGC1! markets should see amplified movement as geopolitical tensions typically drive safe-haven flows and energy price speculation .
- **Currency Markets**: The dollar CAPITALCOM:DXY is positioned to strengthen against major currencies as uncertainty typically benefits the world's reserve currency, particularly when European geopolitical stability comes into question .
The DAX futures, currently showing mixed signals from analysts with projections ranging from 17,500 to potentially higher levels by year-end, will likely experience increased volatility in the near term as markets digest these developments .

USOILWest Texas Intermediate Oil price continues its upward momentum for the second consecutive day, trading around $70.90 per barrel during European hours on Tuesday. Crude Oil prices are rising as fresh United States sanctions on Iran’s Oil trade heighten concerns about tighter global supply.
WTI rises to near $71.00 following fresh US sanctions on Iran’s Oil

EUR USD Entry Setup 1 hour timeframe. On the 1 hour timeframe EUR USD has formed a
Bullish Break and Retest Pattern.
Now we will wait for the price to pull back to the retest level then enter base off candlesticks confirmations.
What are your thoughts on EU ?

GOLD FLY UPWARD SURE?XAUUSD Intraday Outlook: Bullish momentum persists, driven by strong market sentiment and technical support. A breakout above key resistance could open the path for further gains. Long positions remain favorable, with caution around potential consolidations or retracements."

ES still in decision after drop before xmasBond Auction Demand Analysis
The recent 10-year Bond Auction showed weaker demand with a 0.2 tails basis point, indicating reduced investor interest compared to previous auctions. The high bid-to-cover ratio of 2.53 suggests challenges for the stock market rally as investors seek higher yields. A 30-year Bond Auction on January 9th will provide further insights into market trends.
Jobless Claims Report Impact
The Initial Jobless Claims report showed favorable results, which could support a steady move in the market, particularly in the CME_MINI:ESH2025 ES index. Traders are closely monitoring these developments as they assess the implications for interest rates and overall market performance.
Market Reaction and Expectations
During the first session of the US market, there was little decision-making movement, indicating a need for more information on market reactions. With a national holiday approaching and a 30-year Bond Auction scheduled, a quieter market is expected in the interim.

ES on early Jan'25 CME_MINI:ESH2025
Market Balance Dynamics
The market is currently exhibiting a prolonged initial balance on the downside, indicating a period of consolidation.
Accumulation of Passive Buyers
There seems to be a potential accumulation of passive buyers taking advantage of the downtrend, suggesting that buying interest may be building.
Uncertainty in Market Movements
However, it is still too early in the market to predict definitive movements, leaving room for either further downward trends or recovery.

#GOLD #TODAY GOLD TODAY
Gold broke the 2630 zone to extend its rally to near 2640 yesterday. And is now declining back to test the breakout zone.
Gold seems to be moving in an uptrend channel and could target the 50% Fib zone of the previous decline around 2655. Therefore, in the Asian session, you can wait to buy gold around the 2628-2630 zone. If you want to sell, you have to wait for a market decline to ensure safety.

ICT Weekly Range Profiles - *Early* Classic Mon High of the WeekNews from Oct 19, 2020
"Stock market live Monday: Dow sheds 400 points, stimulus concerns, Covid-19 cases hit 40 million" - CNBC
www.cnbc.com
"Stock market news live updates: Wall Street slumps on fading pre-election stimulus hopes, Dow has worst day in nearly a month" - Yahoo Finance
finance.yahoo.com

XAUUSD 1HR CHART UPDATEXAUUSD Analysis The price has decisively broken through the previous resistance zone, confirming bullish momentum, and is now on track to potentially reach the next significant level at 2678. This move sets the stage for a strategic buying opportunity tonight let's watch the market together...

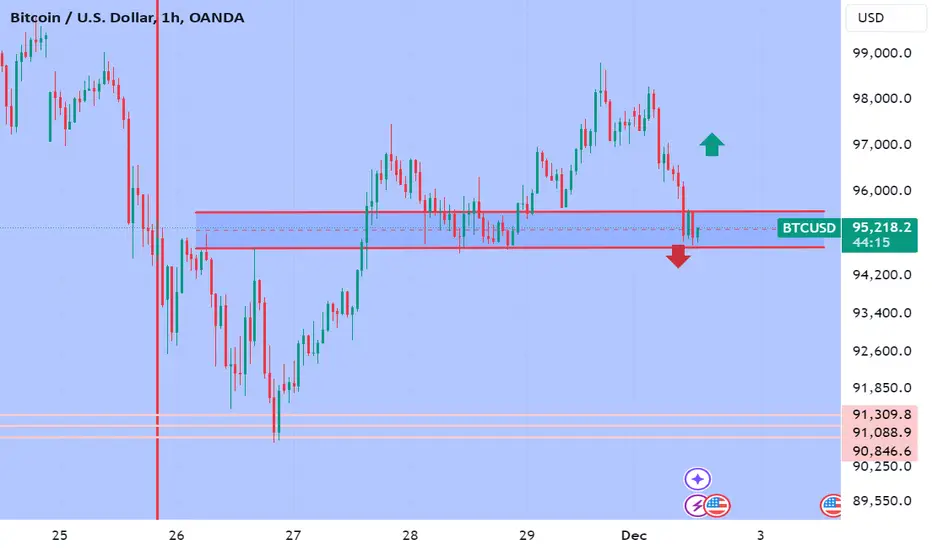
BTC AT IMPPORTANT LEVELBitcoin is at a pivotal juncture, testing an important price level that could define its next move. A breakout above this zone could signal renewed bullish momentum, attracting fresh interest from traders and investors. On the other hand, rejection here might lead to consolidation or a pullback, highlighting the importance of this level in shaping BTC's short-term trend. All eyes are on the charts as the market awaits the next big move..
Gold 100% Confirmed Signal alert!XAUUSD Insight: Currently Gold make support After Big fish hunting small fish in market and today market is Fall 800+ pips now time to Gold fly again same point where shark hunt small fish.
Downside Watch: Stay cautious for potential drops if it dips below this range! Targets: 2615,2610
Upside Watch: Look for buying signals if it rises above! Targets: 2645,2660
