EURUSD Bullish move to continue - 340 PIPS OPPORTUNITYEURUSD to continue Bullish move after a short retracement. At market open pair may take a retracement and test area of 0.9765 and then go Bullish to test area of 1.0120.
Buy around 0.9765
Take Profit: 1.0120
Stop Loss: 0.9720
Markets

Critical Supports are holding strong! Double bottom?SPY (and other indices) supports are holding strong traders. Dollar is dumping. Do we get a double-bottom pattern followed by a blow-off top the likes of which most investors will have never seen coming? Support must hold.

SPY - Update (From Nov. 2021)Posting an update on the SPY here as the markets closed out the week in somewhat of a make or break spot. The SPY continued to follow the bearish megaphone that it's been holding for months, while simultaneously holding the downtrend stemming from a massive head and shoulders on the SPY's weekly timeframe (See Attached Charts Below). A bearish bat harmonic pattern also formed on the SPY on Friday, as it broke below a strong support level circa $368.27 and closed near its 52-Week low at $362.17. This comes as seller volume continues to outweigh buyer volume as the markets head into a big week economically speaking. In the upcoming week, economic data and events include New Home Sales, Consumer Confidence, International Trade Numbers, Jobless Claims, and to cap off the week, GDP Numbers as well. Treading lightly here, some RSI-based supply and demand zones to keep an eye on in the interim, bearish and hedged-
--Previous Charts Attached Below--
Weekly TimeFrame
Testing Key Levels From 2020
--Previously Charted--

If/Then Rate Hike SceneriosIf 100 bps, then break below support & cont. down.
If 75 bps, then remain above bottom support.
If 75 bps & hints of future pivot, then back into triangle with breakout imminent.
If 50 bps, then To The Moon!

Head & Shoulders on BTCBitcoin is trading indecisively (as are broader markets) and is forming a head & shoulders pattern right at the lower bear flag border. Neckline and target are shown here in purple.

Spotify LongSpotify forming daily bullish divergence at the 103.44 support if the bids come in it has a potential rally to the next zone at 153.73 if the resistance is broken it could reach 200$ target for a gap fill

1 Year Of BTC El Salvador CelebratesEl Salvador has used Bitcoin for a year.
El Salvador started using Bitcoin as a legal tender a year ago after President Nayib Bukele made a contentious choice. The public welcomed the new chance with enthusiasm, but since then, Bitcoin's value has fallen, and some experts believe the initiative was a disaster.
Bitcoin is up 2.72% today, Ethereum is up 8%, and Solana is up nearly 5% as the cryptocurrency markets rebound.
This Thursday morning, cryptocurrency markets are up. Pololu, Polygon, and Ethereum have made gains. Shiba Inu and Dogecoin, two meme coins, have also increased in value over the past 24 hours. Volatility has been seen in stablecoins.
"More CBDC news," the Ripple advisor teases.
According to Ripple, it may soon reveal additional information regarding its central bank digital currency projects.
Advisor to the CBDC Antony Welfare
The last session saw a 3.1% increase in BTC/USD.
The latest session saw a massive 3.1% increase in the Bitcoin-Dollar pair. The MACD is sending a negative signal. Resistance is at 20712.8113, while support is at 17730.3773.

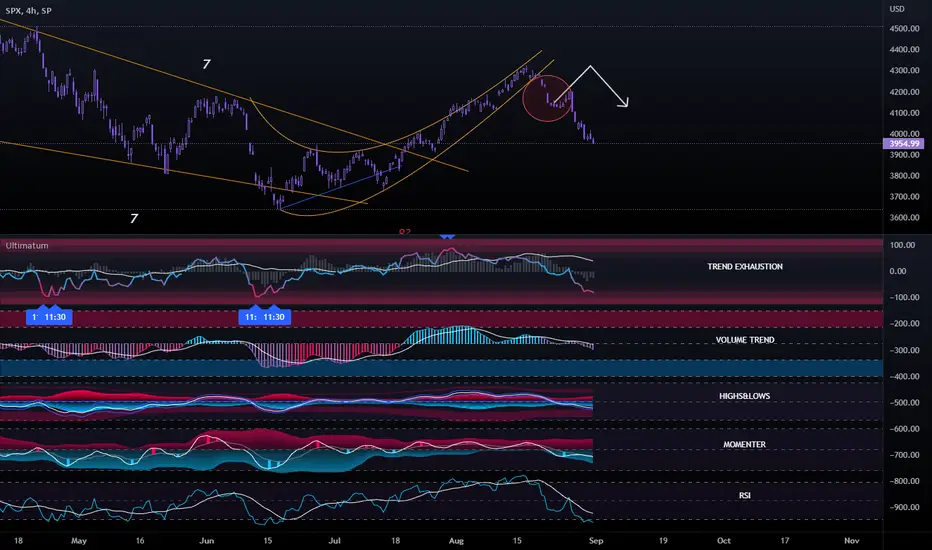
SPX getting readySPX has bounced as predicted, but the strength wasn't there - it went even lower before retesting the local top, but now parameters are looking great. Trend Exhaustion is very low on H4, Highs&Lows and Momenter are also on the lower part of the graph - and most importantly - RSI is totally oversold. Upcoming NFP could be a trigger to push the markets up next week.
DXY exhaustedHere as expected - DXY is exhausted with pushing so much up, that it didn't even reach the wedge's top line and stopped at the horizontal resistance. It started moving down and expecting it to move as I previously predicted - go for the bottom of the wedge - and a final bounce up and go down for the much needed retracement.
Additionally EURUSD is also looking exhausted from pushing down and needs some relief - which would be weakening the Dollar aswell.
All of that is bullish for stocks and crypto.

VIX isn't bearishAfter the HTF wedge breakout - we are expecting a retest - and it just started going down filling the gaps - although we didn't fully reach my wedge target yet. Therefore I expect it to happen after we retest the wedge (even better if we do so before that).
One thing is good here - VIX didn't go parabolic after a long bullish streak on the markets - meaning fundamentals aren't so bearish yet. It will happen, but doesn't seem just now.
We stick to the plan.

ECONOMIC UNITED STATES GDP compared with Other NationsThis chart illustrates the GNP of the USA compared with others over a period
of several decades. The USA is on a much slower trajectory of growth than
all the other countries on the chart except Russia and Ukraine. This
includes the Eurozone, China, India, Mexico, and others. This trend
has been in place for decades. It makes for a poor prognosis for
the future of the US economically, no matter how much our politicians
and other influencers try to hide this.

UNFI: Still Bullish; Mega Breakout Still Imminent Recent pullback likely nothing more than a shakeout before we moon. We have corrected to fib 0.618, 4hr Vegas Wave, and trend line, so there is a strong possibility we start moving back up from here.

EUR/USD at its 2022 downtrend - one to watch!Key points:
EUR/USD about to test its 55-day ma and downtrend at 1.0371/85
We have a mild buy signal on the daily DMI, which we have not seen since June
The market is turning at the base of its longer tern down channel and long term Fibo
Should A CLOSE above the downtrend occur we should see a stronger corrective move to 1.05 then 1.0636
The Society of Technical Analysts' next course starts in October. Those wishing to learn more about technical analysis can take a look at the Route to Diploma - Society of Technical Analysts, www.technicalanalysts.com
Disclaimer:
The information posted on Trading View is for informative purposes and is not intended to constitute advice in any form, including but not limited to investment, accounting, tax, legal or regulatory advice. The information therefore has no regard to the specific investment objectives, financial situation or particular needs of any specific recipient. Opinions expressed are our current opinions as of the date appearing on Trading View only. All illustrations, forecasts or hypothetical data are for illustrative purposes only. The Society of Technical Analysts Ltd does not make representation that the information provided is appropriate for use in all jurisdictions or by all Investors or other potential Investors. Parties are therefore responsible for compliance with applicable local laws and regulations. The Society of Technical Analysts will not be held liable for any loss or damage resulting directly or indirectly from the use of any information on this site.

Potential base on bitcoin??The Society of Technical Analysts' next course starts in October. Those wishing to learn more about technical analysis can take a look at the Route to Diploma - Society of Technical Analysts, www.technicalanalysts.com
Disclaimer:
The information posted on Trading View is for informative purposes and is not intended to constitute advice in any form, including but not limited to investment, accounting, tax, legal or regulatory advice. The information therefore has no regard to the specific investment objectives, financial situation or particular needs of any specific recipient. Opinions expressed are our current opinions as of the date appearing on Trading View only. All illustrations, forecasts or hypothetical data are for illustrative purposes only. The Society of Technical Analysts Ltd does not make representation that the information provided is appropriate for use in all jurisdictions or by all Investors or other potential Investors. Parties are therefore responsible for compliance with applicable local laws and regulations. The Society of Technical Analysts will not be held liable for any loss or damage resulting directly or indirectly from the use of any information on this site.

DXYHi all,
DXY is in parabolic trend and cash is king.
9 WEMA holding like a hero so no many reason to be bearish until now.
However a bearish divergence can slow the parabolic trend.
If DXY slows down we can see the markets pumpin' for short term.
The BTC and crypto can also see a bear market pump.
What do you think?

The RSI can help determine how far the correction can goWith the US continuing to increase interest rates and potentially being in a recession, it was surprising to see markets perform so well last week. However, with Powell seemingly inferring a softer stance, the S+P charted a decent rally.
Technically we continue to view the rebound as a bear market rally that has already reached the 50% retracement of the sell off since April at 4136.
So how far is the market likely to correct? This is a tricky one to answer, but I like to look at any convergence of resistance and Fibonacci retracement and the 9-period RSI can give vital clues.
When I look at the S+P I can see the June high at 4177.51, the 61.8% retracement at 4254 and the 200-day ma at 4344. With an RSI already at 71, my feeling is that the market will fail ahead of that 200-day ma!
The Society of Technical Analysts' next course starts in October. Those wishing to learn more about technical analysis can take a look at the Route to Diploma - Society of Technical Analysts, www.technicalanalysts.com
Disclaimer:
The information posted on Trading View is for informative purposes and is not intended to constitute advice in any form, including but not limited to investment, accounting, tax, legal or regulatory advice. The information therefore has no regard to the specific investment objectives, financial situation or particular needs of any specific recipient. Opinions expressed are our current opinions as of the date appearing on Trading View only. All illustrations, forecasts or hypothetical data are for illustrative purposes only. The Society of Technical Analysts Ltd does not make representation that the information provided is appropriate for use in all jurisdictions or by all Investors or other potential Investors. Parties are therefore responsible for compliance with applicable local laws and regulations. The Society of Technical Analysts will not be held liable for any loss or damage resulting directly or indirectly from the use of any information on this site.

Ripple records $408 million sold in Q2TL;DR Breakdown
Swell ODL volume expanded 9x YoY during the last quarter of 2022.
In Q2, the blockchain organization sold more than $408 million in XRP tokens.
Be that as it may, both the cost and volume of the XRP declined in the midst of specific market factors.
Blockchain installment organization Ripple delivered its Q2 monetary report on Friday, itemizing an amazing development in exchanges and On-Demand Liquidity (ODL) volume, regardless of the new accident of the cryptographic money market.
Wave's ODL expanded 9x
Swell said Q2 2022 was a record quarter for its On-Demand Liquidity further extended past installment and conventional settlement administrations, subsequently raising the volume by up to 9x year-over-year. ODL is a liquidity stage that use XRP to work with minimal expense cross-line installments on RippleNet. Swell expressed the majority of the volume in Q2 came from depository streams and mass installments.
The organization additionally referenced that it sold $408.9 million XRP tokens in the past quarter through its ODL administrations, contrasted with the $273 million XRPs it sold in Q1 of the year. The report peruses that how much XRP sold during Q2 likens to around 0.47% of XRP's worldwide volume. At last, the expansion in XRP deals credits to the development and reception of ODL.
"Swell has kept on taking part in deals exclusively connected with ODL and these volumes have sloped up significantly as Ripple's ODL business extended all around the world."
Swell likewise noticed an enormous expansion in exchange counts. Per the report, the exchanges on the XRP Ledger additionally expanded to around 114.6 million, which represented $58.3 billion or 126.5 billion XRP in volume.
XRP value, the volume endures a shot
Regardless of the ODL's development, the cost of XRP and everyday exchanged volume endured a shot in the midst of the negative condition of cryptographic money and the more extensive resources market. XRP volume dropped by 22% QoQ, from a typical everyday volume of $1.1 billion to $862 million, per the report.
During the hour of composing, XRP was up more than 4% to $0.371 during the 24hrs time period. The market capitalization was at $17.9 billion from a coursing supply of 48.34 billion XRP tokens.
LIKE COMMENT AND SHARE.

Markets how to execute Quarters theory This is a trade example of how the Quarters theory trading system works with market session activities highlighted. We are looking at a 25 pip chart. Trading between 1.76 and .175 over the last 2 weeks we have seen 13 successful trades within a 10 cent range. I go over this system a lot because of its low risk high reward strategy of 1:4 1:10 and 1:100 very nice. If you want to find out more about how I use the system check out one of my video ideas or streams.

Gasoline Bearish Formation"Gasoline... breakfast of champions" - Joe Dirt
Consistent with our view of #Oil, gasoline shows us a beautiful bear wedge.
Are we all just expected to pay $4.50+ / gal of gasoline? This seems like a tall ask for the American consumer, considering prices are significantly elevated across most of the American ( & global ) economy.
Emerging markets getting beat up all around the globe
Commodities have started to selloff
Interest rates are rising
USD ripping higher
crypto bubble... popping...?
Let's see how it goes!
God bless!

BTC/USDT WEEKLY ANALYSIS JULY 2022So here is detail analysis of btc on weekly time frame BTC is trading in long term bearish trend and now currently trading at 19.4k with strong support 18.5k and 17.5k which is local Demand zone and 29k ATH Resistance and strong resistance of last upward trend at 23k . On breakdown from 17.5k market will be on the way towards deom 13.5k to 12.8k area.
here most important areas are 17.5k which needs to hold otherwise market will be towards 13k . and Resistance level 23.4k needs to break for the confirmation of new uptrend

AUDUSDQ1 0.7 - 0.675
Over the last 2 months this price point has seen
weakening buyer over time as we approach 0.675
expect a relief rally of sellers that have gotten in near the top of the quarter.
21 day
14 day Vwap
These show us the momentum of the chart has been to the downside
If we were wanting the best entry we would wait
till price gets closer to the 14 - 21 day Vwap and possible above

Corn Consolidates Ahead of USDA Report
Corn
Fundamentals: Corn futures have traded both sides of unchanged in the overnight and early morning session as prices consolidate ahead of end of month, end of quarter, and all-important USDA report. The range of estimates for acres comes in from 88.4-91.0 million. In March the USDA was at 89.5. The average estimate for US corn stocks as of June 1 is 4.345 billion bushels. In last year’s report we were at 4.111.
Technicals (September): Consolidation is the name of the game as we inch closer to the highly anticipated USDA report. With the market chopping around and not really going anywhere, many of our support and resistance levels remain unchanged. Resistance levels come in near 680ish and more significantly 700ish. The upper end would be a retracement of last week’s secondary breakdown point and represents the 100-day moving average, not to mention the psychological significance. On the support side, 645-652 ½ is the pocket the Bulls want to defend.
Bias: Neutral/Bearish
Previous Session Bias: Neutral/Bearish
Resistance: 678 ¼-684 ½**, 697-701****
Support: 645-652 ½****, 624-630****, 589 ¼***
Futures trading involves substantial risk of loss and may not be suitable for all investors. Trading advice is based on information taken from trade and statistical services and other sources Blue Line Futures, LLC believes are reliable. We do not guarantee that such information is accurate or complete and it should not be relied upon as such. Trading advice reflects our good faith judgment at a specific time and is subject to change without notice. There is no guarantee that the advice we give will result in profitable trades. All trading decisions will be made by the account holder. Past performance is not necessarily indicative of future results.

Gold Teasing Bear Flag BreakdownGold flirts with the lower end of the bear flag at press time.
A UTC close lower would signal a resumption of the broader downtrend, represented by the falling channel.
Support at $1,787 (May 16) and $1,757 (Dec. 15 low).
Macro supports bearish case - Talk of ECB 50 bps rate hike in July + continued Fed tightening.
