EURO LIFTS POST-GERMAN VOTE—BUT USD BITES BACKEURO LIFTS POST-GERMAN VOTE—BUT USD BITES BACK FX:EURUSD
(1/9)
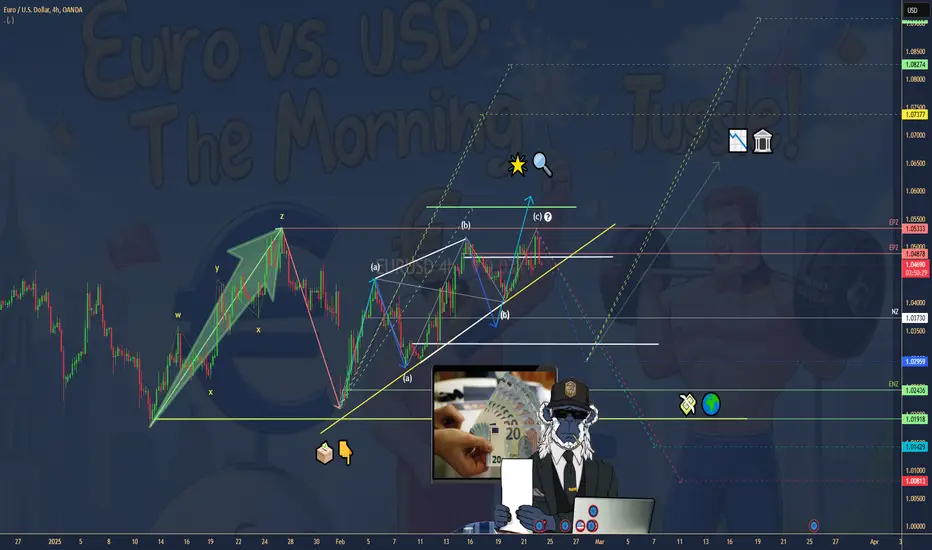
Good morning, Tradingview Fam! Germany’s election—Merz and CDU on top—gave the euro a quick jolt, up 0.44% to $1.0507 📈🔥. Markets dig the stability vibe, but it’s fading fast—let’s unpack this tussle! 🚀
(2/9) – ELECTION SPARK
• Euro Bump: Hit $1.0530 overnight—election cheer 💥
• Markets: DAX futures up 1.2%, EUROSTOXX 50 +0.66% 📊
• Fade: Now at $1.0480—USD’s flexing back
Brief lift—stability’s sweet, but not sticky!
(3/9) – TECH TELLTALE
• Resistance: $1.0500-1.0510 wall holds firm 🌍
• Support: $1.0470 pivot, then $1.0440 if it slips 🚗
• Charts: Double top whispers at $1.0530 🌟
Traders on X see a retreat—bearish juice brewing?
(4/9) – USD PUSHBACK
• Jobless Claims: Weak last week, USD softened a tad 📉
• Fed: No rush to cut—rates steady, Nvidia looms
• Muscle: Dollar’s clawing back—ballast holds
AMEX:USD ’s got grit—euro’s nudge ain’t enough! 🌍
(5/9) – RISKS IN PLAY
• Volatility: PMI data, Nvidia earnings stir the pot ⚠️
• Sentiment: X split—liquidity grab or bear turn? 🏛️
• Levels: Below $1.0470 opens $1.0390 risk 📉
Quick sprint—can euro keep the pace?
(6/9) – SWOT: STRENGTHS
• Election Lift: CDU win sparks euro hope 🌟
• Markets: European futures pop—optimism flows 🔍
• Cash: $1.0530 peak shows buyer guts 🚦
Euro’s got some spark—briefly lit!
(7/9) – SWOT: WEAKNESSES & OPPORTUNITIES
• Weaknesses: $1.0510 cap, USD fights back 💸
• Opportunities: PMI beats could push $1.0600 🌍
Will euro dodge the dollar’s jab?
(8/9) – Euro’s election bump—what’s your call?
1️⃣ Bullish—Stability wins out.
2️⃣ Neutral—Blip, not a trend.
3️⃣ Bearish—USD takes the ring.
Vote below! 🗳️👇
(9/9) – FINAL TAKEAWAY
Euro spiked to $1.0507 on Germany’s vote—CDU’s steady hand 🌍🪙. Now $1.0480—USD’s got claws. Resistance bites, downside looms—blip or bust?
Markets
SOLID BIOSCIENCES—$SLDB CASHES UP FOR GENE THERAPY PUSHSOLID BIOSCIENCES— NASDAQ:SLDB CASHES UP FOR GENE THERAPY PUSH
(1/9)
Good afternoon, Tradingview! Solid Biosciences is stacking cash—no revenue yet, but a $200M raise has tongues wagging 📈🔥. NASDAQ:SLDB ’s betting big on gene therapy—here’s the scoop! 🚀
(2/9) – CASH, NOT SALES
• Revenue: Zilch—clinical-stage vibes 💥
• Q3 ‘24 Loss: $0.61/share, missed $0.58 est. 📊
• Cash Boost: $200M offering just landed
No sales, but NASDAQ:SLDB ’s war chest is growing!
(3/9) – BIG MOVE
• Feb 18 Raise: $200M via 35.7M shares, warrants 🌍
• Cash Pile: Was $171M, now nearing $350M 🚗
• Goal: Fuel SGT-003 trials into ‘27 🌟
NASDAQ:SLDB ’s loading up for the long haul!
(4/9) – SECTOR CHECK
• Market Cap: $500M post-raise 📈
• Vs. Peers: Sarepta’s 13B dwarfs it—revenue rules
• Edge: Low EV ($150M), big therapy dreams
Undervalued biotech bet or long shot? 🌍
(5/9) – RISKS ON DECK
• Trials: SGT-003 flops could sink it ⚠️
• Sentiment: 30% drop from Jan peak—jitters 🏛️
• Burn: $20-25M/quarter—clock’s ticking 📉
High stakes, high risks—can it deliver?
(6/9) – SWOT: STRENGTHS
• Cash: $200M raise powers trials 🌟
• SGT-003: Early data dazzles, Fast Track nod 🔍
• DMD Focus: Huge need, blockbuster shot 🚦
NASDAQ:SLDB ’s got fuel and firepower!
(7/9) – SWOT: WEAKNESSES & OPPORTUNITIES
• Weaknesses: No revenue, all-in on one play 💸
• Opportunities: $2-4B cap if trials pop 🌍
Can NASDAQ:SLDB turn cash into a cure?
(8/9) – NASDAQ:SLDB ’s $200M haul—your take?
1️⃣ Bullish—Gene therapy gold ahead.
2️⃣ Neutral—Wait for trial proof.
3️⃣ Bearish—Risks outweigh the buzz.
Vote below! 🗳️👇
(9/9) – FINAL TAKEAWAY
NASDAQ:SLDB ’s revenue-free, but $200M keeps SGT-003 alive—stock’s buzzing 🌍🪙. Low EV vs. peers, yet trials and rivals loom. Cure or bust?

U.S. FIRMS SWAP DOLLARS FOR EURO to lower funding costsU.S. FIRMS SWAP DOLLARS FOR EURO to lower funding costs—SMART MOVE?
(1/9)
Good afternoon, Tradingview! U.S. companies are flipping dollar debt into euros—slashing borrowing costs 📈🔥. Cross-currency swaps are the hot ticket amid rate gaps. Let’s break it down! 🚀
(2/9) – SWAP SURGE
• Trend: Dollar bonds morph into euros 💥
• Why: Eurozone rates lag U.S. by ~200 points 📊
• Volume: $266B in Jan ‘25 swaps, up 7% YoY
Lower rates, big savings—companies pounce!
(3/9) – THE TRIGGER
• Fed: Holds steady—U.S. rates stay high 🌍
• ECB: Eases up—eurozone softens 🚗
• Trump Tariffs: Stir inflation fears—volatility spikes 🌟
Dollar strength pushes firms to euro deals!
(4/9) – HOW IT WORKS
• Swap: Trade dollar debt for euro payments 📈
• Gain: Cheaper interest, currency hedge
• Impact: Millions saved, euro cash flows shine
It’s a financial jujitsu move—clever stuff! 🌍
(5/9) – RISKS IN PLAY
• Euro Flip: Stronger euro could zap savings ⚠️
• FX Losses: Hedging costs climb if dollar dips 🏛️
• Uncertainty: Fed vs. ECB—rate dance wobbles 📉
Smart bet, but not risk-free!
(6/9) – WHY NOW?
• Rate Gap: U.S. high, eurozone low—carry’s juicy 🌟
• Trump Effect: Tariffs fuel dollar power 🔍
• Global Ops: U.S. firms shield Europe earnings 🚦
Timing’s ripe—swaps are the shield!
(7/9) – MARKET VIBE
• Early ‘25: Swap restructures cash in 🌍
• Savings: redirected to debt, flexibility 📈
• Trend Watch: Grows if rate split holds
Companies adapt—financial acrobatics in action!
(8/9) – Dollar-to-euro swaps—what’s your take?
1️⃣ Bullish—Cost cuts win big.
2️⃣ Neutral—Works now, risks later.
3️⃣ Bearish—Euro rebound kills it.
Vote below! 🗳️👇
(9/9) – FINAL TAKEAWAY
U.S. firms swap dollars for euros—saving millions as rates diverge 🌍🪙. Tariffs and Fed fuel the play, but euro risks lurk. Genius or gamble?

$TKA THYSSENKRUPP & IVECO—HIDDEN DEFENCE GEMS SHINEXETR:TKA THYSSENKRUPP & IVECO—HIDDEN DEFENCE GEMS SHINE
(1/9)
Good afternoon, Tradingview! Thyssenkrupp’s stock soared 20% this week—defence spending’s the buzz 📈🔥. Investors eye TKMS and Iveco’s IDV as undervalued stars. Let’s unpack this rally! 🚀
(2/9) – MARKET SURGE
• Thyssenkrupp: 20% spike Monday, 53% YTD 💥
• Iveco: 68% YTD—IDV’s 10% margin shines 📊
• Driver: Europe’s military budget boom
Defence cash is flipping the script—big gains!
(3/9) – DEFENCE PLAYS
• TKMS Spin-Off: Warship unit set for ‘25 🌍
• Iveco IDV: Defence arm spins out in ‘25 🚗
• BofA: TKMS worth half Thyssenkrupp’s cap 🌟
Hidden gems catching the spotlight!
(4/9) – SECTOR SNAPSHOT
• Defence P/E: 25.8x vs. 18x 3 yrs ago 📈
• Thyssenkrupp & Iveco: ~8x—bargains?
• Vs. Giants: Rheinmetall, BAE soar, but these lag
Value hunt’s on—undervalued or overhyped? 🌍
(5/9) – RISKS TO WATCH
• Peace Talks: Ukraine deal softens demand? ⚠️
• Execution: Spin-offs need to deliver 🏛️
• Focus: Beyond big defence names risky 📉
Rally’s hot—can it hold the heat?
(6/9) – SWOT: STRENGTHS
• Thyssenkrupp: €16B+ TKMS backlog 🌟
• Iveco: IDV’s 10% profit margin 🔍
• Cash Flow: Thyssenkrupp hits €0-300M ‘25 🚦
Defence muscle’s flexing hard!
(7/9) – SWOT: WEAKNESSES & OPPORTUNITIES
• Weaknesses: Thyssenkrupp’s steel drag, Iveco’s focus 💸
• Opportunities: EU budget hikes, spin-off buzz 🌍
Can these sleeper hits wake up big?
(8/9) –Thyssenkrupp & Iveco defence bets—your call?
1️⃣ Bullish—Spin-offs spark a surge.
2️⃣ Neutral—Growth’s there, risks balance.
3️⃣ Bearish—Rally fades fast.
Vote below! 🗳️👇
(9/9) – FINAL TAKEAWAY
Thyssenkrupp’s 20% leap, Iveco’s IDV glow—defence cash ignites hidden plays 🌍🪙. Cheap vs. giants, but risks lurk. Gems or mirage?

APPLOVIN’S Q4 2024—$APP BLASTS OFF WITH AI-AD SURGEAPPLOVIN’S Q4 2024— NASDAQ:APP BLASTS OFF WITH AI-AD SURGE
(1/9)
Good evening, Tradingview! AppLovin’s Q4 2024 earnings hit—$1.37B revenue, up 44% YoY, crushing $1.26B estimates 📈🔥. AI-powered AXON drives a 37% stock pop. Let’s unpack NASDAQ:APP ’s monster quarter! 🚀
(2/9) – REVENUE & EARNINGS
• Q4 Revenue: $1.37B, +44% YoY ($953.3M Q4 ‘23) 💥
• Ad Revenue: $999.5M, +73% YoY
• Apps Revenue: $373.3M, -1% YoY 📊
• EPS: $1.73, beats $1.24 est.
• Net Income: $599.2M, +248% YoY
(3/9) – BIG MOVES
• Stock Surge: +37% post-earnings (Feb 13) 🌍
• Buybacks: $2.1B retired 25.7M shares in ‘24 🚗
• Debt Play: $3.55B notes issued Nov ‘24 💸
• Q1 ‘25 Guide: $1.355-1.385B, tops $1.32B est.
(4/9) – SECTOR SHOWDOWN
• Market Cap: $175B (Feb 13) 🌟
• Trailing P/E: 116 vs. TTD (50), META (33)
• Growth: 44% YoY beats TTD (26%), META (19%)
• 1Y Stock: +1,000%, 2Y: +3,000%
Premium price, growth screams value!
(5/9) – RISKS TO FLAG
• Valuation: 116 P/E—high stakes, no misses 📉
• Debt: $3.51B vs. $567.6M cash—leverage looms ⚠️
• AI Rivals: Google, Meta eye AXON’s turf 🏛️
• Regs & Economy: Ad spend cuts lurk
(6/9) – SWOT: STRENGTHS
• Growth: 44% revenue, $599M profit soars 🌟
• Margins: 62% EBITDA, $2.1B FCF in ‘24 🔍
• AXON: 73% ad surge—AI’s the champ 🚦
NASDAQ:APP ’s a profit powerhouse!
(7/9) – SWOT: WEAKNESSES & OPPORTUNITIES
• Weaknesses: Apps dip (-1%), $3.51B debt 💸
• Opportunities: E-commerce ads, AI edge, acquisitions 🌍
Can NASDAQ:APP turn risks into riches?
(8/9) – NASDAQ:APP ’s Q4 stuns—where’s it headed?
1️⃣ Bullish—AI keeps it soaring.
2️⃣ Neutral—Growth holds, risks balance.
3️⃣ Bearish—Valuation bites back.
Vote below! 🗳️👇
(9/9) – FINAL TAKEAWAY
AppLovin’s Q4 dazzles—$1.37B revenue, $599M profit, stock blazing 🌍🪙. High P/E, but AI growth shines. Debt and rivals loom—gem or peak?

$SEDG BEATS + and No Worries! Confessions from the DeskConfessions from the Desk: 10X, Black Coffee, and No Worries
SolarEdge is up 20%, and my Feb 21, 2025, $20 strike call has officially 10X’d. That’s right—after weeks of my portfolio looking like a crime scene, I’ve finally hit a clean, beautiful, 10X multiplier.
And today? I’m sipping my black coffee like a hedge fund manager who actually knows what they’re doing. Not even the endless tariff talk, geopolitical panic, or Fed fearmongering can shake me today. Let them try—I’ll just take another sip.
Now, let’s be real. Am I suddenly a genius? No. Did I see this coming? Also no. But I’m here, and I’m winning. And in this market, that’s all that matters.
So cheers to today. The market gods have finally smiled upon me.

AIRBNB’S Q4 2024—$ABNB SOARS WITH RECORD GROWTHAIRBNB’S Q4 2024— NASDAQ:ABNB SOARS WITH RECORD GROWTH
(1/9)
Good morning, Tradingview Fam! Airbnb’s Q4 2024 earnings dropped—$2.5B revenue, up 12% YoY, topping $2.42B estimates 📈🔥. Nights booked hit 111M, and a $14% stock surge shows the market’s love. Let’s unpack NASDAQ:ABNB ’s big win! 🚀
(2/9) – REVENUE & EARNINGS
• Q4 Revenue: $2.5B, +12% YoY ($2.2B Q4 ‘23) 💥
• Net Income: $461M vs. -$349M loss last year
• EPS: $0.73, beats $0.61 est. 📊
• Adj. EBITDA: $765M, +4% YoY, 30.8% margin
• GBV: $17.6B, +13% YoY
Travel demand’s fueling the fire!
(3/9) – KEY HIGHLIGHTS
• Stock Surge: +14% post-earnings (Feb 14) 🌍
• Buybacks: $838M in Q4, $3.4B for 2024 🚗
• New Ventures: $200-250M investment in travel services for May ‘25 ✅
NASDAQ:ABNB ’s betting big on growth beyond stays!
(4/9) – SECTOR SHOWDOWN
• Market Cap: ~$102B, Stock: $161.2 🌟
• Trailing P/E: 48.87 vs. BKNG (23), EXPE (15)
• Outperforms: 12% revenue growth beats BKNG (6%), EXPE (2%)
Premium valuation, but $4.5B free cash flow says it’s earned!
(5/9) – RISKS TO WATCH
• Economy: Retail sales dip hints travel cuts 📉
• Regs: NYC bans, Barcelona threats loom 🏛️
• Competition: BKNG, EXPE, hotels fight back ⚔️
• Costs: $200-250M spend may squeeze Q1 margins ⚠️
(6/9) – SWOT: STRENGTHS
• Growth: 12% revenue, $461M profit shines 🌟
• Cash: SEED_TVCODER77_ETHBTCDATA:9B net, $4.5B FCF powers buybacks 🔍
• Tech: 535+ upgrades boost scale 🚦
NASDAQ:ABNB ’s a travel titan with muscle!
(7/9) – SWOT: WEAKNESSES & OPPORTUNITIES
• Weaknesses: High P/E (48.87), Q1 margin dip 💸
• Opportunities: New services ( SEED_TVCODER77_ETHBTCDATA:1B + potential), LatAm/Asia boom 🌍
Can NASDAQ:ABNB turn expansion into gold?
(8/9) – NASDAQ:ABNB ’s Q4 rocks—where’s it headed?
1️⃣ Bullish—Growth keeps climbing.
2️⃣ Neutral—Solid, but risks hover.
3️⃣ Bearish—Valuation caps it.
Vote below! 🗳️👇
(9/9) – FINAL TAKEAWAY
Airbnb’s Q4 dazzles—$2.5B revenue, stock soaring, new bets in play 🌍. Premium P/E vs. peers, but growth screams value. Risks lurk—regs, economy. Gem or peak?

$SHOP’S Q4 2024—E-COMMERCE KING OR OVERHYPED HUSTLE?NYSE:SHOP ’S Q4 2024—E-COMMERCE KING OR OVERHYPED HUSTLE?
(1/9)
Hey Tradingview crew! Shopify’s Q4 2024 is dropping jaws 📈🔥! $2.81B in revenue—31% YoY blast—$94.5B GMV, and a fat cash flow flex. Is NYSE:SHOP the champ or just flexing? Let’s rip it open! 🚀
(2/9) – REVENUE & EARNINGS BLOWOUT
• Q4 Revenue: $2.81B, +31% YoY—smoked $2.73B est. 💥
• Subscription: $666M, +27%
• Merchant Solutions: $2.15B, +33%
• EPS: $0.44, edged $0.43 est. 📊
• FCF: $611M, 22% margin— GETTEX:25M over est.
NYSE:SHOP ’s cash machine is humming!
(3/9) – BIG WINS
• GMV: $94.5B, +26%—fastest since ‘21 🚗
• Full Year: $8.88B revenue, +25.78% 🌍
• 3-Month Trials: New twist for Q1 ‘25 subs ✅
• Enterprise: 114 deals in 10 quarters—B2B up 132%!
X is buzzing— NYSE:SHOP ’s scaling like a beast!
(4/9) – SECTOR SMACKDOWN
• Market Cap: ~$151.5B, P/E 81, P/S 14.3 🌟
• Vs. NASDAQ:BIGC : Lagging, $CRM/ NASDAQ:ADBE : Broader focus
• NYSE:SHOP ’s 31% growth smokes peers—$94.5B GMV flexes
Pricey, but is it a steal for this hustle? X debates!
(5/9) – RISKS TO DODGE
• Amazon & WooCommerce: Claws out for NYSE:SHOP ’s turf 📉
• Economy: Slowdown could choke GMV ⚠️
• Tariffs: Duty hikes loom— NYSE:SHOP ’s got tools, but ouch!
• Costs: Intern army in ‘25—cash burn risk?
X says watch out—trouble’s lurking!
(6/9) – SWOT: STRENGTHS
• Revenue: 31% YoY—$2.81B Q4 fury 🌟
• FCF: 22% Q4 margin, 18% ‘24 🔍
• Global: 33% GMV growth, EMEA +37% 🚦
NYSE:SHOP ’s an e-commerce titan—X can’t look away!
(7/9) – SWOT: WEAKNESSES & OPPORTUNITIES
• Weaknesses: High P/E 81, merchant reliance 💸
• Opportunities: Enterprise boom, AI tools, price hikes 🌍
Can NYSE:SHOP turn hype into gold? X wants to know!
(8/9) – NYSE:SHOP ’s Q4 is fire—where’s it headed?
1️⃣ Bullish—$151.5B king keeps slaying
2️⃣ Neutral—Growth’s hot, but risks bite
3️⃣ Bearish—Valuation’s a trap, crash incoming
Vote now—let’s brawl it out! 🗳️👇
(9/9) – FINAL BLAST
NYSE:SHOP ’s Q4 is a $2.81B thunderclap—GMV soaring, cash flowing 🌍. But competition and costs lurk. Undervalued rocket or overhyped bubble?

$BP’S COMEBACK? ELLIOTT’S STAKE & UNDERVALUATION BUZZBP’S COMEBACK? ELLIOTT’S STAKE & UNDERVALUATION BUZZ
1/7
BP ( NYSE:BP ) just got a jolt of activist energy ⚡️ as Elliott Management took a significant stake. Shares surged 7% to 464.75 pence—the highest since August. Are we witnessing the start of a big turnaround? Let’s break down the numbers.
2/7 – REVENUE RUNDOWN
• 12-month revenue (ending Sept 2024): $199.1B (↓13.72% YoY)
• Big contrast to 2022’s 51.58% revenue jump
• Post-pandemic swings? The energy rollercoaster keeps rolling. 🎢
3/7 – EARNINGS HIGHLIGHTS
• Q4 2023 net income: $371M vs. $10.8B the previous year 🤯
• Lower refining margins + weaker oil & gas production = big dent
• Still holding a “GOOD” Financial Health score—some resilience under the hood.
4/7 – ELLIOTT’S INVOLVEMENT
• BP’s 2023 performance: -16%—underperforming Shell (-4%) & ExxonMobil (+8%)
• Elliott sees untapped value? Activists typically target companies trading below intrinsic worth
• Market loves it: 7% daily pop signals new optimism. 🚀
5/7 – VALUATION SNAPSHOT
• TTM P/E ratio at 7.89—notably below Shell & Exxon’s multiples
• Some analysts call BP “undervalued” and point to further upside potential
• If Elliott drives restructuring or divestitures, could we see a sustained rally?
6/7 Is BP primed for a major comeback with Elliott on board?
1️⃣ Yes—Activists will unlock hidden value!
2️⃣ No—BP’s challenges run too deep.
3️⃣ Maybe—Need more clarity on strategy.
Vote below! 🗳️👇
7/7 – RISK FACTORS
• Commodity Volatility: Oil & gas prices can swing hard
• Regulatory & ESG Pressure: Green-energy pivot demands big $$
• Debt Levels: ~$20.9B net debt could limit agility
• Competition: Shell, Chevron, & Exxon aren’t standing still. ⛽️

$GAIL REVIVES US LNG PLANS POST-TRUMP BAN LIFTNSE:GAIL REVIVES US LNG PLANS POST-TRUMP BAN LIFT
1/7
Good morning, energy traders! ☀️⚡️
Major shake-up in the LNG world: India’s GAIL is back on the hunt for a US LNG stake or long-term deals. What’s fueling this move? Let’s break it down!
2/7 – THE BACKSTORY
• Trump administration lifts the ban on new LNG export permits.
• GAIL had plans on ice since 2023—now they’re back in action.
• Sandeep Kumar Gupta (GAIL’s chairman) says: “We’re reviving our plans to buy a stake or sign long-term LNG contracts.”
3/7 – WHY IT MATTERS
• LNG Prices: Expected to soften post-2026 as supply ramps up.
• Impact on India: Cheaper energy imports, eye on boosting gas to 15% of energy mix by 2030. ♻️
• US Benefit: Strengthens position as a global LNG exporter—hello, bullish signals for Cheniere Energy (LNG) and Venture Global!
4/7 – MARKET IMPACT
• Prices: More supply could translate to downward pressure on LNG prices.
• Investment Angle: US LNG producers & infrastructure might see capital inflows. Keep an eye on relevant tickers!
• Energy Security: India aims for a cleaner, more reliable energy mix—this is long-term strategy at play.
5/7 – STRATEGIC ANGLE
• Aligns with India’s push to expand natural gas usage from ~6% to 15% by 2030.
• US Gains: Jobs, economic boost, and stronger foothold in global energy markets.
• Trade Partnerships: Could deepen economic ties between US & India.
6/8 What’s your take on GAIL’s US LNG strategy?
1️⃣ Bullish on US LNG exports 🐂
2️⃣ Bearish on LNG prices post-2026 🐻
3️⃣ Waiting for more clarity ↔️
Vote below! 🗳️👇
7/7 – YOUR TRADING PLAYBOOK
• Short-Term: Watch for volatility in LNG stocks (like LNG, Venture Global). GAIL might see a spike on renewed interest.
• Long-Term: Growing LNG supply + India’s energy push = potential contrarian bet on energy stocks before the broader market catches up.

EXXONMOBIL ($XOM) EARNINGS & OUTLOOKEXXONMOBIL ( NYSE:XOM ) EARNINGS & OUTLOOK
1/7
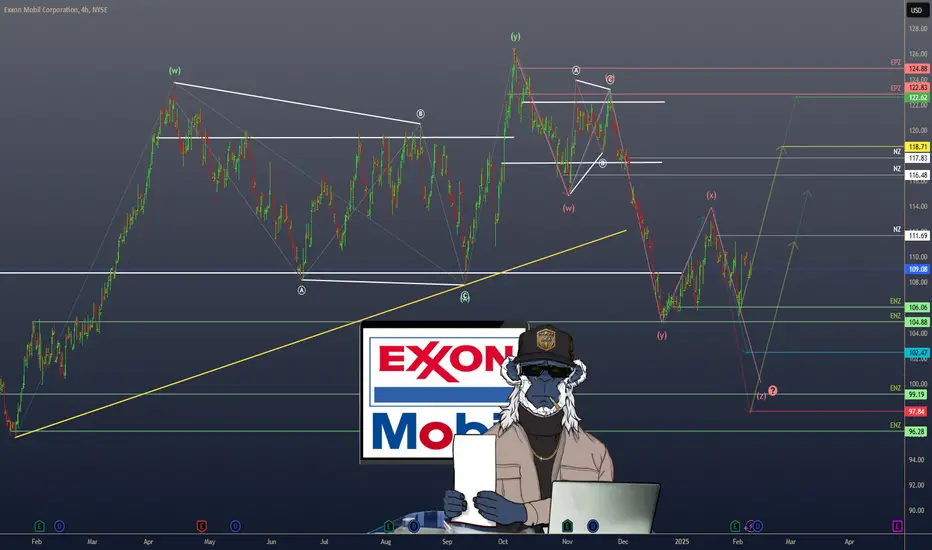
ExxonMobil is back in the spotlight after Q4 2024 earnings. ⚡️💰
From a $59.5B Pioneer merger to record Permian production, there’s plenty to unpack. Let’s dig in!
2/7 – Q4 & FULL-YEAR EARNINGS
• 2024 earnings: $33.7B, down from $36.0B in 2023
• Q4 2024: $7.6B net income (~$1.72/share), with $12.2B in operating cash flow
• Distributed $36B to shareholders in 2024—talk about rewarding loyalty! 💸💥
3/7 – EXPANSION & STRATEGY
• Targeting higher output in Permian Basin & Guyana, despite oil oversupply
• FWB:20B annual share-repurchase program planned for 2025
• Recent Pioneer merger boosts upstream portfolio—long-term production potential just got a big upgrade 🚀
4/7 – VALUATION VS PEERS
• P/E ratio ~13–14, below the industry range (15–18) ✅
• Dividend yield ~3.5%, beating the 3.0% sector average
• Stacks up against Chevron ( NYSE:CVX ) & Shell ( NYSE:SHEL )—but ExxonMobil’s Guyana assets could be the real differentiator 🌍⛽️
5/7 – RISK FACTORS
1️⃣ Oil oversupply + OPEC+ cuts → Price uncertainty 📉
2️⃣ Global economic slowdown → Softens demand
3️⃣ Regulatory scrutiny → Heightened costs
4️⃣ Shifting to renewables → Could reduce big-oil momentum
6/7 Is ExxonMobil truly undervalued given its strong cash flow & dividend?
1️⃣ Yes – Undervalued gem
2️⃣ No – Oil oversupply risk is too high
3️⃣ Maybe – Need more clarity on renewables
Vote below! 🗳️👇
7/7 – SWOT SUMMARY
• Strengths: Advantaged assets (Permian/Guyana), robust cash flow 🏭
• Weaknesses: Reliance on oil price, smaller renewables exposure
• Opportunities: Pioneer merger, carbon capture, high-value chemical products
• Threats: Regulatory, oversupply, economic slowdown
NFP Incoming - Will SPX Smash 6100?NFP Incoming – Will SPX Smash 6100? | SPX Market Analysis 7 Feb 2025
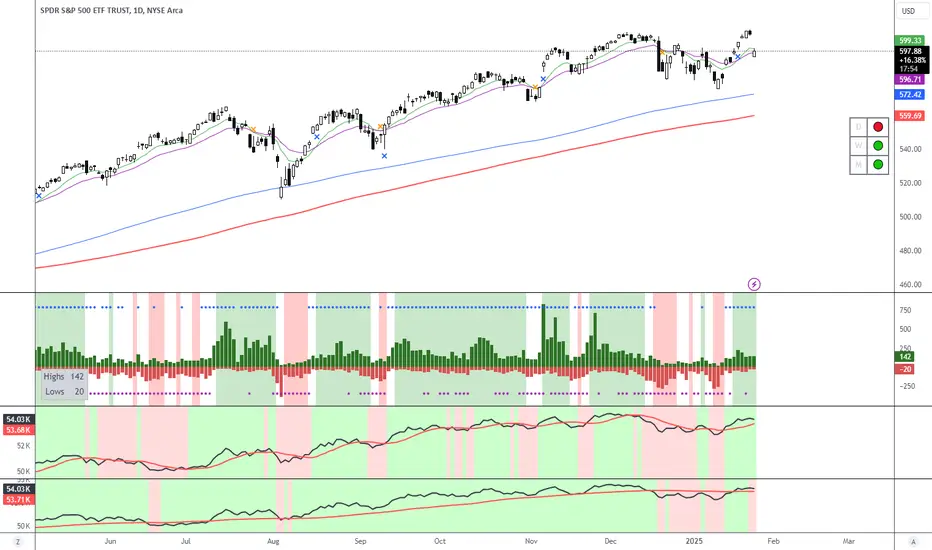
The bulls keep charging as SPX edges closer to 6100. But with the NFP report dropping pre-market, things could get lively.
Will we blast through resistance or bounce back down? Expect some whipsaw chaos before the market settles – but with a bullish trend already in play, we should at least get one more push toward target exits before the dust settles.
---
SPX Deeper Dive Analysis:
📈 Bullish Move On Track
SPX has ridden the momentum train all the way from the range lows to the range highs. Now, we’re staring at 6100, the key level where decisions will be made.
🚀 NFP Report – A Market Mover
Today’s Non-Farm Payroll (NFP) data drops just before the opening bell. This is one of the bigger monthly catalysts, meaning we could see:
A breakout past 6100 if the market likes the numbers.
A sharp rejection back into the range if traders get spooked.
A whipsaw shakeout, with wild swings before settling.
🔄 Short-Term Expectation? A Push Higher
Even if volatility kicks in, the existing bullish momentum should at least give us a final nudge up toward target exits. Whether we smash through 6100 or stall out, we’re in prime position to lock in profits.
⏳ The Good Kind of Waiting
Once again, we’re in a holding pattern, waiting for the market to tip its hand. But this is strategic patience – the kind where we’ve done the hard work and now simply let the market do its thing. The setups are in place – now, we sit back and watch the magic unfold.
---
Fun Fact:
📢 Did you know? In 2010, a trader accidentally caused a $1 trillion stock market crash in just 36 minutes – all because of a fat-finger trade.
💡 The Lesson? One typo, one misclick, or one overleveraged position can cause chaos. Always double-check your trades, because even the pros have hit the wrong button before.

$FESX1! EURO STOXX 50: 7 WEEKS OF GAINSEUREX:FESX1! EURO STOXX 50: 7 WEEKS OF GAINS
1/7
The EURO STOXX 50 is on track for its seventh consecutive weekly gain! 📈⚡️
This winning streak continues despite global trade war jitters and shifting market sentiment.
2/7
Why the optimism? 🤔
Investors appear cautiously confident about U.S. trade policy developments, with Europe seen as a more stable option amidst American economic uncertainties.
3/7
Key influences to watch:
• U.S. Jobs Data: Friday’s payroll numbers may affect overall risk sentiment.
• Trade War: Trump’s tariff talk + a one-month reprieve for Mexico & Canada = a temporary sigh of relief?
4/7
Currency factors also play a role. 💱
The Yen’s strength due to expected BoJ rate hikes could affect export-related optimism if the Euro shifts in tandem.
5/7
Commodities?
Gold remains steady near record peaks, signaling some investors are still seeking safe havens—even as equities rally.
6/7 What’s driving the EURO STOXX 50’s resilience?
1️⃣ Diversified European economy
2️⃣ Stable/dovish monetary policy
3️⃣ Shift to Europe as a “safer” bet
4️⃣ Combination of factors
Vote below! 👇✅
7/7
Market watchers see Europe’s diverse economic base 🏭🛍️ shielding stocks from U.S. volatility. Plus, the possibility of more accommodative European monetary policy adds extra support.

Markets Meltdown - Trade War Fallout BeginsMarkets Meltdown - Trade War Fallout Begins? | SPX Market Analysis 3 Feb 2025
Ahoy there Trader! ⚓️
It’s Phil…
Markets are waking up in full meltdown mode, all thanks to weekend tariff mayhem and rising tensions throwing a wrench into global trade. SPX futures are deep in the red, but that’s not necessarily bad news if you’re positioned right!
With bear swings already paying out big and bull swings needing some management, the real question is—do we get follow-through selling, or is this just another knee-jerk overreaction?
Let's dig in!
SPX Deeper Dive Analysis:
🔥 Trade War Whiplash Hits Markets Hard
The overnight futures carnage was triggered by new tariff disruptions, retaliatory measures, and escalating trade war tensions—all set to take effect on Tuesday. The global market reaction was swift and brutal.
SPX Futures: Hit a low of -120 points before bouncing to -80 points (-1.3%).
Similar Pattern to Last Monday: Another huge gap down breaking out of last week’s range.
Bearish Follow-Through or Bullish Bounce? Watching for a continuation lower or a bounce.
💰 Trade Plan: Profits on Bear Swings, Managing the Bullish Side
Friday’s range reversal gave us an edge before the market even opened:
✅ Bear swings from Friday = Near-maximum gains at the open.
✅ Rolling the bull swing may be required—assessing once we see price action.
✅ Large gap downs = Risky entries—patience required before placing fresh trades.
⏳ Key Levels to Watch
📌 Gap Fill Potential: Do we snap back into the prior range or confirm a deeper decline?
📌 Early Flush or Fakeout Rally? Let the first 30-60 minutes set the tone before making big moves.
📌 Fast Forward Group Call Strategy: Real-time assessment of market direction at the open.
For now, the plan is patience and precision—we wait for confirmation before making the next move.
Fun Fact:
📉 The Worst Market Drop from Tariff Wars? In 1930, the Smoot-Hawley Tariff Act triggered a global trade collapse, slashing world exports by 66% and worsening the Great Depression.
Lesson Learned?
Tariffs are rarely good news for markets. Every major tariff war in history has caused volatility, market corrections, or outright crashes. Whether today’s chaos is temporary or the start of something bigger remains to be seen!
Happy trading,
Phil
Less Brain More Gain
…and may your trades be smoother than a cashmere codpiece

XRP/USD -Learnig from Mistakes and Refining Entries (30M TF)In trading, losses are just as important as wins when it comes to learning and improving.
Here's a breakdown of a recent setup I analyzed on XRP/USD that didn't play out as planned-and how I refined my approach to get it right.
What Went Wrong (Bottom Chart):
=I initially identified a break of Major Higher Low (HL) with a strong volume candle.
=I assumed this would lead to bearish momentum toward my target, but price failed to deliver.
=The issue? I overlooked key liquidity points and entered permaturely without a proper confirmation of intent.
What Worked (Top Chart):
=After reviewing the chart, I spotted the correct setup: a proper HL break, which swept Buy-Side Liquidity (BSL) / (IDM).
=Price tapped into a well-defined supply zone (order block) after taking liquidity, signaling a high-probability reversal.
=This approch aligned with the market structure and led to TP being smashed.
Key Takeaways:
1. Watch for liquidity sweeps and inducements before committing to a trade.
2. Confirm intent by combining structure breaks (CHoCH) with zones of interest like supply/demand zones.
3. Review losses thoroughly-they often hold the key to improving your entries and view.
Let me know your thoughts, or feel free to share your experiences below. Always learning, always evolving!

GOLD 1H CHART ROUTE MAP Hey Everyone,
What an incredible day on the charts—smashing all our targets exactly as anticipated!
We kicked off the week by hitting our bearish targets, pulling back into the retracement zone for support. From there, we identified the key weighted level rejection, which fueled a strong bullish push. This move broke past our Entry Level, successfully achieving TP1 and TP2. Now, with EMA5 locked above TP2 (2788), we are closely watching as it heads towards TP3 (2801). Whether it reaches swiftly or after a pullback to the Golden Line support remains to be seen.
With this in mind, we will continue to capitalize on dips, leveraging our updated and weighted levels to track price action and catch profitable bounces. Our strategy remains simple yet effective—buying dips at support and securing 30 - 50 pips per trade. As we've emphasized, each level structure consistently provides 25 - 35 pip bounces, offering excellent entry and exit opportunities. A quick back test of the levels shared in recent weeks will show just how accurately they align with short to mid-term trends and reversals.
Be sure to monitor multiple time frames—many targets have already been hit, while a few are still in progress. Patience is key!
Trade smart, stay disciplined, and trust the process!
The Quantum Trading Master

Nothing bad happendThe US markets fell sharply today. The S&P500 lost almost 2%. Many investors, especially on social media, are wondering whether the “Trump Rally” is now over. I think this is extremely unlikely. As is so often the case, markets tend to exaggerate, both upwards and downwards.
The price slide was triggered by news from China. Th AMEX:SPY ere, the start-up “DeepSeek” has announced that it has AI models that work just as well as their US counterparts at a much lower price and with less data.
This will certainly not have a lasting impact, but it should make us aware that the AI party will be over at some point.
AUSSIE H1 Sweetpot! Buyers market!
Assie AUDUSD Long!
Taking a long position on this Aussie sweetpot—does it have potential? Let’s find out while locking in profits along the way.
Heed your DD!

Market Update: UK 10Y Yields Back on Nov 4th, we highlighted a potential triangle pattern on UK 10Y yields. 📈 At the time, we noted that a weekly close above 4.75% would complete the pattern, offering a potential longer-term upside target of 6.6%.
Last week, we got a weekly close above 4.75%! While a monthly close would strengthen the case, for now, as long as yields stay above 4.50%, I'm leaning into this scenario.
Disclaimer:
The information posted on Trading View is for informative purposes and is not intended to constitute advice in any form, including but not limited to investment, accounting, tax, legal or regulatory advice. The information therefore has no regard to the specific investment objectives, financial situation or particular needs of any specific recipient. Opinions expressed are our current opinions as of the date appearing on Trading View only. All illustrations, forecasts or hypothetical data are for illustrative purposes only. The Society of Technical Analysts Ltd does not make representation that the information provided is appropriate for use in all jurisdictions or by all Investors or other potential Investors. Parties are therefore responsible for compliance with applicable local laws and regulations. The Society of Technical Analysts will not be held liable for any loss or damage resulting directly or indirectly from the use of any information on this site.

Will History Repeat as Major Currencies Dance Toward Parity?In a dramatic shift that has captured the attention of global financial markets, the euro-dollar relationship stands at a historic crossroads, with leading institutions forecasting potential parity by 2025. This seismic development, triggered by Donald Trump's November election victory and amplified by mounting geopolitical tensions, signals more than just a currency fluctuation—it represents a fundamental realignment of global financial power dynamics.
The confluence of diverging monetary policies between the U.S. and Europe and persistent economic challenges in Germany's industrial heartland has created a perfect storm in currency markets. European policymakers face the delicate task of maintaining supportive measures. At the same time, their American counterparts adopt a more cautious stance, setting the stage for what could become a defining moment in modern financial history.
This potential currency convergence carries implications far beyond trading desks. It challenges traditional assumptions about economic power structures and reevaluates global investment strategies. As geopolitical tensions escalate and economic indicators paint an increasingly complex picture, market participants must navigate a landscape where historical precedents offer limited guidance. The journey toward potential parity serves as a compelling reminder that in today's interconnected financial world, currency movements reflect not just economic fundamentals but the broader forces reshaping our global order.
Conclusion
The current landscape presents unprecedented challenges for the EUR/USD pair, driven by economic fundamentals and geopolitical tensions. One significant concern is the potential release of sensitive footage from Israel (by the Israeli National Security Agency (NSA) from Hamas body cameras, containing graphic atrocities from the October 7th incident.), which could threaten European stability. These developments go beyond simple market dynamics and have the potential to reshape the social and political fabric of Europe.
Market professionals emphasize the importance of adaptable strategies and the vigilant monitoring of key indicators. Investors must prepare for increased volatility while maintaining strong risk management frameworks. The pressure on the euro-dollar relationship is likely to persist, making strategic positioning and careful market analysis more crucial than ever in navigating these turbulent waters.

XAUUSD LOT SCALP SHORT"Seizing a golden opportunity to execute a small-lot scalp short.
This strategy requires precision and quick decision-making, ideal for those adept at reading market trends.
With minimal exposure and high potential, it's the perfect setup for traders seeking to capitalize on short-term movements. Stay alert, as timing and swift execution are critical to maximizing gains in this scenario."

GOLD IS STILL SIDEWAYThe price is still sideways and there are no clear signs of a break out. If the price breaks out to the 2610 area, we will look for a Buy point.

XAUUSD UPDATE 1HR CHARTXAUUSD is showing promising momentum as we aim for a long position, anticipating a steady climb back to the target we successfully achieved yesterday. Patience and strategy align for another potential win!
