What's Nifty Next?With rising tensions between countries, market sentiment is becoming increasingly cautious. This geopolitical uncertainty is likely to weigh heavily on investor confidence in the coming weeks.
Based on the current scenario, a realistic target for Nifty seems to be around 21,000 by July, especially if the negative sentiment continues and foreign institutional investors (FIIs) remain net sellers. Global cues, crude oil prices, and currency fluctuations could further impact the index's performance.
📌 However, if by any chance Nifty manages to close above 25,500, it would indicate an extremely strong bullish breakout, defying current market fundamentals. Given the present conditions, this seems highly unlikely, unless there is a sudden positive catalyst such as:
A major resolution in geopolitical issues
Strong corporate earnings
Aggressive policy support from the government or RBI
🧠 My Take:
For now, it’s wise to remain cautious and watch key support/resistance levels. Volatility may remain high, and short-term traders should manage their positions carefully.
💬 Let me know your thoughts in the comments below. Do you think 21k is coming soon, or can the bulls surprise us all?
Marketsentiment

Can Gold Fall from Here? Let’s Watch the $3435 Level Closely!
If today's daily candle closes below the $3435 level, the market could move down further. But if it closes above this level, there's a chance for more upside.
However, keep in mind — most of the upside liquidity has already been taken. Now, there's significant sell-side liquidity resting below.
This makes $3435 a key level to watch. So, keep an eye on where today’s daily candle closes.
Let’s watch the market together and see what it does!
📌 DYOR – This is not financial advice.

Gold has recently reclaimed liquidity from its previous two-day!Gold's Recent Market Behavior and Potential Outlook
Gold has recently reclaimed liquidity from its previous two-day lows, indicating a potential shift in market dynamics. Currently, the price is approaching a weekly bullish Fair Value Gap (FVG), suggesting a possible upward movement. Additionally, the 4-hour chart reveals that a minor bearish FVG has been broken, further supporting the notion of a bullish reversal.
Despite these bullish signals, gold is entering a larger bearish FVG zone. If the market provides confirmation of a sell signal from this level, a downward movement could be anticipated. Conversely, if the price breaks through this bearish FVG, it may continue its upward trajectory.
In summary, while short-term indicators favor a bullish outlook, the larger bearish FVG zone presents a critical juncture. Traders should monitor for confirmation signals to determine the next market direction.
DYOR! Not Financial Advice.

The Yen’s Comeback Starts Here—and it Seems the COT Knew First1. Introduction: A Market Everyone Gave Up On
For a while, the Japanese Yen looked like a lost cause. After topping out in early 2021, Yen futures (6J1!) began an unrelenting slide, shedding value week after week like an old coat in spring. Traders stopped asking, “Where’s support?” and started asking, “How low can it go?”
The macro backdrop didn’t help. The Bank of Japan clung to ultra-loose monetary policy, even as the Fed hiked aggressively. Speculators piled on shorts. The Yen was a one-way ticket down, and no one seemed interested in punching the brakes.
But beneath that apathy, a quieter shift was underway. While price kept bleeding, trader positioning began to hint at something different—something the chart didn’t show yet. And if you were watching the Commitments of Traders (COT) report closely enough, you might’ve seen it.
2. The COT Trend That No One Was Watching
The COT report isn’t glamorous. It’s slow, lagging by a few days, and rarely makes headlines. But for those who track what the big players are doing—those large enough to be required to report their positions—it’s a treasure trove of subtle clues.
One of those clues is Total Reportable Positions. This metric tells us how active large market participants really are—regardless of whether they’re long or short. When that number is dropping, it suggests the “big dogs” are losing interest. When it starts climbing again? Someone’s gearing up to play.
From 2021 through most of 2024, Total Reportable Positions in 6J were in a steady decline—mirroring the slow death of the Yen's bullish case. But in late 2024, something changed. Using a simple linear regression channel on this COT data, a clear breakout emerged. Positioning was picking up again—for the first time in nearly three years.
And it wasn’t just a bounce. It was a structural shift.
3. Did Price Listen?
Yes—and no. Price didn't immediately explode higher. But the structure began to change. The market stopped making new lows. Weekly closes began to cluster above support. And importantly, a Zig Zag analysis started marking a pattern of higher lows—the first signs of accumulation.
Here’s where the chart really gets interesting: the timing of the COT breakout coincided almost perfectly with a key UFO support at 0.0065425—a price level that also marked the bottom in COT Traders Total Reportable Longs. This adds a powerful layer of confirmation: institutional orders weren’t just showing up in the data—they were leaving footprints on the chart.
And above? There’s a UFO resistance level at 0.0075395. If the Yen continues to climb, that could be a significant price level where early longs may choose to lighten up.
4. The Contract Behind the Story
Before we go deeper, let’s talk about what you’re actually trading when you pull the trigger on Yen Futures.
The CME Japanese Yen futures (6J) contract represents 12.5 million Japanese Yen, and each tick move—just 0.0000005 per JPY—is worth $6.25. It’s precise, it’s liquid, and for traders who like to build macro positions or take advantage of carry flows, it’s a staple.
As of May 2025, margin requirements hover around ~$3,800 (Always double-check with your broker or clearing firm—these numbers shift from time to time.)
But maybe you’re not managing seven-figure accounts. Maybe you just want to test this setup with more flexibility. That’s where the Micro JPY/USD Futures (MJY) come in.
Contract size: 1/10th the size of 6J
Tick move: 0.000001 per JPY increment = $1.25
Same market structure, tighter margin requirement around ~$380 per contract
Important note: The COT report aggregates positioning across the whole futures market—it doesn’t separate out micro traders from full-size. So yes, the data still applies. And yes, it still matters.
5. Lessons from the Shift
This isn’t about hindsight bias. The value in this setup isn’t that the Yen happened to bounce—it’s how Total Reportable Positions broke trend before price did.
Here are the real takeaways:
COT data may or may not be predictive—but it is insightful. When positioning starts expanding after a long contraction, it often signals renewed interest or risk-taking. That’s tradable information.
Technical support and resistance as well as highs and lows give context. Without them, COT breakouts can feel theoretical. With them, you have real, observable UFO levels where institutions may act—and where you can plan.
6. Watchlist Insights: Where This Might Work Again
You don’t have to wait for another yen setup to apply this framework. The same structure can help you scout for early positioning shifts across the CME product universe.
Here’s a simple filter to start building your own COT watchlist:
✅ Look for markets where:
Price has been in a long, clean downtrend (or uptrend)
Total Reportable Positions are falling—but starting to reverse
A breakout occurs in positioning trend (draw a regression channel and watch for a clean violation)
A key support or resistance lines up with recent extremes in COT positioning
Whether it's crude oil, corn, or euro FX, this template gives you a framework for exploration.
🎯 Want to See More Setups Like This?
We’re just getting started. If this breakdown opened your eyes to new ways of using COT reports, UFO levels, and multi-dimensional trade setups, keep watching this space.
When charting futures, the data provided could be delayed. Traders working with the ticker symbols discussed in this idea may prefer to use CME Group real-time data plan on TradingView: www.tradingview.com - This consideration is particularly important for shorter-term traders, whereas it may be less critical for those focused on longer-term trading strategies.
General Disclaimer:
The trade ideas presented herein are solely for illustrative purposes forming a part of a case study intended to demonstrate key principles in risk management within the context of the specific market scenarios discussed. These ideas are not to be interpreted as investment recommendations or financial advice. They do not endorse or promote any specific trading strategies, financial products, or services. The information provided is based on data believed to be reliable; however, its accuracy or completeness cannot be guaranteed. Trading in financial markets involves risks, including the potential loss of principal. Each individual should conduct their own research and consult with professional financial advisors before making any investment decisions. The author or publisher of this content bears no responsibility for any actions taken based on the information provided or for any resultant financial or other losses.

Global Markets Anticipate the End of the Trade WarFinancial markets around the world are closely monitoring developments related to the prolonged trade conflict between the world’s largest economies. For several years, investors, analysts, and multinational corporations have operated in an environment clouded by uncertainty, driven by tariffs, sanctions, and disruptions to global supply chains. However, there are now growing signs that tensions may be easing, with a possible resolution to the conflict on the horizon.
Reasons for Cautious Optimism
Recent rounds of negotiations between key global powers — particularly the United States and China — have shown a modest yet positive trajectory. Despite ongoing disagreements on strategic issues, both sides have begun to signal a willingness to compromise. Meanwhile, mounting international pressure from allied nations, who are eager to see a return to trade stability, is contributing to the momentum.
Economic necessity is also playing a significant role. In the wake of the pandemic-induced downturn and global inflationary trends, many countries are seeking to revitalize exports and restore normal trade flows. This makes reaching an agreement not only politically advantageous but economically essential.
Market Reactions
Global financial markets, highly sensitive to geopolitical developments, are beginning to show signs of stabilization. Stock indices across Asia, Europe, and North America are experiencing moderately positive trends, especially as rumors circulate about potential tariff reductions or interim agreements. Companies that depend heavily on international supply chains — particularly in the technology, automotive, and industrial equipment sectors — have seen their share prices rise.
That said, experts caution that these positive expectations are still fragile. Any setback in negotiations or unexpected political developments could reignite tensions and send markets back into volatility.
What Lies Ahead?
The conclusion of the trade war will be a gradual and complex process, requiring political will, sustained diplomacy, and a careful balancing of strategic interests. Yet it is already clear that the global economy is in dire need of stability. Businesses are craving predictability, while consumers seek price stability and product availability.
If negotiations ultimately succeed, we could witness accelerated economic growth, renewed investor confidence, and a surge in global capital flows. However, if talks break down, markets may need to brace for a prolonged era of trade fragmentation and economic friction.

AON: Quiet Compounder Preparing Its Next Move!?ROE: 46.3% — top-tier profitability backed by real cash flow.
Net Margin: 16.9% — significantly above industry average.
Free Cash Flow: $2.8B+ annually — strong ability to cover dividends, buybacks, and debt obligations.
Dividend Growth: 11 consecutive years — low payout ratio (~25%), very sustainable.
--------------
🏢 Company Snapshot:
Market Cap: ~$72.5 billion
Employees: ~50,000
Founded: 1982
Headquarters: London, United Kingdom
🌎 What Aon Does:
Aon plc is a global leader in risk management, insurance brokerage, and human capital solutions, helping organizations safeguard their assets, people, and long-term value in an increasingly complex world.
🛡️ Risk-Focused Excellence:
Through cutting-edge data analytics, consulting services, and integrated solutions, Aon supports businesses across commercial risk, reinsurance, health, and retirement sectors.
📚 Fun Facts:
The name "Aon" comes from the Gaelic word for "oneness", reflecting its mission to deliver unified solutions to clients.
Aon was a key broker for insuring the World Trade Center and played a critical role in redefining corporate risk coverage post-9/11.
The company was portrayed in the movie The Big Short as one of the key firms advising institutions during the financial crisis.
🔹 Key Strengths:
ROE: 46.3% — top-tier profitability backed by real cash flow.
Net Margin: 16.9% — significantly above industry average.
Free Cash Flow: $2.8B+ annually — strong ability to cover dividends, buybacks, and debt obligations.
Dividend Growth: 11 consecutive years — low payout ratio (~25%), very sustainable.
🔹 Concerns:
Debt-to-Equity: 2.58 — leverage higher than peer average; manageable but worth monitoring.
Valuation: P/E 26.5× — trading at a premium compared to Marsh & McLennan (MMC) and Willis Towers Watson (WTW).
📈 Current Technical Setup: Break&Retest
For nearly three years, the $320–$350 zone acted like a stone wall for AON, a major resistance barrier where every breakout attempt failed.
The price consistently struggled to break through... until late 2024, when a decisive breakout finally occurred, fueled by strong earnings momentum and resilient cash flow generation.
Now, AON has pulled back to retest this critical area — a former resistance that may transform into supercharged support.
This is a textbook example of Break & Retest behavior: price breaking a multi-year resistance, then returning to find liquidity and new buyers at the same key zone.
Fundamentally, AON continues to deliver high ROE (46%), strong margins (17%), and solid free cash flow, making it an attractive name for investors looking for stability and compound growth — exactly the kind of stock that buyers often defend during technical retests.
📋 Final Thoughts:
Aon is a quiet powerhouse in risk and advisory services, compounding cash flows year after year.
If you're looking for steady long-term growth, resilient profitability, and shareholder-aligned management, AON deserves a spot on your watchlist.
Patience matters though — at current prices, buying on weakness could offer better long-term returns.
Always do your own analysis and make sure it matches your risk profile.
If your view aligns with mine — you're basically ready to go. 😉
Cheers,
Vaido

btc"🌟 Welcome to Golden Candle! 🌟
We're a team of 📈 passionate traders 📉 who love sharing our 🔍 technical analysis insights 🔎 with the TradingView community. 🌎
Our goal is to provide 💡 valuable perspectives 💡 on market trends and patterns, but 🚫 please note that our analyses are not intended as buy or sell recommendations. 🚫
Instead, they reflect our own 💭 personal attitudes and thoughts. 💭
Follow along and 📚 learn 📚 from our analyses! 📊💡"

BITCOIN ($BTC) DIPS TO $82K—FEAR OR FORTUNE?BITCOIN ( CRYPTOCAP:BTC ) DIPS TO GETTEX:82K —FEAR OR FORTUNE?
(1/9)
Good Morning, TradingView! Bitcoin ( CRYPTOCAP:BTC ) slumped to $ 82,000, lowest since Nov ‘24 💰 Market’s glum, let’s unpack this crypto dip! 🌐
(2/9) – PRICE SLIDE
• Drop: $ 82K, 20% off $ 109K high 📊
• Month: Altcoins down 30%+ 💧
• Fear Index: 10/100, rock bottom 😟
CRYPTOCAP:BTC ’s shivering, gloom’s thick!
(3/9) – TECH TELL
• 200-Day MA: $ 81,500, support holds 🌟
• RSI: 28, oversold, bounce hint 🚀
• Past: Aug ‘24 $ 49K to $ 100K 📈
CRYPTOCAP:BTC ’s teetering, rebound or rubble?
(4/9) – MARKET MOOD
• Fear: Lowest since FTX ‘22, $ 16K 🌍
• History: Extreme fear sparks rallies 🌞
• Outflows: $ 1B from ETFs, trade woes 💼
CRYPTOCAP:BTC ’s testing, panic or patience?
(5/9) – RISKS IN PLAY
• Trump: Tariff talk, no crypto juice ⚠️
• Volatility: Bear turn stings 🐻
• Stablecoins: Inflows, sideline cash 🔒
CRYPTOCAP:BTC ’s wobbly, can it dodge the funk?
(6/9) – SWOT: STRENGTHS
• Base: $ 82K holds, tough nut 💪
• Past: Fear flips to gold, $ 100K+ 🏋️
• Liquidity: Central banks ease 🌿
CRYPTOCAP:BTC ’s gritty, battle-tested!
(7/9) – SWOT: WEAKNESSES & OPPORTUNITIES
• Weaknesses: Sentiment sinks 😕
• Opportunities: Fear buys, rate cuts 🌏
Can CRYPTOCAP:BTC vault past the blues?
(8/9) – CRYPTOCAP:BTC ’s $ 82K dip, what’s your take?
1️⃣ Bullish, $ 100K rebound soon 😎
2️⃣ Neutral, Holds, risks linger 🤷
3️⃣ Bearish, $ 70K slide looms 😞
Vote below! 🗳️👇
(9/9) – FINAL TAKEAWAY
CRYPTOCAP:BTC ’s $ 82K slump spooks, fear at 10 🪙 $ 1B ETF outflows sting, but history hints bounce, gem or gloom?

EUR USD Trade Setup 1 hour timeframe EUR USD has formed a head and shoulders pattern on the 1 hour timeframe.
This SELL pattern was formed at the daily resistance level.
What are your thoughts on EU ?

USDT.D is getting strength what next..?USDT dominance CRYPTOCAP:USDT.D is showing signs of breaking above the resistance zone after successfully retesting the 100 EMA. If this breakout sustains, it signals a shift toward stablecoins, indicating lower risk appetite among traders.
This is generally a bearish sign for altcoins, as rising USDT.D suggests capital is flowing out of riskier assets. If confirmed, we could see increased selling pressure across the altcoin market.

BTC, how to use the Crypto Fear and Greed IndexHello everyone,
ever wondered how to use the crypto fear and greed index properly?
It’s calculated using factors like volatility, volume, social media sentiment, and surveys, producing a score from 0 (Extreme Fear) to 100 (Extreme Greed).
Today the index showing 43 points, which is close to the fear zone again.
Do you think it's time to buy now?

Interpreting Long/Short Ratios in Futures Trading█ Interpreting Long/Short Ratios in Futures Trading: Beyond Bullish and Bearish
For beginner traders, the long/short ratio in futures markets can seem like a clear-cut indicator of market sentiment. Many assume that a high ratio of longs to shorts means the market is bullish, while more shorts than longs signals a bearish outlook. But in reality, this interpretation is oversimplified and can lead to misguided trading decisions.
In this article, we'll break down the nuances of the long/short ratio in futures trading, explaining why positions on the “short side” don’t always indicate a bearish stance and how traders can better interpret these ratios for a well-rounded perspective.
█ Understanding the Basics: Futures Trading Is Not Spot Trading
In the futures market, every trade requires a buyer (long position) and a seller (short position). For each person going long, there’s a counterpart going short. This zero-sum structure means that, by definition, there’s always a balance between longs and shorts. However, the reasons why traders take long or short positions vary widely—and not all of them are directional bets on price movement.
█ Why Not All Shorts Are Bearish (And Not All Longs Are Bullish)
Let’s dig into why a trader might take the short side without actually betting on a price drop:
⚪ Hedging: Some traders go short to hedge an existing position. For instance, if they already hold a large amount of Bitcoin in the spot market, they might take a short position in Bitcoin futures to protect against potential downside risk. This doesn’t mean they’re bearish on Bitcoin; they’re just managing risk.
⚪ Arbitrage: Some traders take short positions for arbitrage purposes. For example, they might go long in one market and short in another to profit from small price differences without having any directional view on Bitcoin’s future price. Their short position is purely for balancing and not a bet on falling prices.
⚪ Market Making: Market makers provide liquidity to the market by taking both long and short positions. Their goal isn’t to profit from price movements but to capture the spread between the bid and ask prices. They don’t have a directional view—they’re simply facilitating trades.
⚪ Closing Long Positions: When traders close long positions, they effectively create a new short transaction. For instance, if a trader decides to exit a long position by selling, they’re adding to the short side of the market. But this action doesn’t necessarily mean they expect prices to drop—it could just mean they’re taking profits or reallocating their portfolio.
█ Interpreting CoinGlass Long/Short Ratio Charts: Volume vs. Accounts
Let’s look at the long/short ratio charts on CoinGlass as an example. CoinGlass provides two main types of ratios:
⚪ Volume-Based Ratio: This chart shows the volume of capital in long vs. short positions. For example, a high volume in longs might suggest that large players are buying into Bitcoin. However, it’s important to remember that some of these long positions could be from market makers, hedgers, or arbitrageurs, who may not expect Bitcoin to rise. The volume itself doesn’t tell us why they’re in these positions.
⚪ Account-Based Ratio: This chart tracks the number of accounts on each side (long vs. short) on exchanges like Binance. A higher number of accounts on the short side doesn’t mean all those traders are bearish. Many could be taking short positions to balance other trades or hedge risks. They’re not necessarily expecting Bitcoin to decline; they’re just managing their positions.
█ Example Analysis: Misinterpreting Long/Short Ratios
Imagine you’re looking at a CoinGlass chart that shows an increase in long volume around November 5th. A beginner might see this and think, “Everyone’s bullish on Bitcoin!” But as we discussed, some of this long volume could be non-directional. It could include positions taken by market makers providing liquidity or hedgers who are long on Bitcoin futures but have a corresponding short in another market.
Similarly, if you see a spike in the number of short accounts, don’t automatically assume that everyone expects Bitcoin to fall. Some of those accounts might just be managing risk or taking advantage of arbitrage opportunities.
█ Avoiding the Pitfall of Overinterpreting the Long/Short Ratio
The biggest mistake traders make is interpreting the long/short ratio as a direct indicator of market sentiment. Remember, every trade has a counterparty. If there’s a high volume of longs, it simply means there’s an equal volume of shorts on the other side. The market’s overall sentiment isn’t always reflected in this ratio.
Instead of relying solely on the long/short ratio, consider these other factors to form a clearer market view:
Market Sentiment Indicators: Use sentiment tools, news, and social media sentiment to understand how traders are feeling beyond just positions.
Volume Trends: Look at overall market volume to see if there’s conviction behind the moves.
Context and Price Action: Interpret the ratio in the context of price action and recent events. If there’s a strong bullish trend, a higher long ratio might reflect confidence in the trend rather than simply volume.
█ Conclusion: A Balanced Perspective for Smarter Trading
Understanding the long/short ratio requires a more nuanced perspective. Just because the “longs” are up doesn’t mean everyone’s bullish—and just because the “shorts” are up doesn’t mean everyone’s bearish. The futures market is filled with diverse participants, each with unique motives, from hedging and arbitrage to liquidity provision.
By looking at these ratios with a balanced view, traders can avoid common pitfalls and interpret the data more accurately. Trading is about context and strategy, not just numbers on a chart. So, next time you’re checking the long/short ratio, remember: there’s more to it than meets the eye.
█ Final Takeaway: Focus on Context, Not Just Ratios
The long/short ratio can be a helpful tool, but it’s only one piece of the puzzle. Use it in combination with other market indicators, and always consider the motives behind trades. By doing so, you’ll make better-informed trading decisions and avoid falling into the trap of oversimplifying complex market data.
-----------------
Disclaimer
This is an educational study for entertainment purposes only.
The information in my Scripts/Indicators/Ideas/Algos/Systems does not constitute financial advice or a solicitation to buy or sell securities. I will not accept liability for any loss or damage, including without limitation any loss of profit, which may arise directly or indirectly from the use of or reliance on such information.
All investments involve risk, and the past performance of a security, industry, sector, market, financial product, trading strategy, backtest, or individual's trading does not guarantee future results or returns. Investors are fully responsible for any investment decisions they make. Such decisions should be based solely on evaluating their financial circumstances, investment objectives, risk tolerance, and liquidity needs.
My Scripts/Indicators/Ideas/Algos/Systems are only for educational purposes!

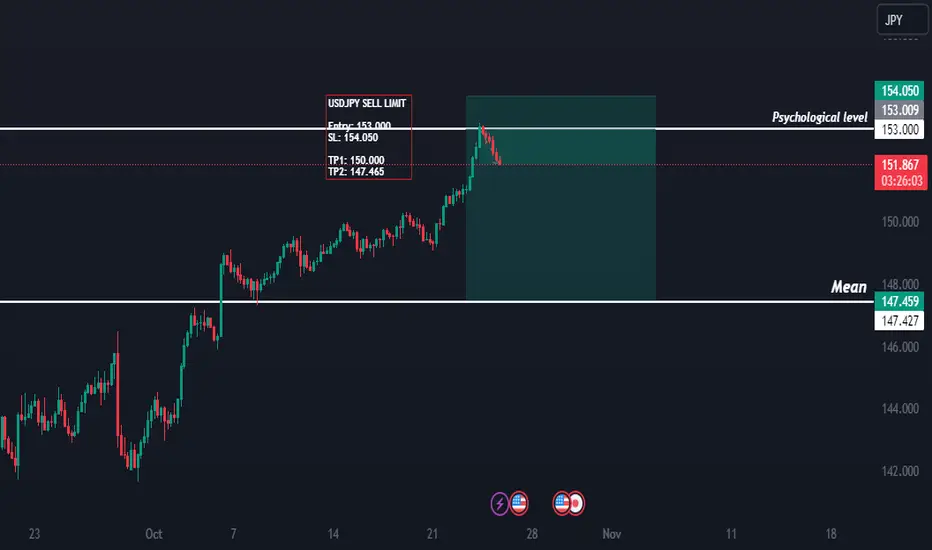
USDJPY Analysis for 24/10/2024: A Slightly Bearish Bias AheadAs we analyze the USDJPY currency pair on October 24, 2024, current market conditions and fundamental factors suggest a slightly bearish bias. This article delves into the key drivers influencing this outlook, allowing traders to make informed decisions in this dynamic market environment.
Current Market Conditions
The USDJPY pair has shown a mixed performance recently, with fluctuations influenced by both U.S. economic data and developments in Japan. Traders are closely watching for signals that could dictate the pair’s movement, particularly as we approach critical economic indicators.
Key Fundamental Drivers
1. U.S. Economic Data: Recent economic data from the U.S. has been a mixed bag. While there have been positive signs in job growth and consumer spending, inflation remains a concern. The Federal Reserve’s stance on interest rates continues to be cautious, signaling that any aggressive rate hikes may not be imminent. This dovish sentiment can weigh on the U.S. dollar, creating a bearish outlook for USDJPY.
2. Japanese Economic Performance: Japan's economy is showing signs of resilience, with recent data indicating stronger-than-expected growth. The Bank of Japan (BoJ) has maintained its accommodative monetary policy, but there are discussions about potential adjustments in response to rising inflation. Should the BoJ signal a shift towards tightening, this could support the Japanese yen and contribute to a bearish trend in USDJPY.
3. Geopolitical Factors: Ongoing geopolitical tensions and global economic uncertainty can lead to safe-haven buying of the yen. Any escalation in conflicts or adverse developments in trade relations may strengthen the yen further, enhancing its appeal against the U.S. dollar.
4. Market Sentiment and Technical Indicators: Sentiment in the forex market is essential. Currently, there is cautious optimism among traders regarding the yen due to the previously mentioned economic performance indicators. Additionally, technical analysis reveals that USDJPY is nearing resistance levels, suggesting a potential reversal. If the pair fails to breach these levels, it may retreat, reinforcing a bearish bias.
Conclusion
Considering the current fundamental factors and market conditions, the outlook for USDJPY remains slightly bearish for today. Traders should monitor upcoming U.S. economic data releases and any announcements from the Bank of Japan that could further impact this currency pair.
Keywords:
USDJPY analysis, bearish bias, forex market, U.S. economic data, Bank of Japan, Japanese yen, geopolitical tensions, market sentiment, technical analysis.
NVIDIA - A leading Indicator for the AI trend and market NVIDIA - NASDAQ:NVDA
🟣The upper purple parallel line is acting as resistance to price at present. A rejection from this long term purple line may be an early warning signal of a significant correction. A break above it would suggest continued positive momentum.
⏳In combination with the above considerations, a breach down and out of short term parallel channel would be a secondary warning signal of a trend change to the negative.
⏳Falling below the 50 week SMA (red) would be a third confirmation of a negative trend shift.
Obviously these levels could all act as support but if they are lost one after the other (price falling below them). It could be an early warning sign of this AI trend slowing.
✅Otherwise, a repeated 142-152 week bull trend out to June 2025 or April 2026 probable for now.
Why Watch Nvidia closer than the rest?
▫️ Apple, Microsoft and NVIDIA are the top three largest companies in the world by market cap. Collectively they are almost $10 trillion worth of market capitalization. That is almost 22% of the total market cap of the S&P500 Index, so all 3 are worth watching for warning signs or positive momentum.
▫️ Nvidia could lead the market as it is providing the shovels (graphics cards) for the AI data digging/sorting and general compute/data storage. If their performance starts to wane its a signal of less digging/sorting and a slowing of purchases from NASDAQ:AAPL , NASDAQ:MSFT (indicating slowing growth in both). Keeping a close eye on this chart could provide the early warning signals of a trend change, both on the AI front and the entirety of the market cycle.
There is no guarantee of the time sequence continuing on this chart however, these cycles tend to rhyme over time. I hope Nvidia breaks above the purple line at the top of the current long term channel. At present it is stiff resistance, and if price is rejected from here lower, this could be an early warning sign of the a market correction.
Remember, you can check in on this chart and press play to get updated data at any time by clicking the link in the comments below or by following me on TradingView.
PUKA

S&P/TSX Composite Index Continues Record-Breaking MomentumCurrent Market Situation:
The S&P/TSX Composite Index closed slightly above 24,050 on Friday, marking a 0.7% weekly gain and continuing its record-breaking trend.
Driving Factors:
Weak GDP data for August pointed to economic stagnation, reinforcing expectations of a dovish stance from the Bank of Canada, which improved market sentiment.
Gains in energy and financial sectors helped buoy the index. Notable stocks like Imperial Oil and TD Bank rose over 0.6%.
Challenges:
Declines in major stocks, including CIBC, TC Energy, and First Quantum, each down over 1.3%, weighed on the broader market's performance.
Outlook:
Despite some sector-specific declines, the index maintained its upward trajectory, remaining poised for a positive close to the week.
#SPTSX #StockMarket #CanadaEconomy #EnergyStocks #FinancialSector #MarketSentiment

EURUSD Analysis: Anticipating a Slight Bearish Bias Towards 1.1!EURUSD Analysis: Anticipating a Slight Bearish Bias Towards 1.10000 (24/09/2024)
As we analyze the EURUSD pair this week, a slight bearish bias appears probable, with a target near the pivotal level of 1.10000. Key drivers for this outlook include the recent economic data releases, central bank policies, and market sentiment.
1. Economic Data:
Recent Eurozone economic indicators have shown mixed results, with weak manufacturing PMI figures suggesting slowing growth. Conversely, US economic data, particularly strong job numbers and retail sales, point to a robust economy, potentially strengthening the dollar.
2. Central Bank Divergence:
The European Central Bank (ECB) is likely to maintain a dovish stance amid economic uncertainties, while the Federal Reserve appears committed to a tighter monetary policy. This divergence could exert downward pressure on the euro.
3. Market Sentiment:
Increased risk aversion due to geopolitical tensions may lead investors to favor safe-haven currencies like the USD, further supporting the bearish outlook for EURUSD.
In conclusion, the combination of economic fundamentals, central bank policies, and market sentiment suggests that EURUSD may trend towards 1.10000 this week. Traders should stay alert for potential market shifts and adjust their strategies accordingly.
Keywords: EURUSD analysis, bearish bias, economic data, central bank policy, ECB, Fed, market sentiment, forex trading, trading strategies, 1.10000 target.

Unveiling Market Sentiment in Trading Unveiling Market Sentiment in Trading
Understanding the market's pulse can offer traders a significant edge. The market is driven by human psychology, and by grasping the prevailing mood, traders can position themselves more effectively.
This article will delve into various methods and indicators that offer insights into market sentiment analysis trading, from media scanning and expert opinions to economic and market-specific indicators.
What Is Market Sentiment?
Market sentiment refers to the prevailing mood or emotional tone that traders and investors exhibit toward a specific financial asset or the market as a whole. It serves as a qualitative measure that captures collective attitudes toward market conditions — optimistic, pessimistic, or neutral.
This sentiment is often influenced by various factors such as economic indicators, news, and trader psychology. Understanding market sentiment is crucial because it can help anticipate market trends, offering insights that purely quantitative indicators sometimes overlook.
Of course, traders can’t just rely on sentiment analysis; price charts and trading tools are also key. FXOpen’s native TickTrader platform offers just that and more. Head over there to get started in minutes.
Media Scanning
In forex, commodity, crypto*, and stock market sentiment analysis, media scanning is one of the most straightforward techniques. News reports from reputable financial news outlets like Bloomberg, Reuters, and the Financial Times often provide timely updates on market conditions, geopolitical events, and economic data releases. These reports offer a snapshot of the current market health.
Expert opinions offer another layer of depth to understanding market sentiment. Analyst statements from established financial firms (banks, hedge funds, venture capital firms, etc.), expert blogs, and whitepapers can deliver nuanced viewpoints.
For example, if multiple analysts from various firms are consistently bullish about a specific asset, it can indicate positive sentiment surrounding it. While these shouldn't be your sole resource, they often provide valuable insights that quantitative metrics may overlook. Remember to consider the source and its reliability, as not all opinions carry the same weight in influencing market sentiment.
Market Sentiment Indicators
Moving beyond the qualitative aspects of media, there are several quantitative indicators that can measure market sentiment directly. The Commitment of Traders Report (COT), particularly relevant in commodity markets, reveals large traders' positions. A skew toward long positions among these traders often indicates bullish sentiment for a commodity, while a skew toward short positions suggests a bearish sentiment.
The Fear & Greed Index is another essential tool, often associated with stock markets but also applicable to other asset classes like cryptocurrencies* and even some commodities. For stocks, CNN’s Fear & Greed Index is commonly cited, while Alternative.me’s version is often used for crypto*.
This market sentiment index uses multiple factors, including market momentum and safe-haven demand, to calculate a score ranging from zero to 100. Lower scores signify fear, suggesting a bearish outlook, whereas higher scores indicate greed, signalling a bullish market environment.
Consumer Surveys
Consumer surveys offer another valuable avenue for determining market sentiment, particularly in sectors like retail, real estate, and commodities. One widely used metric is the Consumer Confidence Index. This index is based on household survey data and measures their optimism or pessimism about current and future economic conditions. A high Consumer Confidence Index typically suggests that people are willing to spend, often driving up asset values in the retail and real estate sectors.
Manufacturing surveys also provide useful data, especially for forex and commodity markets. These surveys, such as the Purchasing Managers' Index (PMI), gauge the health of a country's manufacturing sector. Positive manufacturing data often strengthens a country's currency and can also be an indicator of rising commodity prices.
Social Media & Forums
In the age of digital communication, social media platforms and online forums have become indispensable tools for assessing market sentiment. Trending topics like Twitter can offer a quick pulse on what assets or market events garner attention. Specialised analytical tools can even quantify this chatter into actionable data, highlighting potential market moves.
Online forums are another rich source of sentiment indicators. Places like Reddit and niche trading forums often host passionate discussions where traders share opinions, strategies, and forecasts. While the quality of this information can vary, a consensus view often emerges that can be invaluable in gauging sentiment. For example, an uptick in positive posts about a specific cryptocurrency* on a forum could indicate bullish sentiment, whereas an increase in sceptical posts would suggest the opposite.
Economic Indicators
Economic indicators like interest rates and Gross Domestic Product (GDP) reports provide a macro-level view of market sentiment, affecting everything from currencies to commodities. Interest rates, set by central banks, can indicate the market's sentiment toward a country’s economic prospects. A rise in interest rates often boosts the country's currency as higher yields attract foreign investment. Conversely, a rate cut can indicate economic caution, potentially weakening the currency.
Quarterly GDP reports are another crucial metric, offering a comprehensive picture of a country's economic health. Strong GDP growth is generally seen as a positive indicator affecting multiple asset classes, from equities to currencies, that relate to that country. If a country reports better-than-expected GDP figures, it's often interpreted as bullish, leading to increased investor confidence and higher asset prices.
While these indicators aren’t direct measures of sentiment, they both influence market sentiment and reflect current sentiment. For instance, rising interest rates may send the Consumer Confidence Index lower, resulting in reduced spending and a lower GDP reading. Lower GDP might damage sentiment further, and so on.
Market Indicators
In sentiment analysis for the stock market, the Volatility Index, or the VIX, is particularly informative. Often referred to as the "fear gauge," the VIX measures the market's expectation of 30-day forward-looking volatility based on S&P 500 index options. When the VIX rises, it indicates that traders expect increased volatility, often corresponding to bearish market conditions. Conversely, a low VIX suggests a more stable, often bullish market sentiment.
Trading volume is another key metric that provides clues about market sentiment in a specific asset. High trading volumes often point to strong sentiment, be it bullish or bearish, as it represents active participation and conviction among traders. In contrast, low trading volumes might suggest indecision or lack of interest, signalling a market that could move sideways or reverse.
The Bottom Line
In the ever-changing world of trading, understanding market sentiment is invaluable. From economic indicators to social media trends, these tools provide a multi-dimensional view of market moods.
To put these insights into practice and gain a competitive edge in your trading endeavours, consider opening an FXOpen account. Once you do, you’ll gain access to hundreds of assets to deploy your sentiment analysis skills. Happy trading!
*At FXOpen UK and FXOpen AU, Cryptocurrency CFDs are only available for trading by those clients categorised as Professional clients under FCA Rules and Professional clients under ASIC Rules, respectively. They are not available for trading by Retail clients.
This article represents the opinion of the Companies operating under the FXOpen brand only. It is not to be construed as an offer, solicitation, or recommendation with respect to products and services provided by the Companies operating under the FXOpen brand, nor is it to be considered financial advice.

ANTICIPATING TRADING THROUGH MARKET SENTIMENTSNZDJPY pair selected after checking on market sentiments and found it above 90%.Checked following checklist to follow trading strategy:-
1. Bearish trend
2. Bullish Divergence
3. No Continuation pattern
4. Falling wedge bullish reversal pattern
5. Bullish AB=CD harmonics pattern
6. Anticipated that bullish trend is starting, and initiated two trades through buy stop

Market 101:From the Drama King VIX to the Steady Eddie UtilitiesVolatility Index (VIX) - The Drama King
Let’s kick things off with the Volatility Index, aka the market’s drama king. It’s like that one friend who always makes a big deal out of nothing—spiking dramatically whenever the market so much as sneezes. Recently, it shot up faster than a caffeine-fueled trader on Monday morning, but now it’s calming down a bit, hovering around 20.73. Keep an eye on this guy—he’s always a sign of market anxiety like I said, the the fear gauge. If he starts climbing again, it might be time to batten down the hatches.
Utilities Sector (XLU) - The Steady Eddie
Moving on to the Utilities sector, which is the market’s equivalent of your reliable, always-on-time friend. XLU has been climbing steadily, but just like every other reliable person, it needs a break sometimes. It’s currently chilling around 76.20, looking like it’s taking a well-deserved breather. Nothing too exciting here, but that’s exactly what you want from Utilities—slow and steady wins the race.
ARK Innovation ETF (ARKK) - The Wild Child
Now, let’s talk about ARKK—Cathie Wood’s wild child. This chart is like a rollercoaster at an amusement park: up, down, up, down, and sometimes you’re not sure if you should scream or cheer. After some wild moves, ARKK is sitting around 42.98, but don’t be surprised if it decides to take another loop-de-loop soon. Just remember to strap in and hold on tight.
Technology Sector (XLK) - The Overachiever
Next up, the Technology sector, which has been the market’s overachiever for quite some time. XLK had been climbing like it’s trying to win the market’s gold star, but recently it’s hit a bit of a speed bump, pulling back to 210.28. No worries though—this sector is like that student who’s always doing extra credit. It’ll likely bounce back in no time, probably while giving the rest of the market a lesson in resilience.
Consumer Discretionary Sector (XLY) - The Big Spender
Finally, we’ve got the Consumer Discretionary sector, which is the market’s big spender. XLY has been on a shopping spree, but it looks like it might be hitting the credit limit soon. The chart shows some clear support around 184.61, but if it breaks below this, we might see some belt-tightening ahead. Keep an eye on it—everyone loves a spender until the bill comes due.
Summary: From the dramatic spikes of the VIX to the steady climb of Utilities, each of these charts has its own personality. Whether you’re dealing with the rollercoaster that is ARKK or the disciplined overachiever in Technology, there’s always something to learn from the market’s diverse cast of characters. Stay sharp, keep your sense of humour and energy, and remember: in the markets, as in life, it’s all about balance.

Do we near to another crisis?Dear All
As you see this is the Will5000PR to GDP Ratio !!! I think it is clear that we are so close to another crisis in USA and afterward whole world Markets !!!
Maybe it is time to take care of your money !!!

Ethereum (ETH) Faces Critical Resistance After Market DownturnMarket Sentiment:
Last week started with a sharp downturn across various markets, including cryptocurrencies, leading to some of the most negative sentiment for Ethereum in years.
Key Challenge:
Ethereum CRYPTOCAP:ETH has broken below the crucial support zone of $2,600-$2,900, which has now turned into a major technical resistance. Closing below this level could allow the bears to maintain their technical edge.
Signs of Optimism:
Despite the negative sentiment, last Monday's candlestick showed a strong retracement from the October 2023 lows. Ethereum briefly dipped below the downside target of $2,300-$2,400 but quickly rebounded, suggesting this area might have been a temporary bottom.
Looking Ahead:
For Ethereum to regain bullish momentum, it needs to reclaim and close above the $2,600-$2,900 resistance zone. Until then, the bears still hold a slight advantage, but the recent market reaction offers hope for a potential recovery.
Key Levels:
Resistance: $2,600 - $2,900
Support: $2,300 - $2,400
#Ethereum #ETH #Crypto #MarketAnalysis #TechnicalAnalysis #Cryptocurrency #SupportAndResistance #Bearish #Bullish #Rebound #MarketSentiment

Hey SPY Lovers we got a Pullback Target !This is my analysis of SPY on the daily chart.
I have a leg measurement in the two strong corrections that the price has been making. In the second leg, it replicates the first one. I also have a very important point that coincides with the first leg and connects with the second one. So, no matter how low we might see the market fall, the levels 531 and 532 are a point of interest for me for a possible pullback.

3 Reasons for a Euro Shot3 out of 5 indicators are bullish, also the dollar index is showing signs of weakness which is good for the euro:
1 indicator - the latest COT report
2 indicator - retail trades
3 indicator - option flow sentiment
However, since we're seeing a narrow range, there's a chance that the euro might have a false breakout before it moves higher.
