EURGBP - Top-Down Analysis 📹 From Daily To H1Hello TradingView Family / Fellow Traders. This is Richard, also known as theSignalyst.
📈 Here is a detailed update top-down analysis for #EURGBP.
Which scenario do you think is more likely to happen? and Why?
📚 Always follow your trading plan regarding entry, risk management, and trade management.
Good Luck!.
All Strategies Are Good; If Managed Properly!
~Rich
Marketstructure

EURUSD ANALYSISas we see our previous Bos successfully react to our psychology... Now i am looking for a next one if both fail then i'll look for upcoimg change of character.....
note: this is not a signal

EurCad AnalysisAs we see... our HTF Order block Successfully reacted.... and now we are moving to our extreme order which gives higher possibility to enter the trade....

SOL 🎵 That break would be like music to my earsHello TradingView Family / Fellow Traders. This is Richard, also known as theSignalyst.
Weekly: Left Chart
📊 SOL has been trading within a wide range between 10.0 and 50.0.
Lately, after rejecting the 10.0 support, SOL has been bullish from a medium-term perspective. However, it is currently approaching the upper bound of the range – the 50.0 round number.
📈 For the bulls to take control from a long-term perspective and initiate the Markup phase, we need a weekly candle close above 50.0.
In this scenario, a movement towards the next resistance at 130.0 would be anticipated.
H4: Right Chart
From a medium-term perspective, SOL appears bullish while trading inside the green rising broadening wedge, and we anticipate a movement towards the 50.0 level.
📉 Unless the last low in green is broken downward , in which case a bearish correction would begin.
📚 Always follow your trading plan regarding entry, risk management, and trade management.
Good luck!
All Strategies Are Good; If Managed Properly!
~Rich

XRP - MarkUp Phase Started 📊Hello TradingView Family / Fellow Traders. This is Richard, also known as theSignalyst.
📊 After breaking above the 0.55 level mentioned in my previous idea, XRP exited the accumulation phase and entered the markup phase.
📈 For the bulls to maintain control , we need a break above the 0.7345 resistance highlighted in blue.
📉 Meanwhile, XRP could still face rejection at the resistance , which can be confirmed on lower timeframes. In this scenario, a correction towards the 0.55 support level would be anticipated.
📚 Always remember to follow your trading plan regarding entry, risk management, and trade management.
Good luck!
And always remember: All strategies are good if managed properly!
~Rich

EURCHF - Now OverBought ↘️Hello TradingView Family / Fellow Traders. This is Richard, also known as theSignalyst.
As per my last analysis, attached on the chart, we have been looking for buy setups around the lower bound of the red channel.
EURCHF traded higher and it is now approaching the upper bound of the channel again.
Moreover, the zone 0.97 is a strong resistance.
🏹 So the highlighted red circle is a strong area to look for sell setups as it is the intersection of the blue resistance and upper red trendline acting as a non-horizontal resistance.
As per my trading style:
As EURCHF is sitting around the upper red circle zone, I will be looking for bearish reversal setups (like a double top pattern, trendline break , and so on...)
Knowing that EURCHF can still test the 0.97 resistance before going down.
📚 Always follow your trading plan regarding entry, risk management, and trade management.
Good luck!
All Strategies Are Good; If Managed Properly!
~Rich

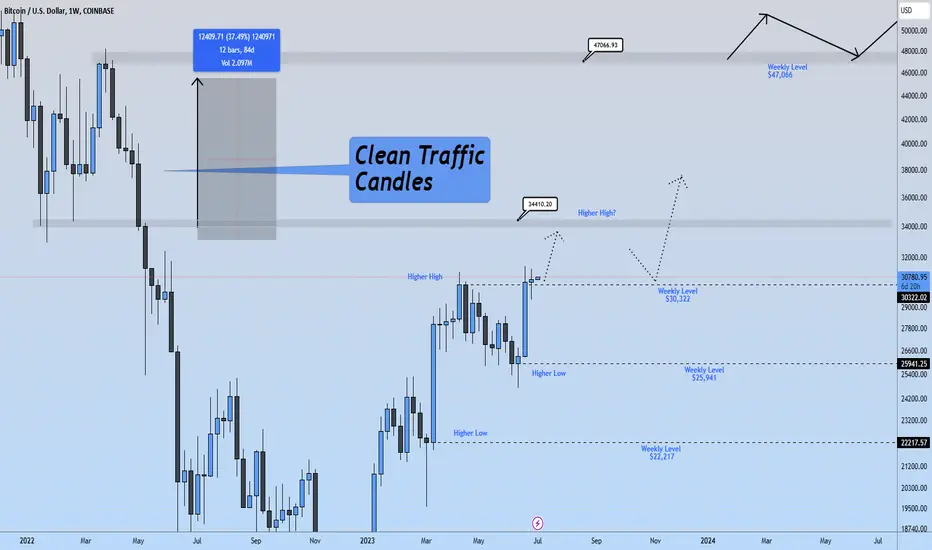
Weekly Candles Keep closing above $30,322 ☀️With clean candles to the left for BTC we don't have much holding us back at this point for a 37% increase back to 47K. I can visualize us mirroring the move back to the upside. Last summer we moved down and this summer we may move back up. The Monthly candle for June 23' jsut closed bullish engulfing the April/May Monhtly candles. Market Structure on the Weekly timeframe looks good as it's creating measured moves to the upside.
My Trading Strategy in 3 Steps 📊As per @TradingView 's previous post, in this article, I am going to share my trading strategy in three steps.
📌 Step 1:
First, start from the higher timeframes like Daily/Weekly to identify the current long-term trend. Is it bullish, bearish, or stuck inside a range?
If the price is sitting in the middle of nowhere, then it is a NO trade zone, as the price has a 50% chance to go either up or down. Thus, there's no edge!
Remember: No trade is also a trade.
📚Wait for the price to approach the lower bound or upper bound. Then proceed to Step 2.
📌Step 2:
Zoom in to lower timeframes like H1 and M30 to look for any reversal setups.
A basic approach would be to wait for a swing low to be broken downward around a resistance as a signal that the bears are taking over.
In parallel, wait for a swing high to be broken upward around a support for the bulls to take over.
This would be the confirmation to enter the trade.
Just like a sniper waiting for the perfect shot!
📌Step 3:
Target at least a 1/2 risk-to-reward ratio. This way, even with a 50% win rate, you can still be profitable.
Remember: We are risk managers, not traders. We can't control the market; the only thing we have control over is our risk.
📚Always follow your trading plan regarding entry, risk management, and trade management.
Hope you find the content of this post useful 🙏
All strategies are good; if managed properly!
~Richard Nasr

Perfect Head and Shoulders. AlmostA screaming rocket back to 4400 and 4500 eventually, CBOE:SPX played out the pre-set H&S pattern until ~4100.
Where is goes from here?
USA Elections are next year
Holiday Season has started.
Geo Political Tensions on the rise
Inflation not cool but job market and interest rates cooler
As those Buy Side, Sell Side and every middle firm predicted, we may have a flat close to the year unless the above are resolved.
I suspect they do not want a bad market reaction to all these external issues and so they decide to make it seem resilient and keep it flat or better. In all, ~4815 is top and it might extend to 5500 next June if everything starts to melt down

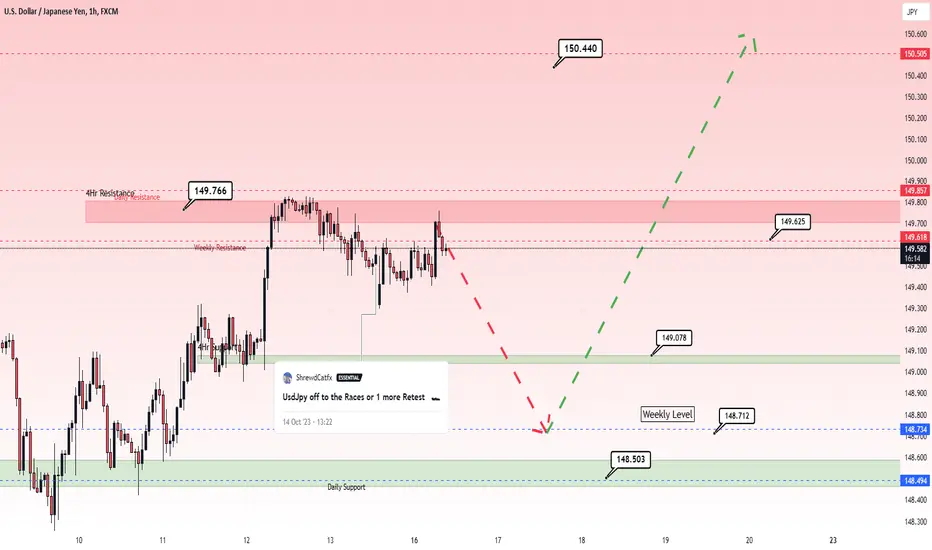
Too Early in week UsdJpy? 🚦UsdJpy , the Yen is testing the highs for liquidity preceding a decrease. It is early in the week and probabilities are not there for the kind of upside volume that we want to observe .
150.5 Bullish Weekly target
152 2nd Bullish Weekly Target
148.71 Bearish Weekly target
148.23 Bearish weekly target #2
AUDCAD - Wait Like a Sniper 🛡Hello TradingView Family / Fellow Traders. This is Richard, also known as theSignalyst.
AUDCAD has been overall bearish trading inside the falling wedge pattern in red, and it is currently approaching around the upper of the wedge / upper red trendline.
Moreover, the zone 0.885 - 0.89 is a strong resistance.
🏹 So the highlighted red circle is a strong area to look for sell setups as it is the intersection of the green resistance and upper red trendline acting as a non-horizontal resistance.
As per my trading style:
As AUDNZD approaches the red circle zone, I will be looking for bearish reversal setups (like a double top pattern, trendline break , and so on...)
📚 Always follow your trading plan regarding entry, risk management, and trade management.
Good luck!
All Strategies Are Good; If Managed Properly!
~Rich

#DXY more bullish outlookHello, everyone. I hope you're all having a great week.
Let's analyze the DXY chart and try to make some predictions for the upcoming week.
Last week, the price was rejected from the important low indicated on the chart and also established a new 4-hour high, as evident in the chart. Consequently, the market structure in the 4-hour time frame is now in alignment with the higher time frame, daily market structure, and they both exhibit a bullish trend.
Given this scenario, our primary interest lies in taking long positions in high-probability trading zones. These zones could be around the short-term low marked with an arrow or during a pullback to the broken short-term bearish trendline.
In the meantime, as we await the price to reach these levels, we will closely monitor the market. Once the price approaches these areas, we will be looking for confirmation signals before considering our trades.

MASTERING MARKET STRUCTURE : BOS, CHOCHBreak of Structure: This term is used in trading and technical analysis to describe a significant change in the price action of an asset. It occurs when the established pattern of higher highs and higher lows (in an uptrend) or lower highs and lower lows (in a downtrend) is disrupted, indicating a potential change in market sentiment and trend direction.
Examples of Break of Structure: You can find examples of "break of structure" in both bullish and bearish movements. In a bullish scenario, a "break of structure" occurs when a new Higher High (HH) is formed, surpassing the previous High (H). In a bearish context, it happens when the price forms a new Lower Low (LL) below the previous Low (L), indicating a potential shift in market sentiment and trend direction.
Shift in Structure : Sometimes, a "break of structure" leads to a more profound change in market character, referred to as a "Shift in Structure." This often involves a transition from a bullish to a bearish trend or vice versa.
Change of Character (CHOCH): The first instance of a significant shift in market sentiment and trend direction is termed "Change of Character" (CHOCH). This emphasizes the unique nature of the initial change.
Break of Structure (BOS): Subsequent occurrences of a similar shift in market sentiment are labeled as "Breaks of Structure" (BOS). These serve to differentiate the first significant change from those that follow.
These concepts are vital in trading and technical analysis as they help traders identify changes in market sentiment, adapt to evolving trends, and make informed trading decisions. Recognizing a "break of structure" and understanding when it leads to a "shift in structure" is essential for effective trading.

#DXY Possible scenarioHello, traders. Let's take a look at the DXY chart and discuss the possible movements of this chart for the next couple of days.
As we know, the price recently broke below an important bullish channel for the first time since July 4th when this major bullish run began.
However, as you can see, it failed to break below the previous low, which has been identified as an important support level. Based on Dow theory, the bullish trend is still intact since we have not violated the most recent lower low.
So, we currently have two conflicting signals. One is bearish due to the breakdown of the long-term bullish channel, while the other is bullish because the price hasn't breached the last low.
Furthermore, following the rejection of the low, the price moved higher impulsively, suggesting that buyers are still active. This is another bullish indication. However, the formation of a descending triangle chart pattern, which is bearish in nature, provides a mixed signal.
For trading and as a personal opinion, the current price area may not be the best entry point into the market. Additionally, any upside breakout of the triangle chart pattern could potentially be a false breakout and may not be an optimal trading opportunity. However, if the price retraces lower to test the previous low and fails to break below it, we might consider taking a long position on the US dollar.
If you've found this analysis helpful, please take a moment to like, comment, or share your thoughts with me.

Mastering Market StructureBullish Market Structure:
Bullish Vibes! It's all about making Higher Highs and Higher Lows. When you spot this pattern, you're riding the wave of optimism in the market, and it's your chance to seize the moment and soar with the bulls.
Consolidation Market Structure:
Consolidation Market Structure is all about lateral movement, where the market forms Equal Highs and Equal Lows. It's a phase of uncertainty, with neither bulls nor bears holding a clear advantage. Traders often await a breakout to determine the next market direction.
Bearish Market Structure:
Bearish Market Structure: Get ready for Lower Highs and Lower Lows. Sellers are in control, creating a solid downtrend. Traders look for short entry opportunities on retracements.

I think from now Indian market is going to 🚀 shoot up The Indian market is showing signs of a strong recovery after a period of volatility and uncertainty. This is just my analysis its not any type of call

#Banknifty Trading Near Important Support ZoneOn Daily Timeframe, BANKNIFTY trading at important support zone. Time to wait for either breakdown or reversal for the Banknifty.
Case 1: Consolidation Move
- Banknifty can consolidate near this support level before the strong movement
- Consolidation zone is nearly 500 points from 44000 to 44500 level
Case 2: Breakdown Move
- Confirmation for breakdown will be if Banknifty starts trading and sustain below 43500 level
- Downside rally nearly 2500+ points expected in case of breakdown
- Intermediate support expected near 42500 level
- Short Trader can place there stop loss if banknifty starts trading above 44550 level
Case 3: Long Side Move
- Long side movement expected in case banknifty starts trading and sustain above 44550 level
- Above this level banknifty can go upto the 46400-46500+ level.
- Intermediate resistance expected near 45500 level
- Long trader can place there stop loss if banknifty starts trading below 43500 level.
To be continue. We will keep posting next update in comment section....

NZDJPY - Following The Trend ↗️Hello TradingView Family / Fellow Traders. This is Richard, also known as theSignalyst.
on Daily: Left Chart
NZDJPY has been overall bullish trading inside that big wedge pattern; and it is currently retesting the lower bound / orange trendline.
on H1: Right Chart
For the bulls to take over, and activate our buy setup, we need a break above the last high in gray.
Meanwhile, NZDJPY would be bearish and can still trade lower, especially if the 87.0 daily low is broken downward.
📚 Always follow your trading plan regarding entry, risk management, and trade management.
Good luck!
All Strategies Are Good; If Managed Properly!
~Rich

#OIL buying opportunityConsidering the recent bullish momentum in the oil market, characterized by a clear market structure of establishing higher highs and higher lows while respecting to a short-term bullish channel, we anticipate that oil prices will rise from their current low, as depicted on the chart.
In addition to the bullish channel, there are other bullish indicators on the chart. Notably, the 1-hour 200EMA (Exponential Moving Average) has consistently provided strong support during this recent bullish phase. Every time the price has approached this EMA, it has turned upwards.
Furthermore, the current price level is situated within a 4-hour demand area, which further enhances the possibility of a bullish movement.
If you've found this analysis helpful, please take a moment to like, comment, or share your thoughts with me.

#AUDNZD selling opportunity
Hello, dear traders and colleagues. I wish you all a successful trading week.
Let's examine the AUDNZD chart to identify a potential selling opportunity.
As you can observe, the price is currently testing the upper boundary of a bearish channel, which has been acting as a resistance following an extended rally. Recent price movements in the past two days show signs of exhaustion, further increasing the likelihood of a bearish move.
Additionally, by examining the daily candlestick, you'll notice that we've experienced upside rejections in the last two days, indicating the presence of selling pressure.
To initiate a sell position on this pair, we would prefer to witness another upward movement, aimed at clearing liquidity from above the horizontal arrow we've marked on the chart. Subsequently, we'll look for a break below the short-term bullish trendline that has kept the price elevated during the recent bullish movement.

#GBPCAD selling opportunityHello, traders and friends.
Let's analyze the GBPCAD chart, where we believe there might be a compelling selling opportunity.
In the Daily timeframe, you can see that the price has already broken the market structure to the downside. Since the low formed on September 28th, we've been in what we believe is a bullish corrective phase. Consequently, we are now interested in a selling position.
Switching to the 4-hour timeframe, we notice a double top formation that resulted in a lower low, indicating the possibility of bearish continuation, aligning with our higher time frame daily trend. Following this, the price has been moving upwards in a bullish corrective manner, forming a short-term rising channel. Last week, this channel also broke to the downside.
In our view, this recent bullish movement resembles a liquidity-taking activity, and we are keen to observe any rejections from the level marked by the arrow on the chart, with the intent to consider selling.
Additionally, we have identified several resistance factors within a small zone, including the 4-hour and daily timeframe 200EMA, a supply area in the 4-hour timeframe, and the previous high where many traders have placed their stop-loss orders just above it. This presents an opportunity for banks to potentially extract liquidity.
If you have found this analysis helpful, please take a moment to leave a like and a comment or share your idea with me.

Gold PutsSeems like price just completed the 5th wave just below the resistance area. And if thats the case then we will be seeing a continuation to A, B and C legs to fully complete this wave and start a new one.

Textbook bull trapThis is a well-known bull trap that whales use to earn money.
1st phase:
They pump price hard, a big candle appears and people FOMO in.
2nd phase:
They sell with benefits and people FUD, making price crash.
Down there, whales accumulate again before pumping price again.
3rd phase:
The 1st phase is repeated, they sell again up there with benefits and let it crash again so people sell everything and repeat in some days/weeks/months.
It's during the 3rd phase that some people don't sell thinking that it will keep pushing up but it doesn't, making them sell at a huge loss, crashing price even harder. This bull trap is the beginning of a big crash. Get ready.
*Not financial advice.
