AUDCAD: The Real Move Happens After the TrapNot every trade needs to be flashy.
This one was clean. Simple. Intentional.
And it came after most traders got taken out.
What I Saw :
Price swept PDL: textbook sell-side liquidity.
But instead of jumping in too early, I waited.
Why?
Because I’ve learned something:
👉 The first reaction is often just noise.
👉 The second one, the one that fills into structure. That’s where clarity lives.
My Entry Logic:
After the sweep, price broke minor structure. That was my Change of Character. I will just have to wait for price to pull into the FVG below 50% fibs retracement. Stop below the low. Target at the PDH.
Nothing fancy. Just discipline .
Psychology Check:
I’ve taken this setup before and watched it run without me. Why? Because I used to hesitate. I wanted more confirmation… or feared being wrong.
But here’s the truth:
Your edge is only real if you’re willing to take the shot when it appears .
This wasn’t a guess.
It was system + structure + emotional control.
Marketstructure

Amd - This starts the next +200% rally!Amd - NASDAQ:AMD - is preparing a major rally:
(click chart above to see the in depth analysis👆🏻)
It has - once again - not been unexpected at all that we now see a major reversal rally on Amd. After the harsh drop of about -65%, Amd retested a significant confluence of support and already created bullish confirmation. It is quite likely that this now starts the next bullrun.
Levels to watch: $100, $300
Keep your long term vision!
Philip (BasicTrading)

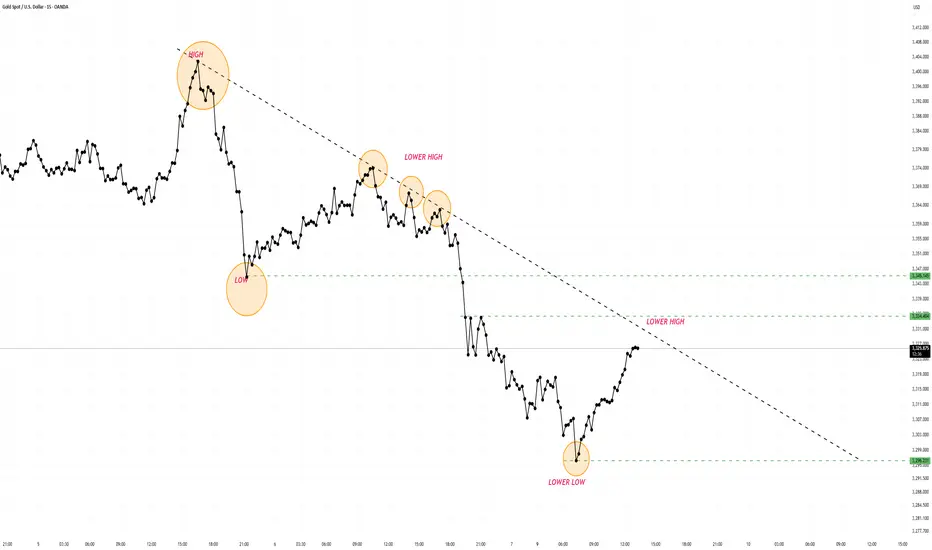
Time for the Hammer?” – When Price Breaks, Then Breathes🧠 What Just Happened?
The chart opens with a classic market behavior:
Price runs above recent highs — triggering a wave of emotional entries and stop hunts. Right after, it drops sharply, hinting that something deeper is at play.
This sequence reflects how markets often:
Bait retail traders with a breakout
Break structure suddenly
Then pull back — not for mercy, but to reload
🔍 Why This Pullback Matters
After the aggressive drop, price didn't just fall aimlessly. It paused and returned to a zone of imbalance , a gap where liquidity is still waiting. That retrace isn’t weakness — it’s intent.
This kind of setup teaches a key concept:
“The real move comes after the aggressive move — not before.”
📚 A Lesson in Patience
Most traders enter on the breakout (the sweep)
Smart traders enter on the pullback into value
Pros wait for the reaction + structure shift before doing anything
This isn’t about being first. It’s about being right when it matters.
🧭 Final Thought
The hammer doesn't fall until the trap is fully set.
Study these moves. Study the emotion behind the candles. That's where edge lives.
💬 Drop your thoughts — did you catch this behavior on Gold today?
🔁 Follow for more thought-driven, story-based chart breakdowns.

HIGHER HIGHS LOWER LOWSMarket structure is making lower highs and lower lows, indicating a short fall if hitting the trending line and also confirming breakout and retest. Keep a watch.
USDJPY: Will This CRT FVG Hold After the PWL Sweep?Price action on USDJPY reflects a clean execution of Candle Range Theory (CRT). Following a sweep of the Previous Week’s Low (PWL), price reacted from a higher timeframe demand zone, grabbing sell-side liquidity before printing a bullish Break of Structure (BOS). This BOS confirmed a shift in market intent and set the stage for a retracement into a clearly defined Fair Value Gap (FVG). I refined the entry on the 4H chart, waiting for price to return to the FVG zone, with risk placed just below the sweep wick. The target is mapped to the next logical supply above a cluster of equal highs and prior inefficiency. This setup reflects a high-conviction CRT play, built from top-down analysis and confluences rooted in market structure, liquidity, and imbalance logic.

Is This the Optimal Entry After a PDL Sweep and FVG Retest?A clean structural development on CHFJPY (1H TF)
After sweeping the Previous Day’s Low (PDL), price created a bullish Break of Structure (BOS) to the upside , shifting short-term sentiment. This BOS was followed by a precise retest into a Fair Value Gap (FVG), suggesting possible continuation as liquidity shifts from weak hands to strong.
🧠 Educational Notes :
CRT Sweep Logic: Market often sweeps the previous day's high or low before making its true move. In this case, a clean PDL sweep was followed by a strong bullish reaction.
Break of Structure (BOS): Confirmed bullish intent after the sweep, validating a shift in order flow.
FVG Retest: Institutional pricing inefficiency filled — a classic SMC continuation behavior.
Entry Thesis: Based on reaction from FVG + BOS confirmation, with invalidation below the swept low and TP near the previous swing high.
This setup is not financial advice, but a clear visual case study for traders applying SMC + CRT logic.

ebay is on sale 🛒Hello TradingView Family / Fellow Traders. This is Richard, also known as theSignalyst.
📈 EBAY has exhibited an overall bullish trend , trading above the orange and blue trendlines.
At present, EBAY is undergoing a correction phase and it is currently approaching a strong support zone 30 - 34
🏹 Thus, the highlighted red circle is a strong area to look for buy setups as it is the intersection of the green support and lower blue and orange trendlines acting as a non-horizontal support.
📚 As per my trading style:
As #EBAY approaches the lower red circle zone, I will be looking for bullish reversal setups (like a double bottom pattern, trendline break , and so on...)
📚 Always follow your trading plan regarding entry, risk management, and trade management.
Good luck!
All Strategies Are Good; If Managed Properly!
~Rich

Multi-Time Frame Analysis (MTF) — Explained SimplyWant to level up your trading decisions? Mastering Multi-Time Frame Analysis helps you see the market more clearly and align your trades with the bigger picture.
Here’s how to break it down:
🔹 What is MTF Analysis?
It’s the process of analyzing a chart using different time frames to understand market direction and behavior more clearly.
👉 Example: You spot a trade setup on the 15m chart, but you confirm trend and structure using the 1H and Daily charts.
🔹 Why Use It?
✅ Avoids tunnel vision
✅ Aligns your trades with the larger trend
✅ Confirms or filters out weak setups
✅ Helps you find strong support/resistance zones across time frames
🔹 The 3-Level MTF Framework
Use this to structure your chart analysis effectively:
Higher Time Frame (HTF) → Trend Direction & Key Levels
📅 (e.g., Daily or Weekly)
Mid Time Frame (MTF) → Structure & Confirmation
🕐 (e.g., 4H or 1H)
Lower Time Frame (LTF) → Entry Timing
⏱ (e.g., 15m or 5m)
🚀 If you’re not using MTF analysis, you might be missing critical market signals. Start implementing it into your strategy and notice the clarity it brings.
💬 Drop a comment if you want to see live trade examples using this method!

Xrp - New all time highs will come next!Xrp - CRYPTO:XRPUSD - is preparing for new all time highs:
(click chart above to see the in depth analysis👆🏻)
Xrp has clearly been trading sideways for the past 8 years. Meanwhile, market structure is respected perfectly and it seems to be just a matter of time until Xrp will create new all time highs. With the recent bullish break and retest, this scenario becomes even more likely.
Levels to watch: $3.0
Keep your long term vision!
Philip (BasicTrading)

EURUSD Weekly Analysis (MMC) – Bearish Path to Target Zone📈 Market Narrative – Understanding EURUSD's Path with MMC
The EURUSD pair is currently navigating a critical phase in its macro price structure, aligning closely with the Mind Market Concept (MMC) methodology — a trading framework rooted in institutional price behavior, psychological arcs, and structured market mapping.
This chart reveals a story of accumulation, expansion, manipulation, and rebalancing — classic smart money behavior playing out on the higher timeframe. The current move is not just price action — it's a strategic delivery of price toward imbalance, guided by volume vacuums, liquidity zones, and engineered traps.
🧩 Phase-by-Phase Technical Analysis
🔷 1. Arc Accumulation Zone – The Beginning of Institutional Positioning
In the latter half of 2024, EURUSD entered a rounded arc formation, which marks a textbook accumulation phase.
This "bowl-like" curve represents gradual absorption of sell-side liquidity by institutions.
The lows became progressively higher, indicating demand stepping in while supply weakened.
Volume during this time was suppressed — another smart money tactic to accumulate without causing price spikes.
📌 Why This Matters: Arcs often precede explosive breakouts, particularly when aligned with time-based liquidity cycles (quarterly/yearly rebalancing). This zone gave birth to the breakout that followed.
🔷 2. The Central Zone – Consolidation Before Expansion
Once the arc base was complete, price broke out impulsively, then pulled back into what is labeled the Central Zone.
This zone acts as a mid-range liquidity pocket — where orders are stacked and reaccumulation occurs.
It also became the launchpad for the final markup wave that tapped the previous target around 1.1250.
🔍 This move was the realignment phase, where smart money took price above key highs to:
Hit their internal targets.
Trap breakout traders.
Induce euphoria before distribution.
🔷 3. Major BOS – Break of Macro Structure
The breakout through 1.1150–1.1200 confirmed a Major Break of Structure (BOS).
This BOS acted as a signal for:
Trend reversal confirmation for many retail traders.
A "green light" to buy — which was anticipated and exploited by institutions.
But here’s the twist:
Price rejected the SR Interchange Zone (support turned resistance), signaling that the breakout was engineered to trap liquidity.
🔷 4. Distribution & Manipulation – The Trap Layer
The chart clearly shows two critical supply areas:
Minor Resistance (around 1.1400s)
Major Resistance (around 1.1550–1.1600s)
Price briefly approached these zones but failed to hold, forming a complex distribution range.
This is where:
Smart money distributed their long positions.
Retail buyers got trapped.
Volume increased during sell-side preparation.
📌 The rejection from these zones sent price into a clean markdown, forming lower highs and confirming the bearish structure mapping.
🔷 5. Structural Mapping – Downtrend Control
Price action is now clearly in a bearish delivery phase, as shown by:
Lower highs & lower lows
Repeated rejections from minor resistance
Large red candles with little retracement (showing momentum)
This phase is often misunderstood by retail traders. But within MMC, it’s identified as the delivery to imbalance — a controlled descent into unmitigated demand.
🔷 6. Target + Reversal Zone – Where the Real Opportunity Begins
We are approaching the most important area on the chart:
🟡 Target + Reversal Zone (around 1.0950–1.1000)
This zone is not randomly drawn:
It's the origin of the arc breakout, a high-volume node.
It's a discounted price level where institutions may re-engage.
It’s untapped demand from the earlier accumulation — meaning no major reaction has occurred here yet.
If price slows down here, forms a liquidity sweep, or gives a bullish engulfing on the lower timeframe — this could be the reversal point.
But:
If price slices through with strong momentum, it may signal macro weakness, opening room to test the 1.0800 region.
🧭 Trade Plan & Execution Guide
Setup Type Actionable Guidance
📉 Bearish Pullback Entry Short entries near 1.1300–1.1350 with stop above minor resistance
🟡 Demand Reversal Watch Wait for reaction in 1.0950–1.1000, assess volume & candle response
📊 Structure Confirmation Use lower timeframe BOS for entry alignment
🛡️ Risk Management Keep risk below 1% per trade, avoid chasing mid-zone prices
💬 Key Takeaways
EURUSD has completed its accumulation → expansion → manipulation cycle.
We are now entering the rebalancing phase, where the market returns to fair value (demand).
Smart money flow is visible — from engineered highs to controlled selloffs.
The Target + Reversal Zone will likely dictate the next macro direction.

XAGUSD Weekly Technical Analysis Breakdown (MMC Style) + Target📈 Chart Summary:
The chart shows the price action of Silver (XAG/USD) on the daily timeframe, capturing a significant shift in market sentiment. This analysis is based on the MMC (Market Maker Cycle) concept and a combination of Smart Money Concepts, Pennant Structure, and Volume Contraction patterns.
Over the past weeks, XAGUSD has transitioned from accumulation and markup to distribution and markdown, suggesting that smart money has exited long positions and is now pushing price toward discount zones for future reaccumulation.
🔍 Detailed Breakdown:
🔹 1. Major Resistance Area – The Selling Origin
At the top of the chart, we see a major resistance zone near $35–$36, which acted as a structural ceiling for months. Each time price approached this area, sellers stepped in aggressively, rejecting price and creating long wicks.
This level represents institutional supply—where big players offload positions, often leaving a liquidity trail behind for later use.
🔹 2. Pennant Formation + Volume Contraction – Classic Distribution
From late April to mid-May, Silver formed a pennant structure, a well-known consolidation pattern. What's special here is the volume contraction—a subtle clue that buyers are drying up while sellers prepare for a large move.
This is a classic Wyckoff distribution behavior:
Buyers are lured in as price moves in a tight range.
Breakout traders enter early expecting a bullish continuation.
Institutions trap liquidity before dumping price into inefficiency.
The mini Break of Structure (BOS) to the upside acted as a false breakout, perfectly engineered to trap liquidity above the pennant.
🔹 3. Structural Breakdown – Momentum Shifts Bearish
Once the trap was complete, price reversed with strong momentum, breaking past key supports and violating internal structure. The label "Structural Analysis" marks the beginning of this break in market structure, confirming the change in character.
This shift aligns with Smart Money’s "Manipulation → Distribution → Expansion" logic.
We also note how price broke below the SR-interchange zone, where support became resistance—a powerful reversal confirmation.
🔹 4. Target + Next Reversal Zone – The Magnet
Currently, Silver is headed toward the $29–$28 zone, highlighted in red as the "Target + Next Reversal" area.
This level has high confluence:
Acts as a previous QFL (Quasimodo Failure Level).
Has unmitigated demand.
Matches with earlier lows where smart money likely accumulated positions.
Here, we can expect either a strong bounce or short-term consolidation before the next directional move.
📌 Confluence Zones:
Key Zone Significance
$35–$36 Major Resistance (Supply / Exit zone)
$33.5 Mini BOS & Liquidity Trap Area
$31.8 – $32.5 Structural Break Zone (Old Demand Broken)
$29 – $28 Target + Reversal (High Confluence Zone)
🧠 Smart Money Perspective:
This entire sequence is not random—it’s engineered.
Institutions:
Collected orders at the bottom.
Pushed price up to resistance.
Consolidated in a pennant to build liquidity.
Triggered a false breakout to trap late buyers.
Dumped aggressively, targeting previous lows for re-entry.
This is the Market Maker Cycle in action — and we’re in the Distribution to Markdown phase right now.
🎯 Trading Plan:
Short-Term Bias: Bearish until $29–$28 is reached.
Swing Traders: Look for signs of reversal in the $28–$29 zone (bullish engulfing, FVG fill, or demand reactivation).
Day Traders: Watch for pullbacks to the $32.5–$33 resistance zone to enter continuation shorts.
🧵 Final Thoughts:
This is a textbook example of how Smart Money manipulates structure, traps liquidity, and moves price in phases. Patterns like pennants, BOS, and SR flips, when combined with volume and context, give us clear directional bias.
If you're still chasing the breakout without understanding the setup behind it, you're trading against those who engineered the move. Understand the structure — or get trapped by it.

Understanding Market StructureIn this video, I break down market structure in a simple and easy-to-digest way, helping you understand how to identify whether the market is in an uptrend or downtrend.
Recognizing market direction is a key skill for any trader, it allows you to trade in alignment with price action and make more confident, higher-probability decisions.
✅ If you're new to trading or want to sharpen your edge, this video will give you the insights needed to read market trends more clearly.
📈 Hope you find value in this breakdown!
👉 Don’t forget to like, comment, and subscribe to support the channel and stay tuned for more educational content.

NQ Breakdown Plan: 3 Targets, 1 Setup, No Chasing🧠 NQ Short Plan – NY Open Game Plan
Price has pulled back into a key structure zone, and I’m watching closely for a sell setup during the first two hours of the New York session tomorrow.
📌 My trade plan is simple:
I want a solid pullback first — not chasing here.
If I get a clean sell trigger (candle confirmation or momentum flush), I’m in.
Break-even gets locked in once we break the 21,349 area.
From there, I’ll take profits in three stages and trail the stop behind price if we get momentum.
🔐 Break-Even Lock: 21,349
✅ TP #1 – 21,200
✅ TP #2 – 21,050
✅ TP #3 – 20,800 (final leg if sellers step in hard)
The rising trendline break could be the domino. If it cracks, we roll.
But if bulls defend again, no trade — discipline first.
📅 Session Focus: Only trading this setup if it unfolds in the first 2 hours of NY open. After that, I’m out.
No chasing. No revenge. Just execution.
💬 Let me know if you’re watching this level too — or if you see something different. Always open to alternate perspectives.

USDJPY SHORTUSDPY is expected to sell to complete the gartley pattern.
Look out for the quasimodo pattern on the 4hr or 8hr time frame to short

Nvidia - The bullish consolidation flag!Nvidia - NASDAQ:NVDA - is still quite bullish:
(click chart above to see the in depth analysis👆🏻)
After Nvidia retested a major horizontal support just last month, we witnessed an extremely strong bullish reversal candle which resulted in a strong +50% rally. Considering the bullish flag consolidation, a breakout is much more likely, but not in the immediate future.
Levels to watch: $150
Keep your long term vision!
Philip (BasicTrading)

Apple - Please look at this chart!Apple - NASDAQ:AAPL - is just wonderful:
(click chart above to see the in depth analysis👆🏻)
Last month, Apple created a quite strong bullish rejection wick of about +25%. It was actually no surprise at all, because market structure was perfectly pushing price higher. Following the bullish break and retest pattern, new all time highs will most likely follow.
Levels to watch: $200, $300
Keep your long term vision!
Philip (BasicTrading)

Bitcoin - Approaching the all time high!Bitcoin - CRYPTO:BTCUSD - will break out again:
(click chart above to see the in depth analysis👆🏻)
It has been quite some time since we saw such a strong move on Bitcoin. But finally - not totally unexpected to be honest - Bitcoin is following its destiny and about to create another new all time high. Patience is key and strategy, risk and mindset will help you master the volatility.
Levels to watch: $100.000
Keep your long term vision!
Philip (BasicTrading)

Just a Thought: What If the Big Bull Run Starts Next February?Chart: SOLUSDT Perpetual (1W)
Let’s play devil’s advocate for a second…
📉 What if:
The most recent pullback from Solana’s all-time high wasn’t just a dip to find support, but a high timeframe market structure break (MSS)?
We wicked right into the Point of Control (POC) at $126, a critical level going back to Solana’s inception. Many saw that as a liquidity sweep, which it is, but what if that break was confirmation of a shift in the macro structure?
Since then, we’ve seen a corrective rally, and as of now, price is approaching the golden pocket (0.618–0.65) around the $200 region coupled with time Fib confluence around June 25.
⚪ The ABC Hypothesis:
There’s a clean potential for an (A)-(B)-(C) correction. If the market can’t push through the $200 resistance in June, we could see a dragged out move down into the 1:1 extension, which interestingly aligns with key monthly naked POCs (MNPOCs) at $73 and $41, and specifically the 1:1 at $49 (highlighted on the chart for September 25).
That would create a textbook ABC correction, where:
• A = drop from ATH to MSS
• B = golden pocket retracement
• C = 1:1 extension, sweeping long-term liquidity
📅 What if the real bull run doesn’t start until Feb 2026?
Everyone’s calling for the big breakout this year… but what if we need one last washout to fully reset? That timing aligns eerily well with early Q1 2026, after a final leg down.
Chart Legend:
• ✅ Green line = current price
• 🔴 POC = Point of Control (macro volume node)
• ⚪ White lines = ABC structure
• 🔵 Blue verticals = time-based Fibonacci
• 🟡 Golden Pocket = 0.618–0.65 retracement
• 🟣 MNPOC Levels = untested monthly points of control
Just a theory. Not advice. DYOR.
What do you think? Could the real reset be coming?

BTCUSD Double Tap Into OB Before Massive Sell-Off! 2,000+ PipsHere’s why this could be one of the cleanest bearish setups of the week based on institutional flow and price action:
🚨 Step 1: Liquidity Engineering in Full Effect
We’ve got multiple areas where price was engineered to grab liquidity — clearly visible with those highlighted zones. Bitcoin pumped into a Strong High, tagging liquidity above a key trendline while respecting an internal parallel channel.
This move was not random. It was a textbook liquidity sweep.
🔁 Step 2: Order Block + 70.5% Fib Confluence
After the sweep, price retraced precisely into a bearish Order Block that overlaps perfectly with the 70.5% Fibonacci level — a hidden gem Smart Money loves to use for optimal entries. It’s the sniper zone.
This is where the first rejection came in, marking the start of bearish intent.
⚠️ Step 3: Break of Structure + Weak Low Exposed
As price dropped, it broke back under a weak low, confirming shift in market structure. This is your Change of Character (ChoCh) — the moment sellers regain control.
We’re now seeing retracement candles struggling to push above the OB/Fib zone. Rejection here confirms the setup.
🎯 Target Zones Breakdown:
✅ TP1 - Weak low around 110,200
✅ TP2 - -27% Extension (~109,500)
✅ TP3 - -62% Fib extension (109,268)
🚀 Extended Target - Possible sweep of Sell Side Liquidity all the way to 108,000–107,500
This is a potential 2000+ pip move if the full extension plays out.
🧠 Market Psychology in Play:
Institutions love to trap traders long after major breakouts. That last pump into the high? It wasn’t retail demand — it was liquidity generation. Now that they’ve swept the highs, they're driving price down to rebalance and mitigate.
Every highlighted zone on this chart? It’s a Smart Money footprint.
📌 Entry Game Plan:
Watch how price behaves around the current OB zone (111,250–111,618).
If price rejects and flips back under the midpoint (111,116), that’s your trigger.
Enter with tight SL above 111,750 and aim for TP1, TP2, and trail the rest to TP3 or lower.
📈 Risk Management Reminder:
Set your SL above structure.
Don’t overleverage — this is a clean setup, but patience is 🔑.
Let price come to you, not the other way around.
✍️ Final Thoughts:
This BTCUSD setup screams Smart Money — we’ve got:
Liquidity grabs ✅
Clean OB + Fib confluence ✅
ChoCh + structural rejection ✅
Strong R:R with multiple targets ✅
This might be the move to catch before the weekend liquidity sweep.
💬 Comment "BTC MOVE" if you’re watching this with me!
🔁 Tag your trading fam who needs to see this breakdown!

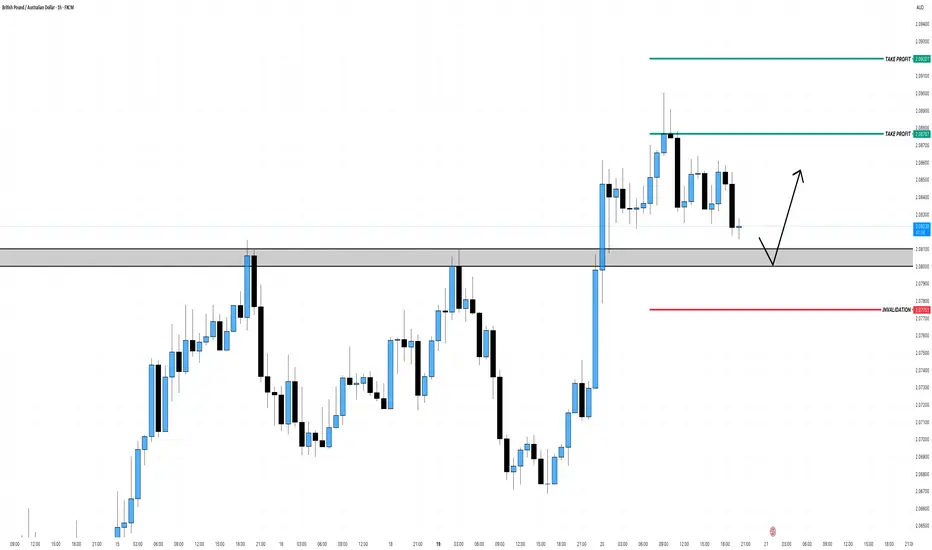
GBPAUD Bullish Break and RetestAfter weeks of consolidation, GBPAUD has broken out above key resistance at 2.0800–2.0830, flipping structure to bullish on the higher timeframes. Price is now retesting this zone.
Wait for bullish confirmation.
FILUSDT — the formation is repeating, the structure is familiar.Filecoin(FIL) - is a decentralized storage system with the goal of "storing humanity's most important information." During its initial coin offering (ICO) in 2017, the project raised $205 million. The launch was initially planned for mid-2019, but the mainnet launch date was postponed until block 148,888, which occurred on October 15, 2020.
📍 CoinMarketCap : #50
📍 Twitter(X) : 667.3K
🔍 What I observe:
I’ve added the full trading history to the chart for better understanding (the chart on exchanges is cut off). The coin is liquid. I also added the prices for the public and private offerings.
There’s a large horizontal channel, or more specifically, a channel within a channel, which has been active for about 1111 days.
After another drop, a descending wedge formed, and now we are witnessing a breakout of its resistance (a retest is possible).
These patterns are ones I regularly track and trade, based on personal experience accumulated over the years and my strategy.
📊 I’ve plotted the nearest resistances and target prices with movement percentage calculations.
💭 It’s quite possible that this formation in the lower part of the wedge, coinciding with the area of lows on the support of the outer channel, was used to gather liquidity and shake out weak hands.
I also want to point out the large wicks in this zone - a characteristic pattern for accumulation points and subsequent reversals.
______
📌 Not financial advice. Observing structure and recurring phases.
Operate within your strategy and with an awareness of risks.

Gold - This is still clearly not over!Gold - TVC:GOLD - just needs a moment to breathe:
(click chart above to see the in depth analysis👆🏻)
It is just incredible how Gold has been rallying lately. Just over the past 1.5 years, Gold is up another +80% and is creating new all time highs every month. Since these strong rallies continue a lot longer than most people think, Gold still has significant upside potential.
Levels to watch: $3.500, $4.000
Keep your long term vision!
Philip (BasicTrading)

Market Structure Shift Meaning and Use in ICT TradingMarket Structure Shift Meaning and Use in ICT Trading
In ICT (Inner Circle Trader) trading, understanding Market Structure Shifts (MSS) is crucial for accurately interpreting market trends and making informed trading decisions. This article delves into the significance of MSS, its distinct indicators, and how it integrates with other trading elements like Breaks of Structure and Changes of Character.
Understanding Breaks of Structure and Change of Character
Comprehending the dynamics of Breaks of Structure (BOS) and Change of Character (CHoCH) can be crucial for analysing market trends. A Break of Structure occurs when price levels move beyond established support or resistance areas, indicating a potential continuation or acceleration of the current trend. For example, in an uptrend, a BOS is identified when prices break above a previous resistance level, suggesting further upward movement.
Conversely, a Change of Character signifies a possible shift in the market's direction. This occurs when the price action breaks against the prevailing trend, challenging the recent high or low points that served as market barriers. A CHoCH often raises a red flag about the sustainability of the current trend. For instance, in a sustained uptrend, a CHoCH would be marked by a significant downward breach that violates a previous low point, hinting at a weakening of bullish momentum.
Both BOS and CHoCH are pivotal in the ICT (Inner Circle Trader) methodology, where they are used to gauge market sentiment and potential shifts in trend dynamics. Traders monitor these patterns to adjust their strategies, whether to capitalise on the continuation signalled by a BOS or prepare for a trend reversal suggested by a CHoCH.
What Is a Market Structure Shift?
MSS, meaning a Market Structure Shift, is an indicator of a significant change in the prevailing trend, marked by a series of patterns that suggest a reversal is imminent. An ICT MSS is more than a simple Change of Character (CHoCH); it includes additional signals that strengthen the case for a directional change.
The process begins with a shift in market structure that fails to sustain the ongoing trend. For example, during an uptrend, the market might fail to make a new higher high, instead forming a lower high. This initial deviation raises a caution flag about the trend’s strength.
The confirmation of an MSS in trading occurs when there is a decisive break of a significant swing point, accompanied by a strong impulse move that deeply penetrates through this point, known as a displacement. This displacement is critical—it’s not merely a slight breach but a robust move that clearly indicates a shift.
In essence, an MSS signals that the current market momentum has not only paused but is likely reversing. For traders, this is a pivotal moment: the lower highs in an uptrend or the higher lows in a downtrend prior to the break suggest that a new opposite trend is starting to take shape.
How to Use a Market Structure Shift in Trading
An MSS ultimately serves as a directional tool. It helps traders understand when a potential trend reversal is underway, enabling them to align their strategies with the new market direction.
To effectively use an MSS in trading, traders often follow these steps:
- Observing Current Market Structure: They start by analysing the existing trend direction and key price levels. Understand whether the market is in an uptrend, downtrend, or sideways movement by identifying patterns of higher highs and higher lows or lower highs and lower lows.
- Watching for a Break in Key Levels: The core of an MSS is the break of an important high or low, combined with a sharp price movement that breaches a significant swing point (displacement).
- Confirming with News Releases: MSS often coincides with major economic announcements or news releases that can affect market sentiment significantly. For example, if there's a report indicating unexpectedly high US inflation rates, and this correlates with a sharp downward movement in EURUSD, it provides additional confirmation of the MSS. A stronger dollar against the euro, in this case, would signal a clear shift in market direction towards favouring the dollar.
By recognising these elements, traders can more confidently anticipate and adapt to changes in market direction. A well-identified MSS not only indicates a pause in the current trend but also the establishment of a new trend.
Using Market Structure Shifts With Other ICT Components
Using Market Structure Shifts with other Inner Circle Trader methodology components like break of structure, order blocks, and fair value gaps may enhance a trader's ability to interpret and react to market dynamics.
Integrating MSS with ICT Market Structure
An MSS identifies a potential reversal in the market’s direction. When an MSS occurs, it often leads to the formation of a new high-low range in the direction of the new trend. For example, if a bearish MSS results in a new lower high and lower low, traders can watch for a BOS of this range. A retracement back inside of the new range can signal a decent area to search for an entry to ride the trend that’s just beginning.
Utilising Order Blocks and Fair Value Gaps
However, there are scenarios where the price doesn’t establish a new high-low range but instead returns to the area where the original displacement occurred. This displacement often leaves behind a fair value gap and an order block.
- Fair Value Gap: This is a price range that the market skips over quickly during a displacement, leaving it untested by typical market trading. It often acts like a vacuum, drawing the price back to fill in the gap at a later stage.
- Order Block: An order block is typically a consolidation area that precedes a strong price move and is considered a footprint left by institutional traders. It represents levels where significant buying or selling occurred, potentially acting as support or resistance in future price movements.
If the price returns to fill a fair value gap and enters the order block, this scenario can provide a potent setup for a reversal. Traders might look for confirmatory signals at these levels to enter trades that anticipate the market returning to its previous course or extending the reversal initiated by the MSS.
The Bottom Line
The insights provided on MSS and its application within the ICT trading framework can be instrumental for any trader seeking to navigate the complexities of the market effectively. To put these strategies into practice and potentially improve your trading outcomes, practice a lot and learn more about ICT trading.
FAQs
What Is a Market Structure Shift?
A Market Structure Shift (MSS) indicates a potential reversal in market trends, marked initially by a lower high in an uptrend or a higher low in a downtrend, followed by a displacement—a significant and rapid price movement that decisively breaks through a key market level.
How to Identify Market Structure Shift?
Identifying an MSS involves observing for early signs of trend weakening (lower highs or higher lows) and waiting for a subsequent displacement that confirms the shift. This displacement should significantly penetrate a key swing point, clearly indicating a new direction in market momentum.
What Is the ICT Method of Trading?
The ICT (Inner Circle Trader) method of trading is a comprehensive approach that utilises various trading concepts such as market structure, order blocks, and fair value gaps, focusing on how institutional traders influence the market. It emphasises understanding and leveraging these components to align trading strategies with probable market movements.
What Is the Difference Between MSS and BOS in ICT?
In ICT, a Market Structure Shift (MSS) refers to a potential trend reversal, confirmed by a lower high/higher low followed by a displacement. A Break of Structure (BOS), however, simply indicates the continuation or acceleration of the current trend without necessarily suggesting a reversal, marked by the breach of a key high or low point within the ongoing trend direction.
This article represents the opinion of the Companies operating under the FXOpen brand only. It is not to be construed as an offer, solicitation, or recommendation with respect to products and services provided by the Companies operating under the FXOpen brand, nor is it to be considered financial advice.
