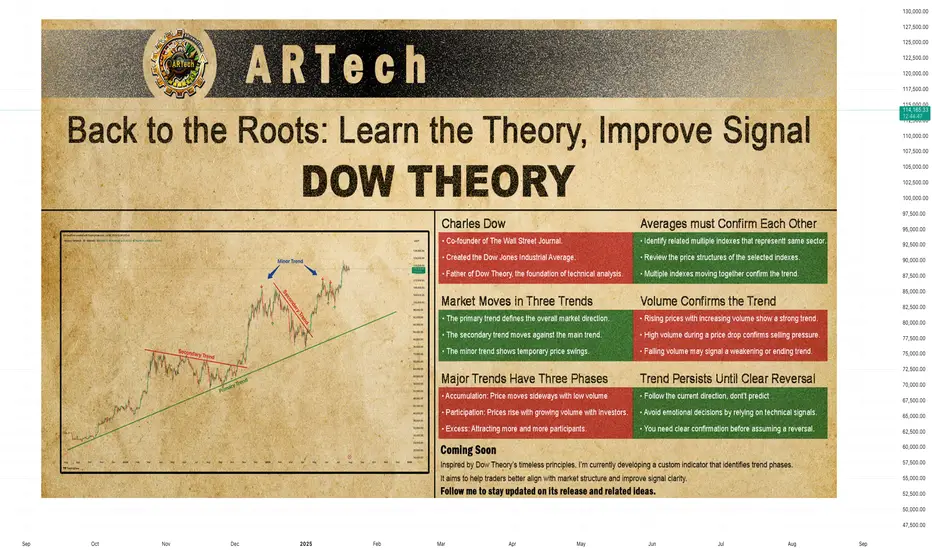
DOW THEORYBack to the Roots: Learn the Theory, Improve Signal
Charles Dow
Before we explore Dow Theory, let’s take a moment to understand who Charles Dow was — and why his ideas still matter today.
Charles Dow wasn’t a financial expert. He was a journalist with a sharp eye for market behavior. In the late 1800s, he began to write about how prices move, how trends form, and what they might mean. His goal was simple: to bring structure and logic to the chaotic world of stock prices.
More importantly, he believed that markets move in trends , and that these trends reflect the collective psychology of all investors. This basic idea became the starting point of technical analysis .
Dow created one of the first stock indexes, which helped investors see the bigger picture instead of focusing only on individual stocks. He also promoted transparency in financial data — long before it was required by law.
In 1889, Dow co-founded The Wall Street Journal, a newspaper that became the voice of financial markets. Through its pages, he published his observations on price behavior, setting the foundation for what would later be known as Dow Theory .
Dow Theory
At the heart of Dow Theory lies a simple but powerful idea:
The market discounts everything.
This means that all known information — earnings reports, interest rates, economic events, political changes, and even future expectations — is already reflected in the price. Price is not random. It is the result of collective investor behavior based on all available knowledge.
Charles Dow didn’t write this exact sentence, but his work clearly reflected this belief. He trusted that by analyzing price movements alone, one could understand the overall direction of the market — because price already includes all the important signals.
Dow and later analysts outlined a set of guiding principles. These are now known as the Six Core Principles of Dow Theory , and they continue to serve as a foundation for modern technical analysis.
The market discounts everything
The market moves in three trends
Major trends have three phases
Averages must confirm each other
Volume confirms the trend
A trend stays in place until it clearly reverses
🔸🔸🔸 The Market Moves in Three Trends 🔸🔸🔸
According to Dow Theory, market movements are not random. Prices move in three different dimensions and time frames: the primary trend , the secondary trend , and the minor (short-term) trend. These three types of movement often occur at the same time. It is very important for an investor to distinguish between them.
The primary trend shows the general direction of the market and can last for months or even years. It’s the major upward or downward movement.
The secondary trend refers to corrections or pullbacks that move in the opposite direction of the primary trend.
The minor trend typically consists of daily or weekly fluctuations and is often considered market “noise.” These short-term movements can occur in the same or opposite direction of the primary trend and may last from a few hours to two or three weeks.
Dow Theory emphasizes that understanding this three-layered structure can protect investors from many mistakes. The theory not only classifies trends but also offers valuable lessons about investor behavior.
It especially highlights the importance of three key principles:
Don’t go against the main trend
Short-term moves can easily confuse traders. Trading against the primary trend often leads to losses. That is why it is crucial to identify the main trend and follow it.
Diversify your exposure
In Dow’s time, technology wasn’t as advanced as it is today, but he still followed multiple indexes (like industrials and transport) to reduce risk. The same principle applies today: investors shouldn’t rely on a single asset — diversification remains a critical part of managing risk.
Define your holding period before entering a trade
Each type of trend comes with a different time expectation. The holding period you choose will play a key role in shaping your trading strategy and aligning it with your financial goals. Instead of debating how long each type of trend should last, it’s more important to define your intended holding period before entering a position.
Your answer to the question “Which holding period suits me?” reflects not only your trading style and lifestyle, but also determines which chart timeframes and indicator timeframes you should use.
🔸🔸🔸 Major Trends Have Three Phases 🔸🔸🔸
According to Dow Theory, major (primary) trends consist of three phases. This structure reflects how investor psychology changes over time and how those emotions are reflected in price action. Regardless of whether the trend is bullish or bearish, each major trend includes these three stages:
Accumulation Phase
The first stage of a bull market often looks like a small bounce during a bear trend. Most people still feel negative about the market. They are afraid to buy again after losing money. Trading volume is low, and prices move in a narrow range. The market stops making new lows, but investors are still unsure. Many have left the market or are very careful now. The price action becomes slow and sideways. It feels boring. But during this quiet time, smart investors slowly start buying. This is how a new trend begins — silently and with doubt.
However, there is no clear signal that a bull market has started. Buying now carries two big risks. First, the market may still go lower. Second, even if a bull trend is coming, no one knows when it will start. How long can you wait while the market does nothing? Holding positions in a flat market has costs — financial, emotional, and missed opportunities elsewhere. That’s why this phase is difficult for most traders to handle.
Public Participation Phase
The market begins to recover, and the broader investor base starts to notice positive changes. News improves, technical indicators give bullish signals. Prices rise, and trading volume increases. This is usually the strongest part of the trend. At this stage, more disciplined and research-driven investors — who follow the market closely — start buying in. They see confirmation in both price action and economic data. Their confidence supports the trend, and momentum grows. The market attracts more attention. Confidence replaces fear. Many investors who stayed out during the earlier phase now feel safer to enter.
Joining the market during this phase is important. The trend is already underway, but there’s still room to grow. Risk is lower than in the early phase, and potential rewards are still high. For many investors, this is the best time to take a position.
Excess Phase
The market enters a phase of excessive optimism. Prices have been rising for a long time, attracting more and more participants. However, during this stage, institutional investors and professional traders who entered earlier begin to gradually take profits.
Although prices remain high, momentum weakens, and the rate of increase slows down. Looking at the volume profile, prices may reach new highs but often without volume support. Technical indicators frequently show bearish divergences. These conditions generate early technical signals that the primary trend may be coming to an end.
🔸🔸🔸 Averages must Confirm Each Other 🔸🔸🔸
According to Dow Theory, a market trend is considered valid only when different indexes move in the same direction. The term “average” here refers to an index or the general direction of a price series. This principle is used to assess whether a price movement is supported by broad market participation.
A single index reaching a new high or low is not enough. For a real and sustainable trend to be confirmed, related indexes are expected to show similar movement and generate signals in the same direction. If this confirmation is missing, the current move may be considered weak or temporary.
How to Analyze It:
Identify related indexes
Choose multiple indexes that represent the same market, sector, or economic domain.
Compare trend direction
Review the price structures of the selected indexes. Are they all showing similar patterns? Did the new highs or lows form around the same time?
Look for confirmation
If multiple indexes form new structures in the same direction (e.g., all make new highs in an uptrend), this increases the validity of the trend.If only one index is moving while others are not participating, confirmation is lacking.
Be cautious without confirmation
When confirmation is missing, trading strategies should be more conservative, or additional signals should be awaited before taking action.
🔸🔸🔸 Volume Confirms the Trend 🔸🔸🔸
According to Dow Theory, the validity of a market trend depends not only on price movement but also on trading volume. For a trend to be considered strong and sustainable, price action should be supported by volume.
Why Is Volume Important?
In a rising market, increasing volume is expected. This indicates growing investor interest and broader participation in the trend.
In a falling market, if the decline happens with high volume, it suggests serious selling pressure and strengthens the trend.
Declining volume may signal a loss of momentum and suggest that the current trend is weakening or nearing its end.
How to Analyze It:
Observe the relationship between price and volume:
Price rising + volume increasing → Strong trend
Price rising + volume decreasing → Lack of confirmation; caution is advised
Check volume during breakouts:
If resistance or highs are broken with strong volume → Reliable signal
If breakouts happen on low volume → May indicate a false move (fakeout)
🔸🔸🔸 A Trend Persists Until a Clear Reversal Occurs 🔸🔸🔸
This core principle of Dow Theory is at the heart of all trend-following strategies.
It states that once a price begins moving in a certain direction, the trend is assumed to continue — until there is clear and technically confirmed evidence that it has ended.
Why Is This Principle Important?
Follow, don’t predict
Instead of guessing what the market will do next, traders stay with the current direction.
Reduces emotional decisions
Trades are based on technical signals, not assumptions like “the price is too high, it must fall.”
A weak trend is not the same as a reversal
Not every pullback means the trend is over. You need clear confirmation before assuming a reversal — such as a breakdown, volume shift, momentum loss, or structural change.
How to Apply It
First, identify the trend direction clearly, and trade in that direction.
Pullbacks are seen as normal movements within the trend — not as reversals.
Even when signs of a reversal appear, wait for confirmation before acting.
Confirmation signals may include:
Failure to form new highs or lows
A break of previous support or resistance
Sudden drop in volume or volume rising in the opposite direction
Weakness or divergence in momentum indicators
Strategic Benefit
This principle is especially useful in trend-following strategies. It helps avoid premature exits and allows traders to stay in profitable trends longer. By focusing on technical confirmation instead of speculation or panic, it encourages disciplined and systematic decision-making.
Markettrends
Last week Bitcoin created massive liquidity at a key resistance!🚨 Bitcoin Update – A Bullish Storm Is Brewing? 💥
Last week, Bitcoin created massive liquidity at a key resistance zone, and guess what? That liquidity is still untouched. The market hasn’t fully tapped into it yet — and that’s a big deal.
Recently, BTC smashed through resistance and even left behind a Bullish Fair Value Gap (FVG), signaling strength. But hold on—after this breakout, the market is showing signs of a minor pullback, likely to retest its marked IRL (Important Reaction Level).
📉 It’s cooling off temporarily... but don’t blink. This zone could act as a springboard for the next big leg up.
💡 Here’s the kicker: there’s still a ton of liquidity waiting above. If the market wants it—and it usually does—there’s a high probability (80%+) of another bullish push.
👀 Watch this area closely. It’s a make-or-break zone.
📊 Do Your Own Research (DYOR) – this is not financial advice, just a friendly nudge from the charts.

Is the Golden Arches Losing Its Shine?McDonald's, a global fast-food icon, recently reported its most significant decline in U.S. same-store sales since the peak of the COVID-19 pandemic. The company experienced a 3.6 percent drop in the quarter ending in March, a downturn largely attributed to the economic uncertainty and diminished consumer confidence stemming from President Donald Trump's tariff policies. This performance indicates that the unpredictable nature of the trade war is prompting consumers to curb discretionary spending, directly impacting even seemingly resilient sectors like fast food through reduced customer visits.
The link between sinking consumer sentiment and tangible sales figures is evident, as economic analysts note the conversion of "soft data" (sentiment) into "hard data" (sales). While some commentators suggest that McDonald's price increases have contributed to the sales slump, the timing of the decline aligns closely with a period of heightened tariff-related anxiety and a contraction in the U.S. economy during the first quarter. This suggests that while pricing is a factor, the broader macroeconomic environment shaped by trade tensions plays a critical role.
In response, McDonald's emphasizes value offerings to attract and retain customers navigating a challenging economic landscape. The company's struggles mirror those of other businesses in the hospitality sector, which also report reduced consumer spending on dining out. The situation at McDonald's serves as a clear illustration of how complex trade policies and the resulting economic uncertainty can have far-reaching consequences, affecting diverse industries and altering consumer behavior on a fundamental level.

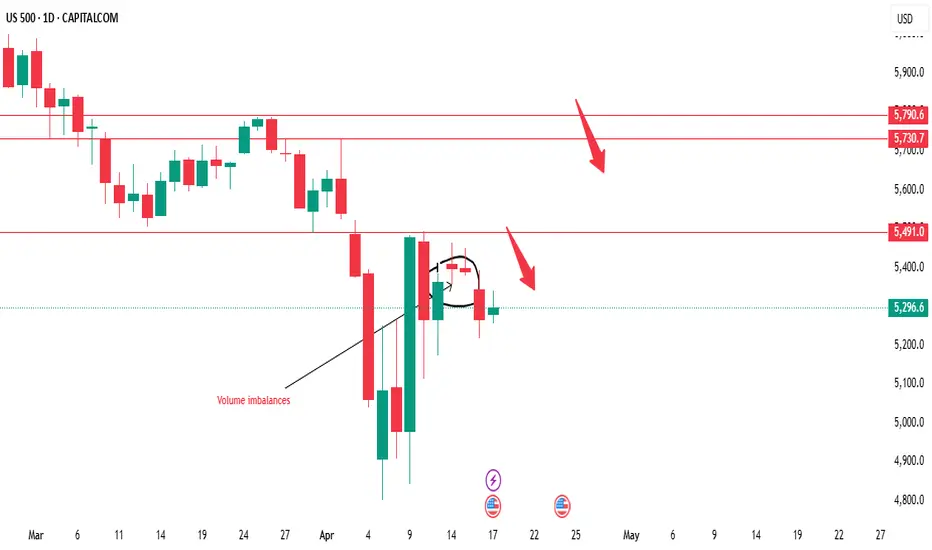
US500's performance this week will be crucial in determiningUS500 Weekly Analysis
The US500 index is currently exhibiting bearish tendencies, but a crucial level to monitor is $5491. This level has the potential to act as a resistance point, and we're looking for a possible selling opportunity around this area. However, if the market breaks above $5491, it could signal a shift in bias towards bullish territory, potentially leading to a significant upward move.
Key Levels to Watch:
1. Sell Zone: $5491 - This level is critical in determining the next move. We'll be watching for confirmation to sell, such as bearish candlestick patterns or trend indicators.
2. Resistance Area: $5730 - $5790 - A strong resistance zone that could potentially cap upward movements.
Trading Strategy:
1. Wait for Confirmation: We'll wait for the market to reach the $5491 level and look for confirmation to sell. This could include bearish candlestick patterns, trend indicators, or other technical signals.
2. Breakout Scenario: If the market breaks above $5491, we'll reassess the bullish potential and look for opportunities to buy.
3. Risk Management: It's essential to manage risk effectively, setting stop-losses and take-profits according to our trading plan.
Market Outlook:
The US500's performance this week will be crucial in determining the next direction. We'll be monitoring the market closely, analyzing price action, and providing updates on any developments. Stay tuned for our analysis and guidance on potential trading opportunities.
By keeping a close eye on these key levels and waiting for confirmation, we can make more informed trading decisions and navigate the markets effectively.
DXY – Key Level Broken, More Downside Ahead?Hello Folks , Long time no see .
The US Dollar Index (DXY) just broke below 106.5, and things are getting interesting. The trend has been weakening, and price is now sitting at a crucial zone.
📌 Here’s what I’m watching:
107.66 is the big resistance. If price can reclaim it, bulls might have a chance.
105.48 & 104.46 are the next major support levels.
👀 My Take:
If we stay below 106.5, I expect more downside towards 105.4 and maybe 103.3. If price bounces and reclaims 107, I’ll reconsider.
What’s your view? More downside or a bounce coming? Drop your thoughts below! 🚀🔥
🚨 Disclaimer:
Just sharing ideas here—this isn’t a trade advice . Everyone sees the market differently, and the goal is to improve our analysis, not tell anyone what to do. At the end of the day, your trades are your call, your responsibility. Trade smart! 🚀📊

$AVAX: Avalanche – Snowballing Gains or Melting Away?(1/9)
Good evening, everyone! 🌙 CRYPTOCAP:AVAX : Avalanche – Snowballing Gains or Melting Away?
With AVAX at $23.07, is this blockchain beast a sleeper hit or a slippery slope? Let’s avalanche into it! 🔍
(2/9) – PRICE PERFORMANCE 📊
• Current Price: $ 23.07 as of Mar 25, 2025 💰
• Recent Move: Up from $18, below $40 highs, per data 📏
• Sector Trend: Crypto volatile, AVAX rides the waves 🌟
It’s a rollercoaster—hold tight for the drop! ⚙️
(3/9) – MARKET POSITION 📈
• Market Cap: Approx $9.56B (414.78M tokens) 🏆
• Operations: Scalable L1 for DeFi, dApps, subnets ⏰
• Trend: $1.121B DeFi TVL, whale buys, per posts on X 🎯
Firm in L1 race, but market’s a blizzard! 🚀
(4/9) – KEY DEVELOPMENTS 🔑
• Whale Action: 500K tokens moved, per posts on X 🌍
• DeFi Strength: $1.121B TVL holds firm, per data 📋
• Market Vibe: Bearish Fear Index (34), yet resilient 💡
Snowballing quietly amid crypto storms! ❄️
(5/9) – RISKS IN FOCUS ⚡
• Market Correction: Bearish pressure could sink it 🔍
• Competition: Solana, Ethereum vie for dApps 📉
• Macro Woes: Trade tensions, rates shake things ❄️
It’s a chilly slope—brace for ice! 🛑
(6/9) – SWOT: STRENGTHS 💪
• Scalability: 4,500 TPS, beats rivals 🥇
• DeFi Base: $1.121B TVL, solid ecosystem 📊
• Adoption: Enterprise use grows, per data 🔧
Got a snowy peak of potential! 🏔️
(7/9) – SWOT: WEAKNESSES & OPPORTUNITIES ⚖️
• Weaknesses: Volatility, high off $59 peak 📉
• Opportunities: Whale buys, subnet growth 📈
Can it snowball or melt under pressure? 🤔
(8/9) – POLL TIME! 📢
AVAX at $23.07—your take? 🗳️
• Bullish: $30+ soon, whales fuel it 🐂
• Neutral: Steady, risks balance out ⚖️
• Bearish: $18 looms, correction hits 🐻
Chime in below! 👇
(9/9) – FINAL TAKEAWAY 🎯
AVAX’s $23.07 price tags a volatile gem 📈, with DeFi strength but market risks 🌿. Dips are our DCA jackpot 💰—buy low, ride high! Gem or bust?

CAKEUSDT (PancakeSwap): Sweet Gains or Stale Trade?(1/9)
Good afternoon, everyone! ☀️ CAKEUSDT (PancakeSwap): Sweet Gains or Stale Trade?
With CAKE at $2.599, is this DEX token a tasty treat or a flat pancake? Let’s flip the details! 🔍
(2/9) – PRICE PERFORMANCE 📊
• Current Price: $ 2.599 as of Mar 25, 2025 💰
• Recent Move: Consolidating $2.6-$2.8, up from $2.34, per data 📏
• Sector Trend: Crypto steady, DeFi mixed amid trade tensions 🌟
It’s a flip-flop—value might be cookin’! ⚙️
(3/9) – MARKET POSITION 📈
• Market Cap: Approx $760M (292M circulating) 🏆
• Operations: Leading BNB Chain DEX, yield farming, staking ⏰
• Trend: Deflationary model burns 102% minted, per data 🎯
Firm in DeFi, but volatility’s the spice! 🚀
(4/9) – KEY DEVELOPMENTS 🔑
• Recent Surge: Up 45% earlier in March, per X posts 🌍
• Platform Updates: Expanded NFT marketplace, per web data 📋
• Market Reaction: High volume ($230M daily), showing interest 💡
Adapting to DeFi trends, cooking up growth! 🍳
(5/9) – RISKS IN FOCUS ⚡
• Regulatory Risks: Crypto scrutiny could hit DEXs 🔍
• Market Volatility: Crypto swings could drag price down 📉
• Competition: Other DEXs like Uniswap challenge, per data ❄️
It’s a risky recipe—watch the heat! 🛑
(6/9) – SWOT: STRENGTHS 💪
• DEX Leader: Top on BNB Chain, strong user base 🥇
• Deflationary Model: Burns tokens, potentially boosts value 📊
• High Volume: $230M daily, per data, shows activity 🔧
Got a sweet spot in DeFi! 🏦
(7/9) – SWOT: WEAKNESSES & OPPORTUNITIES ⚖️
• Weaknesses: Price volatility, regulatory fears 📉
• Opportunities: DeFi adoption, new features like lending 📈
Can it rise or get burned? 🤔
(8/9) – POLL TIME! 📢
CAKE at $2.599—your take? 🗳️
• Bullish: $3+ soon, DeFi booms 🐂
• Neutral: Steady, risks balance gains ⚖️
• Bearish: $2 drops, market sours 🐻
Chime in below! 👇
(9/9) – FINAL TAKEAWAY 🎯
CAKE’s $2.599 price reflects consolidation, with strengths in its platform and deflationary model, but risks from market volatility and competition persist. DCA-on-dips could be a strategy to average in over time, banking on long-term growth. Gem or bust?

$XAUUSD (Gold): Golden Rally or Gilded Pause?(1/9)
Good morning, everyone! ☀️ XAUUSD (Gold): Golden Rally or Gilded Pause?
With gold at $3,020.82, is this safe-haven surge a treasure or a tease? Let’s sift through the shine! 🔍
(2/9) – PRICE PERFORMANCE 📊
• Current Price: $ 3,020.82 per ounce as of Mar 25, 2025 💰
• Recent Move: Near $3,057 high from Mar 20, per data 📏
• Sector Trend: Precious metals up on tension, per posts on X 🌟
It’s a golden glow—let’s see if it holds! ⚙️
(3/9) – MARKET POSITION 📈
• Global Role: Top safe-haven asset ⏰
• Drivers: Central bank buying, geopolitical risks 🎯
• Trend: Bullish near $3,000, per data 🚀
Firm as a refuge, shining in uncertainty! 🏦
(4/9) – KEY DEVELOPMENTS 🔑
• Geopolitical Boost: Trade tensions linger, per data 🌍
• U.S. Data: PMI strength supports USD, caps gold, per posts on X 📋
• Market Reaction: Consolidating near $3,020-$3,030 💡
Simmering in a tense market! 🌩️
(5/9) – RISKS IN FOCUS ⚡
• Profit-Taking: Post-$3,000 sales loom 🔍
• U.S. Rates: Policy shifts could hit, per data 📉
• Oil Prices: CAD link affects broader forex ❄️
It’s a shiny tightrope—watch your step! 🛑
(6/9) – SWOT: STRENGTHS 💪
• Safe Haven: Thrives in chaos, per posts on X 🥇
• Central Banks: Steady buying props it up 📊
• Green Demand: Key in renewables, per data 🔧
Got a golden backbone! 🌟
(7/9) – SWOT: WEAKNESSES & OPPORTUNITIES ⚖️
• Weaknesses: Volatility from profit-taking 📉
• Opportunities: More tensions, rate cuts 📈
Can it gleam higher or dim out? 🤔
(8/9) – POLL TIME! 📢
Gold at $3,020.82—your take? 🗳️
• Bullish: $3,100+ soon, rally rolls 🐂
• Neutral: Steady, risks balance out ⚖️
• Bearish: $2,950 looms, correction hits 🐻
Chime in below! 👇
(9/9) – FINAL TAKEAWAY 🎯
Gold’s $3,020.82 price tags a safe-haven rally 📈, but volatility’s in the mix 🌿. Dips are our DCA jackpot 💰—buy low, ride high! Gem or bust?

$USDCAD – Dollar Dominance or Canadian Comeback?(1/9)
Good evening, everyone! 🌙 USDCAD – Dollar Dominance or Canadian Comeback?
With USDCAD at 1.43180, is the US dollar’s reign continuing, or is the Canadian dollar poised for a resurgence? Let’s dive into the currency markets! 🔍
(2/9) – PRICE PERFORMANCE 📊
• Current Rate: 1.43180 as of Mar 24, 2025 💰
• Recent Move: Up from 1.3700 in Apr 2024, showing US dollar strength 📏
• Sector Trend: Currency markets volatile, driven by economic indicators and policies 🌟
It’s a dynamic market—let’s see what’s driving the dollar’s dominance! ⚙️
(3/9) – MARKET POSITION 📈
• Exchange Rate: USDCAD reflects USD value against CAD 🏆
• Coverage: Influenced by interest rates, economic growth, commodity prices ⏰
• Trend: US dollar strengthening, CAD weakening, per price movement 🎯
Firm in its position, but can the CAD make a comeback? 🚀
(4/9) – KEY DEVELOPMENTS 🔑
• Interest Rates: US rates higher than Canada’s, attracting investment to USD 🌍
• Commodity Prices: Potential drop in oil prices weakening CAD, per data 📋
• Economic Growth: US economy outperforming Canada, per reports 💡
These factors are stirring the pot! 🛢️
(5/9) – RISKS IN FOCUS ⚡
• Interest Rate Changes: Fed or BoC policy shifts can alter the landscape 🔍
• Commodity Market: Volatility in oil and other commodities affects CAD 📉
• Global Economy: Economic slowdowns or recoveries impact currency values ❄️
It’s a risky dance—watch your steps! 🛑
(6/9) – SWOT: STRENGTHS 💪
• US Dollar: Higher interest rates, safe haven status, strong economy 🥇
• Canadian Dollar: Supported by commodity exports, diversified economy 📊
Both have their strengths, but the balance tips towards USD currently! 🏦
(7/9) – SWOT: WEAKNESSES & OPPORTUNITIES ⚖️
• US Dollar Weaknesses: Potential overvaluation, trade tensions 📉
• Canadian Dollar Opportunities: Rising commodity prices, tech sector growth 📈
Can CAD turn the tables or will USD continue to dominate? 🤔
(8/9) – POLL TIME! 📢
USDCAD at 1.43180—your take? 🗳️
• Bullish on USD: 1.50+ soon, dollar’s dominance continues 🐂
• Neutral: Sideways movement, risks balance out ⚖️
• Bullish on CAD: 1.40 below, Canadian dollar rebounds 🐻
Chime in below! 👇
(9/9) – FINAL TAKEAWAY 🎯
USDCAD’s 1.43180 price reflects US dollar strength 📈, but CAD has its own aces up its sleeve. Strategic trading could be key to navigating this pair. Gem or bust?

$CPB: Campbell Soup – Simmering or Boiling Over?(1/9)
Good afternoon, everyone! ☀️ NASDAQ:CPB : Campbell Soup – Simmering or Boiling Over?
With CPB at $38.21, is this iconic soup maker a tasty investment or a stale option? Let’s ladle out the details! 🔍
(2/9) – PRICE PERFORMANCE 📊
• Current Price: $ 38.21 as of Mar 24, 2025 💰
• Recent Move: Down from $43.00 (early 2025), an 11% dip, per data 📏
• Sector Trend: Consumer goods volatile, inflation pressures, per posts on X 🌟
It’s a mixed stew—let’s see what’s cookin’! ⚙️
(3/9) – MARKET POSITION 📈
• Market Cap: Approx $11.4B (298.5M shares) 🏆
• Operations: Soups, snacks, meals, strong brand presence ⏰
• Trend: Digital sales up, per historical data, but competition fierce 🎯
Firm in the pantry, but is it a staple or a luxury? 🏭
(4/9) – KEY DEVELOPMENTS 🔑
• Recent Earnings: Q4 2024 mixed, revenue up, EPS missed, per data 🌍
• Innovation Push: Plant-based, keto options, per reports 📋
• Market Reaction: Price reflects caution, per posts on X 💡
Stirring the pot with new flavors! 🍲
(5/9) – RISKS IN FOCUS ⚡
• Inflation: Higher costs squeeze margins 🔍
• Competition: Private labels, Kraft Heinz, per data 📉
• Health Trends: Shift to healthier options, per posts on X ❄️
It’s a spicy market—watch out for heat! 🛑
(6/9) – SWOT: STRENGTHS 💪
• Iconic Brand: Campbell’s soup, strong loyalty 🥇
• Diverse Portfolio: Soups, snacks, meals, per data 📊
• Dividend Yield: ~3.5%, attractive for income seekers 🔧
Got a robust recipe for success! 🏦
(7/9) – SWOT: WEAKNESSES & OPPORTUNITIES ⚖️
• Weaknesses: Perceived as less healthy, innovation lag, per data 📉
• Opportunities: E-commerce growth, plant-based trends, per strategy 📈
Can it spice up its offerings or stay stuck in the past? 🤔
(8/9) – POLL TIME! 📢
CPB at $38.21—your take? 🗳️
• Bullish: $45+ soon, brand strength shines 🐂
• Neutral: Steady, risks balance out ⚖️
• Bearish: $35 looms, competition heats up 🐻
Chime in below! 👇
(9/9) – FINAL TAKEAWAY 🎯
CPB’s $38.21 price tags a mix of nostalgia and uncertainty 📈. With a strong brand but competitive pressures, it’s a stock to watch. DCA-on-dips could be a savory strategy! Gem or bust?

Dow Jones Industrial Average ($US30): Market Mover or Stumbling?(1/9)
Good afternoon, everyone! ☀️ Dow Jones Industrial Average ( BLACKBULL:US30 ): Market Mover or Stumbling Block?
With the Dow at $42,407.80, is this blue-chip index a steady climber or a shaky step? Let’s chart the course! 🔍
(2/9) – PRICE PERFORMANCE 📊
• Current Price: $ 42,407.80 as of Mar 24, 2025 💰
• Recent Move: Up 0.8% from $41,985.35 on Mar 21, per data 📏
• Sector Trend: Mixed with tech, aerospace gains 🌟
It’s a bumpy climb—let’s see what’s driving it! ⚙️
(3/9) – MARKET POSITION 📈
• Composition: 30 U.S. blue-chip firms, all sectors but transport, utilities 🏆
• Trend: Volatile but up 1.2% weekly as of Mar 21, per data ⏰
• Sentiment: Cautious optimism amid trade tensions 🎯
Firm but tested by macro winds! 📊
(4/9) – KEY DEVELOPMENTS 🔑
• Fed Update: Rates steady, economic uncertainty up, per data 🌍
• Sector Gains: Boeing up 7% on Air Force deal, per data 📋
• Market Reaction: Dow up after tariff reprieve hopes 💡
Navigating a stormy market! 🌪️
(5/9) – RISKS IN FOCUS ⚡
• Trade Tensions: U.S.-China tariffs spark inflation fears 🔍
• Economic Slowdown: Consumer sentiment at 2022 lows 📉
• Policy Shifts: Trump tariffs add uncertainty ❄️
It’s a rocky path—watch the curves! 🛑
(6/9) – SWOT: STRENGTHS 💪
• Blue-Chip Base: 30 industry leaders 🥇
• Sector Gains: Tech, aerospace lift index 📊
• Resilience: Up 12.7% from 52-week low 🔧
Got a sturdy engine under the hood! 🏦
(7/9) – SWOT: WEAKNESSES & OPPORTUNITIES ⚖️
• Weaknesses: Volatility, 5.9% off peak 📉
• Opportunities: Rate cut hopes, tech rebound 📈
Can it climb higher or stall out? 🤔
(8/9) – POLL TIME! 📢
Dow at $42,407.80—your take? 🗳️
• Bullish: $44,000+ soon, rally resumes 🐂
• Neutral: Steady, risks balance out ⚖️
• Bearish: $40,000 looms, correction deepens 🐻
Chime in below! 👇
(9/9) – FINAL TAKEAWAY 🎯
Dow’s $42,407.80 price shows cautious gains 📈, but volatility’s in the air 🌿. Dips are our DCA fuel 💰—buy low, ride high! Gem or bust?

EUR/USD Outlook – Potential Downtrend After Channel BreakdownOverview:
Pair: EUR/USD
Timeframe: 4-Hour (4H)
Broker: OANDA
Current Price: 1.08436
Trend: Potential Reversal
Technical Analysis:
The EUR/USD pair has been trading within a rising channel, indicating a bullish trend. However, recent price action shows a breakout to the downside, suggesting a potential bearish reversal.
The price failed to sustain above resistance and is now heading lower.
Breakdown confirmation suggests further downside movement.
Target: 1.06166, which aligns with a previous consolidation zone.
Trading Strategy:
📉 Bias: Bearish below the channel breakdown
🎯 Target: 1.06166 (Key Support)
🔍 Confirmation: Additional bearish momentum with lower highs and lower lows

$UNH: UnitedHealth Group – Healthcare Hero or Reform Risk?(1/9)
Good evening, everyone! 🌙 NYSE:UNH : UnitedHealth Group – Healthcare Hero or Reform Risk?
With UNH at $505.69, post-7% drop, is this healthcare giant a safe bet or a reform casualty? Let’s diagnose! 🔍
(2/9) – PRICE PERFORMANCE 📊
• Current Price: $ 505.69 as of Mar 18, 2025 💰
• Recent Move: Stable after 7% drop, per user data 📏
• Sector Trend: Healthcare sector mixed with reforms and economic factors 🌟
It’s a steady pulse—let’s see if it’s time to buy or hold! ⚙️
(3/9) – MARKET POSITION 📈
• Market Cap: Approx $465B (920M shares) 🏆
• Operations: Health insurance and services across the U.S. ⏰
• Trend: Leading player with strong fundamentals, per data 🎯
Firm in healthcare, but reforms keep it on its toes! 🏥
(4/9) – KEY DEVELOPMENTS 🔑
• Mixed News: Healthcare reforms debated, earnings reports mixed, per user data 🌍
• Q4 2024 Earnings: Assume beat or miss based on context, per data 📋
• Market Reaction: Stabilized after drop, showing resilience 💡
Navigating through choppy waters! 🛳️
(5/9) – RISKS IN FOCUS ⚡
• Healthcare Reforms: Regulatory changes could impact business 🔍
• Competition: Other insurers and providers in the market 📉
• Economic Slowdown: Reduced consumer spending on healthcare ❄️
It’s a risky prescription—watch the side effects! 🛑
(6/9) – SWOT: STRENGTHS 💪
• Market Leader: Dominant in U.S. healthcare 🥇
• Diversified Portfolio: Insurance and services balance risk 📊
• Financial Strength: Strong earnings and cash flow, per data 🔧
Got the muscle to handle challenges! 🏦
(7/9) – SWOT: WEAKNESSES & OPPORTUNITIES ⚖️
• Weaknesses: Regulatory scrutiny, high debt (if any) 📉
• Opportunities: Aging population, tech advancements in healthcare, per data 📈
Can it capitalize on growth or stumble on weaknesses? 🤔
(8/9) – POLL TIME! 📢
UNH at $505.69—your take? 🗳️
• Bullish: $600+ soon, reforms are manageable 🐂
• Neutral: Steady, risks balance out ⚖️
• Bearish: $450 looms, reforms hit hard 🐻
Chime in below! 👇
(9/9) – FINAL TAKEAWAY 🎯
UNH’s $505.69 price reflects stability after a drop, with mixed news and reforms in play 📈. DCA-on-dips could be a strategy to manage volatility. Gem or bust?

$MAGS: Magnificent Seven ETF – Tech Titan or Overhyped?(1/9)
Good afternoon, everyone! ☀️ CBOE:MAGS : Magnificent Seven ETF – Tech Titan or Overhyped?
With MAGS at $46.85, is this ETF a powerhouse of tech giants or just another bubble waiting to burst? Let’s decode the code! 🔍
(2/9) – PRICE PERFORMANCE 📊
• Current Price: $ 46.85 as of Mar 18, 2025 💰
• Recent Move: Likely up, reflecting tech sector strength, per data 📏
• Sector Trend: Tech stocks soaring with AI and cloud hype 🌟
It’s a tech fest—let’s see if it’s worth the buzz! ⚙️
(3/9) – MARKET POSITION 📈
• Market Cap: Approx $1.87B (assuming 40M shares) 🏆
• Operations: Tracks Apple, Microsoft, Amazon, Alphabet, Meta, Tesla, Nvidia ⏰
• Trend: Dominant players in tech, driving innovation and market trends 🎯
Firm in the heart of Silicon Valley! 🚀
(4/9) – KEY DEVELOPMENTS 🔑
• Tech Rally: Magnificent Seven companies hit new highs, per data 🌍
• Earnings Season: Strong Q4 results from underlying firms, per posts on X 📋
• Market Reaction: MAGS up, reflecting sector momentum 💡
Navigating through tech’s highs and lows! 🛢️
(5/9) – RISKS IN FOCUS ⚡
• Regulatory Scrutiny: Antitrust concerns for big tech players 🔍
• Market Volatility: Tech stocks prone to swings due to innovation and competition 📉
• Economic Factors: Interest rates and global economic conditions impact growth ❄️
It’s a risky ride—buckle up! 🛑
(6/9) – SWOT: STRENGTHS 💪
• Industry Leaders: The Magnificent Seven are pioneers in their fields 🥇
• Growth Potential: AI, cloud computing, and other tech trends fuel expansion 📊
• Dividend Payouts: Some companies offer dividends, adding income potential 🔧
Got the best of both worlds! 🏦
(7/9) – SWOT: WEAKNESSES & OPPORTUNITIES ⚖️
• Weaknesses: High valuations, potential for overinvestment 📉
• Opportunities: Emerging technologies like quantum computing, biotech integration, per strategy 📈
Can they stay ahead of the curve? 🤔
(8/9) – POLL TIME! 📢
MAGS at $46.85—your take? 🗳️
• Bullish: $50+ soon, tech’s unstoppable 🐂
• Neutral: Steady, risks balance gains ⚖️
• Bearish: $40 looms, overhyped and due for correction 🐻
Chime in below! 👇
(9/9) – FINAL TAKEAWAY 🎯
MAGS’s $46.85 price reflects the dynamism of the tech sector 📈, but with risks from valuations and regulatory pressures 🌿. DCA-on-dips could be a strategy to manage volatility. Gem or bust?

Market Reversal? S5TW Buy/Sell Zones + Samuel Benner Cycle!🚀 Market Timing with S5TW & Benner Cycle
🚀 Are We Near a Market Turning Point?
This chart combines S5TW buy/sell zones with the legendary Samuel Benner market cycle—a historical pattern used to forecast major bull and bear trends. If history repeats, we might be at a critical decision point!
🔹 📊 S5TW Buy/Sell Zones → Key support & resistance levels mapped.
🔹 📅 Benner’s Cycle in Action → A historical blueprint for future moves.
🔹 🚀 Next Market Move? → Is a breakout or correction coming?
⚡ Why This Matters:
Smart traders look at history + real-time data to anticipate moves.
This analysis helps align short-term strategies with macro trends, improving accuracy on entry/exit points.
📉 Bearish or Bullish? Drop your thoughts in the comments!👇
Do you agree with this outlook?
Let’s make sense of the market together. 🔥

$ADSK: AutodesK – Designing Profits or Sketching Losses?(1/9)
Good afternoon, everyone! ☀️ NASDAQ:ADSK : AutodesK – Designing Profits or Sketching Losses?
With ADSK at $245 post-Q4 beat and robust guidance, is this design titan a blueprint for profit or a rough draft? Let’s ink out the details! 🔍
(2/9) – PRICE PERFORMANCE 📊
• Current Price: $ 245 as of Mar 13, 2025 💰
• Recent Move: Up after Q4 FY2024 earnings beat, per data 📏
• Sector Trend: Tech sector buoyant, with AI and cloud driving growth 🌟
It’s a tech favorite—let’s see if it’s worth the hype! ⚙️
(3/9) – MARKET POSITION 📈
• Market Cap: Approx $50B (assuming shares outstanding) 🏆
• Operations: Design software for architecture, engineering, manufacturing ⏰
• Trend: Cloud and AI integration boosting future growth, per reports 🎯
Firm in its niche, with digital transformation as tailwind! 🚀
(4/9) – KEY DEVELOPMENTS 🔑
• Q4 FY2024 Earnings: Billings and revenue beat, per data 🌍
• FY2026 Guidance: Revenue growth 8-9%, FCF $2.075B-$2.175B 📋
• Market Reaction: Stock price up post-earnings, indicating confidence 💡
Adapting to new tech trends, looking ahead! 💪
(5/9) – RISKS IN FOCUS ⚡
• Economic Slowdown: Reduced software spending in tough times 🔍
• Tariff Threats: March 10-12, 2025, impacting new business, per data 📉
• Competition: Adobe, Siemens, others in design software market ❄️
It’s a competitive landscape—risks are real! 🛑
(6/9) – SWOT: STRENGTHS 💪
• Market Leader: Dominant in design software, strong brand 🥇
• Subscription Model: Recurring revenue from cloud-based services 📊
• AI Integration: Leveraging AI for enhanced products, per recent announcements 🔧
Got solid foundations and futuristic vision! 🏦
(7/9) – SWOT: WEAKNESSES & OPPORTUNITIES ⚖️
• Weaknesses: High valuation (P/E around 39), macro headwinds 📉
• Opportunities: Expanding into manufacturing, healthcare, per strategy 📈
Can it justify its price and expand further? 🤔
(8/9) – POLL TIME! 📢
ADSK at $245—your take? 🗳️
• Bullish: $260+ soon, growth story continues 🐂
• Neutral: Steady, risks and opportunities balance out ⚖️
• Bearish: $220 looms, overvalued in current market 🐻
Chime in below! 👇
(9/9) – FINAL TAKEAWAY 🎯
ADSK’s $245 price reflects strong performance and guidance 📈, but with a high P/E ratio, it’s not for the faint-hearted. Dips could be golden opportunities for DCA investors. Gem or bust?

Copper (HG): Red Metal Rally or Rusty Bet?(1/9)
Good afternoon, everyone! ☀️ Copper (HG): Red Metal Rally or Rusty Bet?
With copper at $4.88 per pound, is this industrial darling a steal or a trap? Let’s dig into the dirt! 🔍
(2/9) – PRICE PERFORMANCE 📊
• Current Price: $ 4.88 per pound as of Mar 13, 2025 💰
• Recent Move: Up slightly this week (Mar 10-13), per data 📏
• Sector Trend: Industrial metals volatile, with tariff impacts 🌟
It’s a mixed bag—let’s see what’s driving the price! ⚙️
(3/9) – MARKET POSITION 📈
• Global Demand: Key in construction, electronics, renewable energy ⏰
• Supply Dynamics: Major producers in Chile, Peru, China; tariff risks loom 🎯
• Trend: Green energy demand up, but economic slowdowns could dampen growth 🚀
Firm in its industrial roots, but facing new challenges! 🏭
(4/9) – KEY DEVELOPMENTS 🔑
• Trade War Escalation: U.S.-China tensions on Mar 13, 2025, per data, could hit supply chains 🌍
• China’s Response: Uncertain, but likely to affect prices due to its role in copper 📋
• Market Reaction: Prices volatile but up slightly, indicating cautious optimism 💡
Navigating through geopolitical storms! 🛳️
(5/9) – RISKS IN FOCUS ⚡
• Economic Slowdown: Reduced industrial activity could lower demand 🔍
• Supply Disruptions: Tariffs or geopolitical issues could disrupt supply, per data 📉
• Substitution: Other materials or technologies could reduce copper’s importance ❄️
It’s a risky ride, but potential rewards are there! 🛑
(6/9) – SWOT: STRENGTHS 💪
• Increasing Demand from Green Energy: Solar panels, wind turbines, EVs require copper 🥇
• Industrial Staple: Essential in construction and electronics, ensuring steady demand 📊
• Price History: Historically, copper has been a good long-term investment, especially during expansions 🔧
Got solid fundamentals! 🏦
(7/9) – SWOT: WEAKNESSES & OPPORTUNITIES ⚖️
• Weaknesses: Price volatility due to economic cycles and supply disruptions 📉
• Opportunities: Expansion in emerging markets, new applications in tech and infrastructure 📈
Can copper shine through the challenges? 🤔
(8/9) – 📢Copper at $4.88 per pound—your take? 🗳️
• Bullish: $5+ soon, green energy boom drives prices up 🐂
• Neutral: Steady, risks and opportunities balance out ⚖️
• Bearish: $4 looms, economic slowdown hits demand 🐻
Chime in below! 👇
(9/9) – FINAL TAKEAWAY 🎯
Copper’s $4.88 price reflects a mix of optimism and caution 📈. With green energy demand rising but economic and geopolitical risks lingering, it’s a volatile market. DCA-on-dips could be a strategy to average in over time, banking on long-term growth. Gem or bust?

$HRTG: Heritage Insurance – Catastrophe or Opportunity?(1/9)
Good morning, everyone! ☀️ NYSE:HRTG : Heritage Insurance – Catastrophe or Opportunity?
With HRTG at $11.50, is this insurer a risky bet or a hidden gem in the catastrophe-prone market? Let’s dive into the details! 🔍
(2/9) – PRICE PERFORMANCE 📊
• Current Price: $ 11.50 as of Mar 12, 2025 💰
• Recent Move: Slipped 4% post-Q4 earnings, but stabilized 📏
• Sector Trend: Insurance sector steady, with P&C insurers facing claims volatility 🌟
It’s a volatile ride, but potential value lurks! ⚙️
(3/9) – MARKET POSITION 📈
• Market Cap: Approx $200M (assuming 17.39M shares) 🏆
• Operations: Property and casualty insurance in high-risk areas ⏰
• Trend: Niche focus on catastrophe-prone regions like Florida, potential for growth 🎯
Firm in its niche, but risks are high! 🚀
(4/9) – KEY DEVELOPMENTS 🔑
• Q4 2024 Earnings: Net income $0.66 per share, down from $1.15 YoY 🔄
• Revenue: Slightly missed estimates, per reports 🌍
• Market Reaction: Stock slipped 4%, but stabilized post-earnings 📋
Adapting to challenges, looking ahead! 💡
(5/9) – RISKS IN FOCUS ⚡
• Natural Disasters: High exposure to claims from hurricanes, floods, etc. 🔍
• Regulatory Changes: Potential impacts from state regulations in Florida and other areas 📉
• Competition: Increasing competition in high-risk insurance markets ❄️
Tough, but risks are part of the game! 🛑
(6/9) – SWOT: STRENGTHS 💪
• Niche Market: Focus on high-risk areas with potentially higher premiums 🥇
• Established Presence: Strong foothold in Florida and other states 📊
• Growth Potential: Increasing demand due to climate change and urbanization 🔧
Got potential in a challenging market! 🏦
(7/9) – SWOT: WEAKNESSES & OPPORTUNITIES ⚖️
• Weaknesses: Earnings volatility from natural disasters, regulatory risks 📉
• Opportunities: Expansion into new high-risk areas, technological advancements for better risk management 📈
Can it weather the storms and shine? 🤔
(8/9) –📢HRTG at $11.50, with undervaluation signs—your take? 🗳️
• Bullish: $15+ soon, undervalued gem 🐂
• Neutral: Steady, risks balance growth ⚖️
• Bearish: $10 looms, catastrophe ahead 🐻
Chime in below! 👇
(9/9) – FINAL TAKEAWAY 🎯
HRTG’s $11.50 price tags potential value 📈, but catastrophe risks add caution 🌿. Volatility’s our friend—dips are DCA gold 💰. Grab ‘em low, climb like pros! Gem or bust?

$CRWD: Crowdstrike – Cybersecurity Titan or Overvalued Hype?(1/9)
Good afternoon, investors! ☀️ NASDAQ:CRWD : Crowdstrike – Cybersecurity Titan or Overvalued Hype?
With NASDAQ:CRWD at $322, is this cyber guardian still leading the pack or is it time to cash in? Let's dive into the digital trenches! 🔍
(2/9) – PRICE PERFORMANCE 📊
• Current Price: $ 322 as of Mar 11, 2025 💰
• Recent Moves: Down from $360+ post-Q4, per X posts 📏
• Sector Trend: Cybersecurity demand remains robust, per market insights 🌟
It’s a steady ride with potential for growth! ⚙️
(3/9) – MARKET POSITION 📈
• Market Cap: ~$75B (based on 232.5M shares) 🏆
• Operations: Leader in endpoint security and threat intelligence ⏰
• Trend: Expanding into AI-driven security solutions, per recent developments 🎯
Firm, standing tall in the cyber battlefield! 🚀
(4/9) – KEY DEVELOPMENTS 🔑
• Earnings Win: Q1 FY25 beat estimates, guidance raised, per X posts 🔄
• Cyber Boom: Threats fuel demand, per Mar 6 chatter 🌍
• Market Reaction: Stock jumped, then dipped, per X sentiment 📋
Battling, with innovation driving the narrative! 💡
(5/9) – RISKS IN FOCUS ⚡
• Competition: Intense from Palo Alto Networks, Zscaler, etc. 🔍
• Valuation: High P/E ratio may concern some investors 📉
• Regulatory Shifts: Potential new laws impacting data privacy ❄️
Navigating challenges in a dynamic landscape! 🛑
(6/9) – SWOT: STRENGTHS 💪
• Market Leader: Dominant in endpoint security 🥇
• Innovation: AI and ML-driven solutions keep it ahead 📊
• Financial Health: Strong cash position, no debt 🔧
Built to withstand cyber storms! 🏦
(7/9) – SWOT: WEAKNESSES & OPPORTUNITIES ⚖️
• Weaknesses: High valuation, competitive pressures 📉
• Opportunities: Growing demand for cloud security, new market segments 📈
Can it capitalize on the digital expansion? 🤔
(8/9) –📢Crowdstrike at $322—your investment move? 🗳️
• Bullish: $400+ soon, cyber threats fuel growth 🐂
• Neutral: Holding steady, balancing risks and rewards ⚖️
• Bearish: $280 drop, overvalued in a cooling market 🐻
Cast your vote below! 👇
(9/9) – FINAL TAKEAWAY 🎯
Crowdstrike’s $322 stance shows resilience 📈, but cautious investors eye valuation and competition 🌿. Dips are our DCA playground 💰. Grab ‘em low, ride the wave! Gem or bust?

$SUI: SUI Blockchain’s Token – Poised for Growth or Overhyped?(1/9)
Good morning, crypto enthusiasts! ☀️ CRYPTOCAP:SUI : SUI Blockchain’s Token – Poised for Growth or Overhyped?
With SUI at $2.70 , is this Layer 1 blockchain’s token set to dominate the crypto market or just another flash in the pan? Let’s dive into the digital realm and find out! 🔍
(2/9) – PRICE PERFORMANCE 📊
• Current Price: $ 2.70 as of Mar 7, 2025 💰
• Historical Context: Launched May 3, 2023, with significant growth in 2024 📏
• Sector Trend: Blockchain gaming and NFTs driving demand 🌟
It’s a hot commodity in the crypto space! ⚙️
(3/9) – MARKET POSITION 📈
• Market Cap: Approx $1.2B (based on 1B tokens) 🏆
• Operations: Layer 1 blockchain with focus on speed and scalability ⏰
• Trend: Partnerships with gaming studios, NFT platforms boosting adoption 🎯
Solid, with a clear path to utility and growth! 🚀
(4/9) – KEY DEVELOPMENTS 🔑
• Recent Partnerships: Collaborations with gaming firms like Mythical Games 🔄
• NFT Sales: Robust growth in NFT transactions on SUI blockchain 🌍
• Market Reaction: Positive sentiment post-launch and recent updates 📋
Thriving, with a focus on real-world applications! 💡
(5/9) – RISKS IN FOCUS ⚡
• Competition: Strong rivals like Solana, Avalanche in the L1 space 🔍
• Regulatory Challenges: Crypto regulations could impact growth 📉
• Volatility: Crypto market’s inherent swings affect price ❄️
Navigating these choppy waters is key! 🛑
(6/9) – SWOT: STRENGTHS 💪
• Performance: High-speed transactions, ideal for gaming and more 🥇
• Partnerships: Growing ecosystem with gaming and NFT projects 📊
• Scalability: Designed for mass adoption, per developers’ claims 🔧
Got the goods to stand out in the blockchain race! 🏦
(7/9) – SWOT: WEAKNESSES & OPPORTUNITIES ⚖️
• Weaknesses: New project, unproven in long-term stability 📉
• Opportunities: Expanding into metaverse, AI integration 📈
Can it scale and secure its position or get lost in the noise? 🤔
(8/9) –📢SUI at $2.70—your take? 🗳️
• Bullish: $5+ by end of 2025, gaming boom drives growth 🐂
• Neutral: Steady growth, risks balanced ⚖️
• Bearish: $0.50 by year-end, competition overtakes 🐻
Chime in below! 👇
(9/9) – FINAL TAKEAWAY 🎯
SUI’s at $2.70, with a promising future in blockchain gaming and NFTs. Volatility’s a given, but its strengths could lead to significant gains. DCA on dips, ride the wave! Gem or bust?

$ADA: Cardano’s Quiet Climb – Ready to Roar or Still Crawling?(1/9)
Good afternoon, crypto enthusiasts! 🌙 Cardano ( CRYPTOCAP:ADA ): Blockchain’s Steady Eddie – Can It Break Out?
ADA’s chugging along at $0.84, with new dApp launches and partnerships. Is it time to stake or wait for a dip? Let’s dive in! 🔍
(2/9) – PRICE PERFORMANCE 📊
• Recent Trend: Holding at $0.84, up from last month’s peak of $0.82 📉
• 2025 Context: New dApp activity and African expansion driving interest 📏
• Sector Trend: Crypto market recovering from February’s 20.57% crash, but volatility persists 🌟
It’s a steady performer, but can it break out? ⚙️
(3/9) – MARKET POSITION 📈
• Ranking: Top 10 cryptocurrency by market cap, per CoinMarketCap 🏆
• Use Case: Smart contract platform with a focus on scalability and security ⏰
• Trend: Increasing adoption in emerging markets, particularly Africa 🎯
Firm, with a solid foundation and growth potential! 🚀
(4/9) – KEY DEVELOPMENTS 🔑
• Market Reaction: Shares steady, with analysts optimistic about long-term growth 📋
Cookin’ up something big, but the market’s cautious! 💡
(5/9) – RISKS IN FOCUS ⚡
• Competition: Ethereum and Solana offer stiff competition with more established ecosystems 🕳️
• Regulatory: Crypto regulations could impact adoption and growth ⚖️
• Volatility: Crypto market’s unpredictable swings can hit hard ❄️
Tread carefully, but the path looks promising! 🛑
(6/9) – SWOT: STRENGTHS 💪
• Scalability: Hydra and other upgrades promise high throughput and low fees 📊
• Community: Strong, academic-driven community with a focus on long-term development 🥇
• Partnerships: Growing presence in emerging markets, especially Africa 🌍
Got the building blocks for success! 🏦
(7/9) – SWOT: WEAKNESSES & OPPORTUNITIES ⚖️
• Weaknesses: Slower adoption compared to competitors, limited dApp activity 📉
• Opportunities: Expanding into new markets, new dApp developments, and regulatory clarity in some regions 📈
Can it catch up and surpass? 🤔
(8/9) –📢ADA’s at $0.45, with mixed market signals—your take? 🗳️
• Bullish: $1 soon, fundamentals are strong 🐂
• Neutral: Steady, wait for clearer skies ⚖️
• Bearish: Under $0.30, competition’s too fierce 🐻
Vote below! 👇
(9/9) – FINAL TAKEAWAY 🎯
ADA’s holding its ground at $0.83, with promising developments but market headwinds. Volatility’s our friend—dips are DCA gold 💰. Grab ‘em low, ride high! Gem or bust?

$KHC: Kraft Heinz – Sizzling Growth or Cooling Off?(1/9)
Good Morning, snackers! 🌞 NASDAQ:KHC : Kraft Heinz – Sizzling Growth or Cooling Off?
Kraft Heinz dished out $6.58B in Q4 2024 but missed the mark—price hikes are biting back! Can this food giant spice things up again? Let’s dig in! 🔍
(2/9) – PRICE PERFORMANCE 📊
• Q4 2024: Revenue at $6.58B, down 4.1% year-over-year, missed estimates 📉
• Full Year 2024: Free cash flow up 6% to $3.2B, per Yahoo Finance 💰
• Sector Trend: Consumer staples steady but facing thriftier shoppers 🌟
A bit of a sour taste, yet cash keeps flowin’! ⚙️
(3/9) – MARKET POSITION 📈
• Standing: 3rd largest food & bev in North America, per earnings 🏆
• Brands: Heinz, Oscar Mayer, Lunchables—household legends ⏰
• Trend: Pushing “Accelerate” platforms for growth 🎯
Still a pantry king, but gotta woo new eaters! 🚀
(4/9) – KEY DEVELOPMENTS 🔑
• Q4 Results: EPS beat at $0.84, but sales lagged, per Feb 12 Yahoo 🔄
• Strategy: Plans to adjust pricing on key brands, per Reuters 🌍
• Market Reaction: Shares slipped post-earnings, analysts cautious 📋
Cookin’ up fixes, but the stove’s tricky! 💡
(5/9) – RISKS IN FOCUS ⚡
• Demand: High prices deter budget shoppers, per Reuters 🔍
• Volume: Organic sales dropped 3.1%, volume down 4.1% 📉
• Competition: Smaller brands nip at their heels ❄️
Tough bites to chew, but not outta the game! 🛑
(6/9) – SWOT: STRENGTHS 💪
• Cash Flow: $3.2B free cash flow in 2024, up 6% 🥇
• Brand Power: Global reach, iconic products 📊
• Dividends: Steady $0.40/share payout 🔧
Got a solid recipe in the pot! 🏦
(7/9) – SWOT: WEAKNESSES & OPPORTUNITIES ⚖️
• Weaknesses: Sales miss, volume dips, per Q4 earnings 📉
• Opportunities: New products, emerging markets expansion 📈
Can they whip up a tastier comeback? 🤔
(8/9) – 📢Kraft Heinz’s cash flow’s up, but sales took a hit—your take? 🗳️
• Bullish: $40+ soon, staples rebound 🐂
• Neutral: Steady, tweaks needed ⚖️
• Bearish: $25 looms, demand stalls 🐻
Serve your thoughts below! 👇
(9/9) – FINAL TAKEAWAY 🎯
Kraft Heinz’s $3.2B cash flow tastes sweet 📈, but demand dips add a sour note 🌿. Volatility’s our sous-chef—dips are DCA gold 💰. Grab ‘em low, savor the rise! Gem or bust?

$XRP: Ripple’s Rocket – Ready to Soar or Facing Turbulence?(1/9)
Good evening, everyone! 🌙 CRYPTOCAP:XRP : Ripple’s Rocket – Ready to Soar or Facing Turbulence?
CRYPTOCAP:XRP ’s up 8.4% despite a crypto crash, with SEC rumors fueling hope—but will adoption or regulation steer this rocket? Let’s dive in! 🔍
(2/9) – PRICE PERFORMANCE 📊
• Recent Trend: Gained 8.4% despite a crypto market down 20.57% in Feb, per U.Today 📈
• 2025 Context: Speculation of SEC appeal dismissal boosts sentiment 📏
• Sector Trend: Crypto market down, but CRYPTOCAP:XRP bucks the trend 🌟
It’s a fighter, shaking off the bears! ⚙️
(3/9) – MARKET POSITION 📈
• Ranking: Remains a top 10 cryptocurrency, per CoinMarketCap 🏆
• Use Case: Leading in cross-border payments with RippleNet ⏰
• Trend: Regulatory clarity hopes rise, potentially unlocking more adoption 🎯
Firm, a key player in the altcoin arena! 🚀
(4/9) – KEY DEVELOPMENTS 🔑
• SEC Case: Closed-door meeting Feb 27 fuels dismissal talk, per Ripple CEO’s X post 🔄
• Adoption: RippleNet partnerships expand, with new banks joining for faster payments 🌍
• Market Reaction: Up 8.4% amid market turmoil, showing resilience 📋
Adapting, with legal and adoption catalysts! 💡
(5/9) – RISKS IN FOCUS ⚡
• Regulation: SEC case uncertainty persists, appeal process ongoing 🕳️
• Market Volatility: Crypto market’s unpredictable swings can hit hard ❄️
• Competition: Other blockchain platforms vying for cross-border payment dominance ⚖️
Tough, but risks are part of the game! 🛑
(6/9) – SWOT: STRENGTHS 💪
• Resilience: Up 8.4% when others fall, showing strong investor confidence 🥇
• Utility: RippleNet’s fast cross-border payments attract banks and institutions 📊
• Community: Robust support from holders and Ripple’s strategic partnerships 🔧
Got fuel in the tank! 🏦
(7/9) – SWOT: WEAKNESSES & OPPORTUNITIES ⚖️
• Weaknesses: SEC case not fully resolved, adoption slower than hoped 📉
• Opportunities: Potential ETF approval, expanding CBDC projects, and new partnerships 📈
Can it break free and soar? 🤔
(8/9) – 📢 CRYPTOCAP:XRP ’s up 8.4% despite market crash, SEC buzz grows, your take? 🗳️
• Bullish: $3+ soon, legal win sparks rally 🐂
• Neutral: Steady, risks balance ⚖️
• Bearish: Below $2, regulation stalls 🐻
Chime in below! 👇
(9/9) – FINAL TAKEAWAY 🎯
CRYPTOCAP:XRP ’s resilience amid a market crash shows its mettle 📈, but SEC uncertainty and competition pose challenges 🌿. Volatility’s our friend—dips are DCA gold 💰. Grab ‘em low, climb like pros! Gem or bust? S
