Critical Bitcoin Support Levels: A Key Test for the FutureI was reviewing some of my old charts and came across this one because the patterns here are really interesting. Back on November 15th, I posted a head and shoulders pattern, but as you can see, it didn’t play out as expected. Every time Bitcoin made a new high, it got rejected and pulled back to the support level. This has happened multiple times Bitcoin goes up, makes a new high, and then retraces all the way back down to the same support level.
What’s different this time is that Bitcoin tried to push for new highs but failed, instead forming a lower high. Now, it’s testing a critical support level, marked by the two white trend lines on the chart. Bitcoin is currently at the support level, but the real test will come when it reaches that point of support. That’s the key support area that Bitcoin must hold.
Bitcoin really needs to maintain this support. If it breaks through, we could see a significant drop, potentially all the way down to $77,085.65. I don’t want to sound overly negative, but I’m just giving you a heads-up on what could unfold in 2025. All eyes will be on the $91,541.87 level this is the crucial support level. If Bitcoin can’t hold that area, it could trigger a further decline. Keep a close watch, as this could be a pivotal point for the next major move.
Marketwatch
📉 Crypto Total Market Cap ($TOTAL) Analysis 🌐📊 Current Market Status:
Total market capitalization once again trading at resistance.
Retesting the previous support line at $1.6T.
🔄 Potential Scenarios:
If rejected at current resistance, possible downside to $1.52T, and further to $1.4T - $1.45T.
Breakthrough at $1.6T may lead to the next resistance at $1.8T - $1.9T.
📣 Conclusion:
Current status involves testing key resistance and previous support levels.
Scenarios include rejection with potential downside or breakthrough to higher resistance.
Stay tuned for evolving market trends! 📰💹 #CryptoMarket #TotalMarketCap #MarketWatch 🌐📊
🔍🔧 Microchip Technology (MCHP) Analysis 🌐💻📊 Company Overview:
Microchip Technology, a global developer and manufacturer of smart and secure control solutions.
📉 Current Market Condition:
Navigating a cyclical downturn as acknowledged by its management.
🔄 Temporary Downturn:
Despite challenges, indications suggest Microchip's downturn is temporary.
Expected return to growth in the future.
📈 Historical Profitability:
Demonstrated remarkable ability to maintain high profitability throughout its history.
👥 CEO Perspective:
CEO Ganesh Moorthy anticipates a cycle similar to the rush to buy chips two years ago.
Forecasts an average annual revenue growth of 10% to 15% through fiscal year 2026.
📈 Market Analysis:
Bullish outlook on Microchip Technology (MCHP).
Suggested entry above the $80.00-$81.00 range.
🎯 Upside Target:
Upside target set in the $124.00-$126.00 range.
📣 Conclusion:
Microchip's history of profitability and CEO's confidence in future growth contribute to a positive outlook.
Entry suggestion and upside target align with potential industry rebound.
Stay informed for evolving market trends! 📰💹 #MicrochipTechnology #MCHPAnalysis #MarketWatch 🌐📊
INDUSINDBK - Ichimoku Breakout📈 Stock Name - Indusind Bank Limited
🌐 Ichimoku Cloud Setup:
1️⃣ Today's close is above the Conversion Line.
2️⃣ Future Kumo is Turning Bullish.
3️⃣ Chikou span is slanting upwards.
All these parameters are shouting BULLISH at the Current Market Price and even more bullishness anticipated AFTER crossing 1650.
🚨 Disclaimer: This is not a Buy or Sell recommendation. It's for educational purposes and a guiding light to learn trading in the market.
#CloudTrading
#IchimokuCloud
#IchimokuFollowers
#Ichimokuexpert
Excited about this analysis? Share your thoughts in the comments below!
👍 Like, Share, and Subscribe for daily market insights! 🚀
$AAPL - An Overview of the Primary to Minute CountsA count of the full cycle since covid lows, with a pitchfork imposed on top using fib levels. This could indicate where the final top might be for apple.
Being such a large part of the market, i dont see the big correction happening in the overall market until apple has reached 180-190.
First Penny Stock Added to the Trade Watchlist? KIQKIQ following trend pretty well. Adding this one to watchlist.
Many of these are in pivot points of uptrends.
Included
TAP
GRPN
GDDY
ON
GLW
DHR
NET
PFPT
CLDR
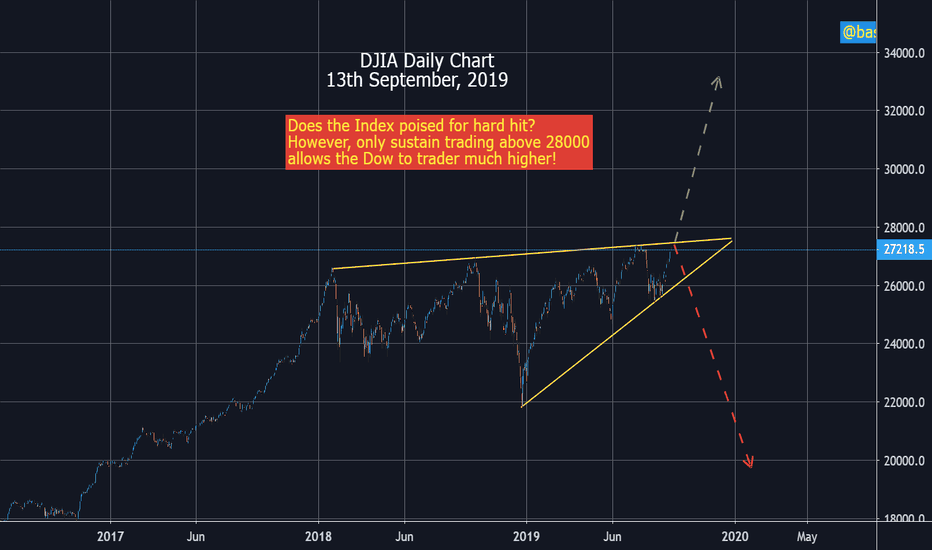
Dow Jones Industrial Average - Forthcoming Forecast - DJIMost probably we have seen a major historical top of
the Dow at 27000 area.From this top and for years to
come the trend may set down to below 10000.
Only smashing and sustain trading above the all time top
for few weeks change the scenario and the
market may resume the historical uptrend.


